


Graphical Abstract
INTRODUCTION
Cirrhosis of liver is an important cause for morbidity and mortality in all parts of the world. The prevalence of cirrhosis based on autopsy reports worldwide ranges from 4.5% to 9.5% in various population studies [1-3]. Globally, the disease specific death rate due to liver cirrhosis (LC) has increased from 1.5% to 1.9% from 1980 to 2010 and reached 2.4% in 2017. Asian data shows that in recent years, the mortality among cirrhotic patients was increasing because of alcohol as the etiology of liver disease [4-6].
The etiology and spectrum of liver diseases varies from region to region and from developed to developing countries [7,8]. Alcohol is the most common etiology worldwide [9-11] and in the East, hepatotrophic viruses (hepatitis B virus [HBV] and hepatitis C virus [HCV]) related chronic liver diseases had been more prevalent in the past. With the availability of better treatment options for viral related liver diseases and life style changes, the share of alcohol and nonalcoholic steatohepatitis (NASH) related liver diseases are rapidly increasing in the East as well [12-15]. Ascites, sepsis, hepatic encephalopathy (HE), hepatocellular carcinoma (HCC), spontaneous bacterial peritonitis (SBP), hepatorenal syndrome (HRS), variceal bleeding are the major cirrhosis related complications necessitating hospitalization with significant increase in morbidity, mortality and financial burden [16,17].
Though the literature is sparse from the Indian subcontinent [5,18], the available data suggests a change in spectrum of liver diseases and related complications with time and also there is an increase in the share of ethanol related cirrhosis [19]. Further, there is limited literature evaluating the long-term outcomes of cirrhotic patients who require hospitalization due to any liver related complications. The present study was undertaken to assess the current trends of etiology, complications as well as drivers of 1 year mortality for LC patients requiring hospital admissions, so as to identify the indicators of poor prognosis and to allocate the resources for targeted management of the sicker sub-group of patients. We specifically looked into differences between morbidity, complications and hospital readmissions in alcoholic cirrhosis patients and compared with cirrhosis due to other etiologies.
PATIENTS AND METHODS
Data source
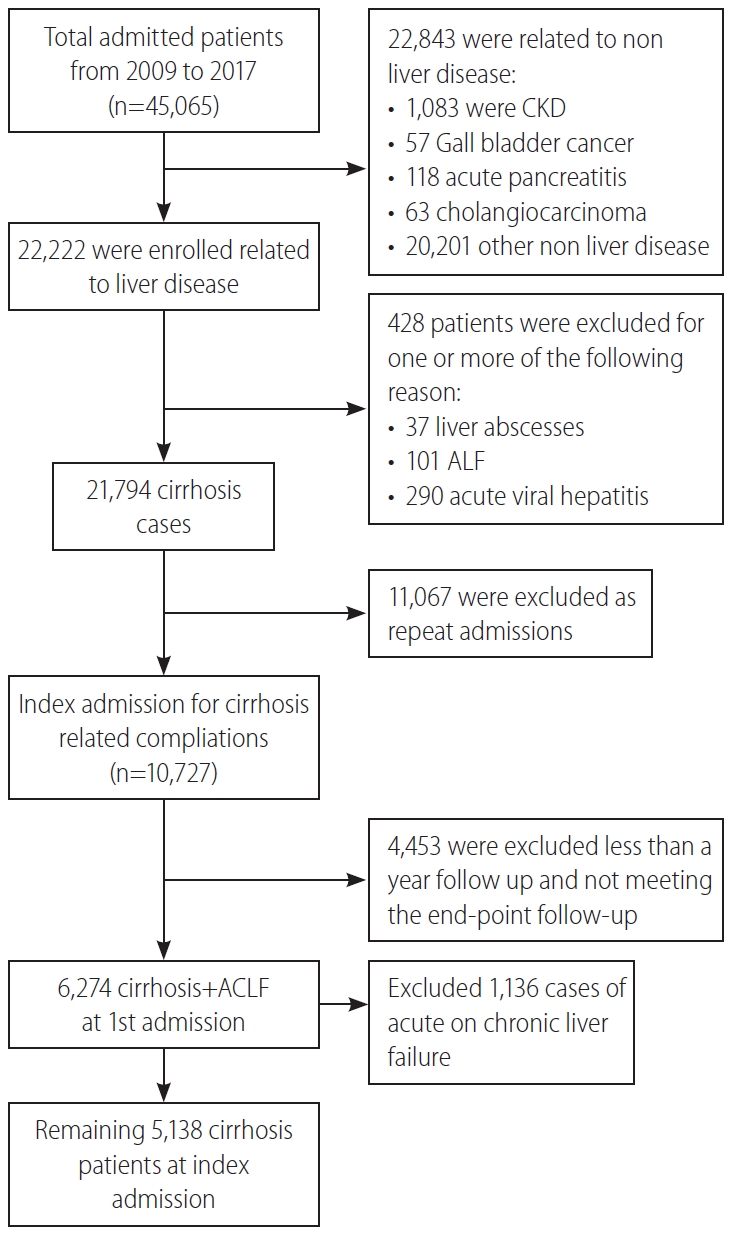
A retrospective study was conducted using electronic medical records of hospitalized patients from 2010 to 2017 at the Institute of Liver and Biliary Sciences (ILBS), New Delhi, India. The final diagnosis of LC was identified by International Classification of Diseases code K74.9 and further clinical and biochemical parameters as complications including sepsis, ascites, acute variceal bleeding, SBP, HE, HRS, HCC were extracted from discharge summary or taken from hospital information system. Each in-patient was allotted a date or year of admission defined as the first record of LC related admission. The subsequent admissions, if required by the patient in the same year, were considered as readmissions. If a patient required repeated admissions in a given time span, the patient was included in the study only once at index admission and only the baseline clinical profile was considered for reference evaluations. Patients with a minimum 1 year follow-up or mortality/liver transplant within 1 year were considered for inclusion into the current study. The demographic information, etiology, complications, Child-Pugh (CTP) and model for end-stage liver disease (MELD) scoring system were extracted. Out of the 22,222 admissions related to liver diseases from 2010 to 2017, 21,794 were related to LC cases, 11,067 were follow-up admissions/readmissions and 4,453 had less than 1 year of follow-up at ILBS and 1,136 cases had acute-on-chronic liver failure (ACLF), as defined by Asian Pacific Association for the Study of the Liver, were not considered in this study. Therefore, the final study cohort consisted of 5,138 admitted cirrhotic patients with observed follow-up of at least 1 year or death/liver transplantation within the first year of index presentation (Fig. 1).
As alcoholic hepatitis or any other acute liver insults presenting as ACLF, are known to have a very high disease severity and high short term mortality rates, it would be difficult to compare the disease severity and outcomes in comparison to the non-ACLF group (alcoholic cirrhosis, cirrhosis with HBV/HCV) requiring admission for reasons like acute kidney injury (AKI) or SBP or HE. Hence it was decided from the inception of the study design to avoid the confounding effects of the acute insult and hence ACLF was excluded.
The diagnosis of cirrhosis was made by clinical, biochemical, radiological, and/or histological parameters. All cirrhotics aged >18 years, with or without decompensation (ascites, variceal bleeding, HE, jaundice) requiring hospitalization due to any cause were evaluated for inclusion in the present study.
Alcohol related cirrhosis (ALC) was defined as LC occurring in the background of years of cirrhogenic alcohol consumption doses (>60 g/day for men and 40 g/day for women) in the absence of other causes of liver injury (HBV, HCV, etc.) as documented in the discharge summaries and hospital records. Non-ALC included cirrhosis due to chronic hepatitis B or C viral infection, non-alcoholic fatty liver disease, auto-immune liver disease and cholestatic liver disease. None of the patients in the non-ALC group had significant alcohol consumption (>20 g/day).
Standard of care as per the treating physicianŌĆÖs discretion was extended to every patient for the management of LC according to the etiology and clinical presentation. All the patients with SBP received secondary prophylaxis with norfloxacin, patients with low albumin and ascites received regular albumin infusions to maintain serum albumin levels. Large volume paracentesis was considered whenever clinically indicated. HCC screening with alfafeto-protein levels and ultrasound/triple phase computed tomography examinations were done in follow-up at every 6ŌĆō12 months intervals. HCC once diagnosed, was managed by liver transplantation, trans-arterial chemo-embolization, radiofrequency ablations or palliative care, as per standard protocols. Variceal bleeding was managed with endotherapy and repeat sessions were considered every 3 weeks till eradication and further every 3 months for prevention of rebleeds. HE was managed with anti-coma measures, lactulose enemas and infections were managed according to the standard institutional protocols. Liver transplantation, mainly living donor liver transplantation, was considered in patients fulfilling the criteria and was done whenever feasible.
Statistical analysis
All the results were expressed as mean┬▒standard deviation or percentage. Comparison of continuous variables was calculated by StudentŌĆÖs t-test and categorical variables were compared by PearsonŌĆÖs chi-square test or FisherŌĆÖs exact test. Analysis of variance was used for comparing more than two variables for parametric test and Kruskal Wallis for non-parametric variables. Poisson regression with robust standard errors was used to determine incidence risk ratio (IRR) of in-hospital mortality with respect to year of admission (follow-up 1 year), age gender, etiology, and LC complications. Logistic regression analysis was used to measure odds ratio [OR] for alcohol etiology. Propensity risk score analysis was done using MELD and CTP score. The nearest available matching (1:1) was taken with a calliper width of 0.001 of the logit of the propensity score. All tests were 2-tailed and p value of less than 0.05 was considered as significant. Data was analysed using IBM SPSS Statistics for Windows (version 23.0; IBM Corp., Armonk, NY, USA).
RESULTS
Baseline characteristics of liver cirrhotic patients
The median time to hospitalization from index presentation/diagnosis of cirrhosis in the cohort of 5,138 LC patients was 2 years (range, 0.2ŌĆō10). There were 4,085 males (79.5%; M:F, 3.88:1). The mean age at presentation was 48.8┬▒14.6 years. Majority (77.3%) of the patients were Ōēż60 years old. At the index admission, patients had ascites (72.3%), HE (31.3%), AVB (27.0%), and acute kidney injury (24.1%). Overall, 4,355 (84.8%) of the total cirrhotic patients (5,138) had decompensated liver disease at index admission. Only 465 cases (9.1%) were receiving beta-blockers at the time of inclusion. Diabetes Mellitus (DM; 37.4%), obesity (11.6%) were the most common co-morbidities in the cohort. A total of 163 patients (3.2%) underwent liver transplant.
The commonest etiology was alcohol related liver disease (39.5%), followed by non-alcoholic fatty liver disease (18.2%) and hepatitis B viral infection (10.8%). Alcohol (48.5%) was the most common cause of liver disease in men, followed by nonalcoholic fatty liver disease (NAFLD; 16.3%), HBV (11.3%), and HCV (7.6%). In females, NAFLD (25.8%) was the most common etiology followed by HCV (22.9%). Most common etiology for LC was alcohol in young, with 45% of <40 years of age and 53.9% of 41ŌĆō50 years of age. However, NAFLD was the commonest cause in elderly (31.8% in patients with >60 years of age). ALC presented at younger age, at the index hospitalization compared to other etiologies (alcohol, HBV, HCV, NASH, cryptogenic were 47.9┬▒10.8, 48.1┬▒18.6, 53.9┬▒10.8, 58.1┬▒9.1, 54.8┬▒13.6 years, respectively). The co-morbidities like hypothyroidism (7.0% vs. 24.9%, P<0.001), obesity (11% vs. 13.8%, P=0.02), and diabetes (36% vs. 40.8%, P=0.01) were more prevalent in the females.
Comparison between the demographics of ALC and non-ALC groups
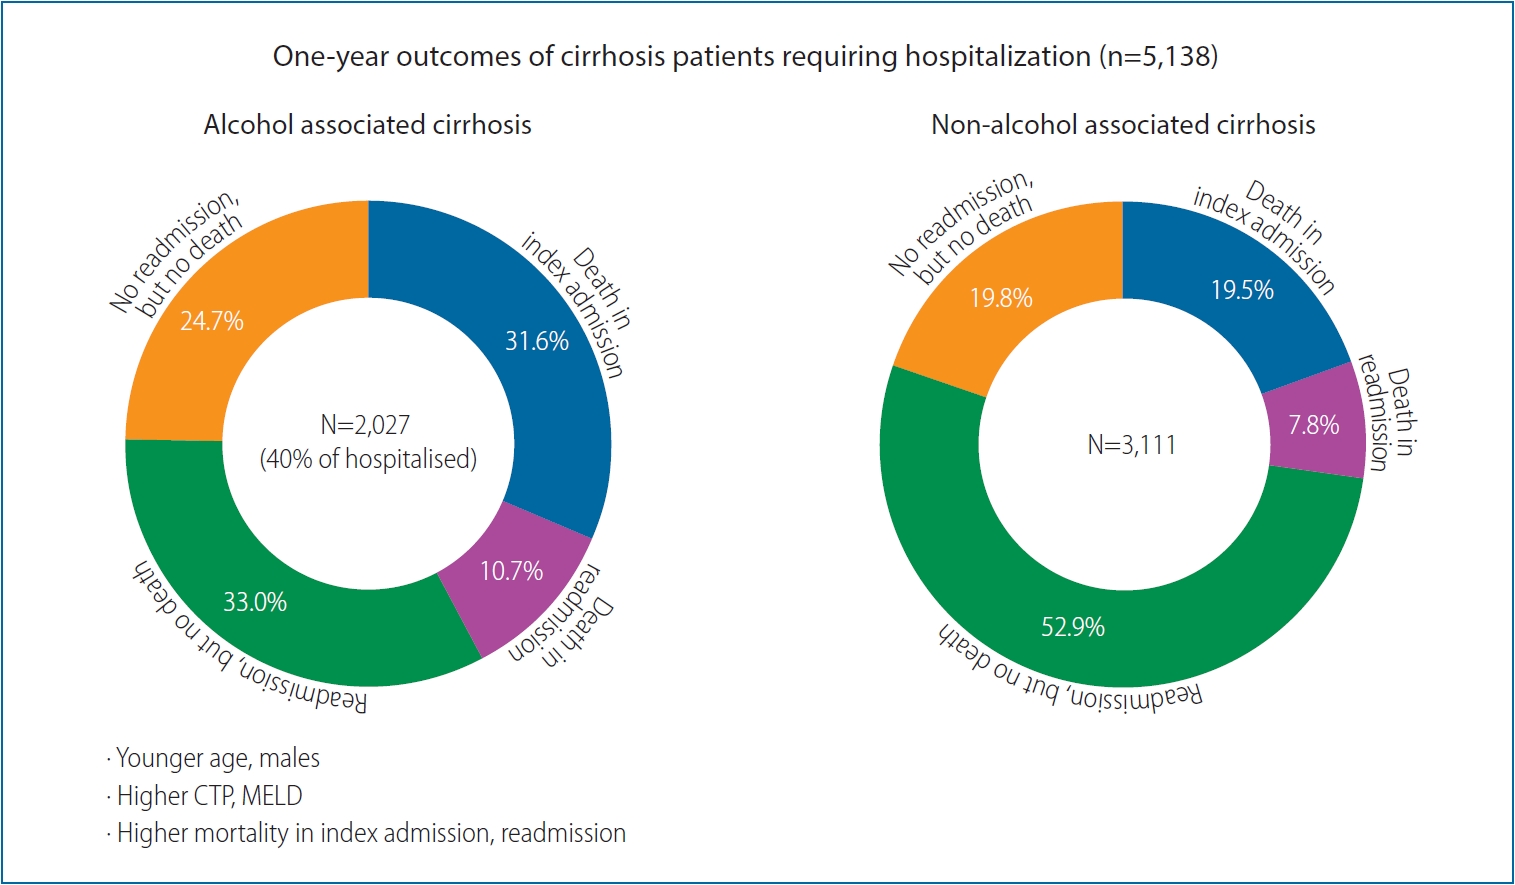
We divided etiologies of chronic liver diseases into two groups (Table 1); ALC (n=2,027; 39.5%) and non-ALC (n=3,111; 60.5%), the later included HBV, HCV, NASH, and cryptogenic etiology. The ALC group had male preponderance (97.7% vs. 67.7%, P<0.001) with greater proportion of patients between 40ŌĆō50 years (36.2% vs. 20.2%, P<0.001) compared to non-ALC group. Additionally, ALC had higher liver related complications at baseline than non-ALC group (sepsis: 20.3% vs. 14.9%, P<0.001; ascites: 82.2% vs. 65.9%, P<0.001; HRS: 12.8% vs. 7.6%, P<0.001; SBP: 21.8% vs. 15.7%, P<0.001; HE: 41.0% vs. 25.0%, P<0.001; AVB: 32.0% vs. 23.7%, P<0.001) and acute kidney injury (30.5% vs. 19.6%, P<0.001) along with greater disease severity CTP (10.6┬▒2.0 vs. 9.0┬▒2.3, P<0.001) and higher MELD (21.49┬▒8.47 vs. 16.85┬▒7.79, P<0.001). Higher proportion of ALC had decompensated liver disease at index admission (1,886 [93%] of the 2,027) compared to the non-ALC (2,469 [79.4%] of the 3,111; P<0.001). Additionally, the one year mortality was higher in ALC (42.3% vs. 27.3%, P<0.001) compared to non-ALC.
Patients in the ALC group had higher odds of being male (OR, 20.13; 95% confidence interval [CI], 14.9ŌĆō27.2; P<0.001), belonging to younger age group 40ŌĆō50 (OR, 4.04; 95%, CI, 3.39ŌĆō4.80; P<0.001), more liver related complications at index admission; ascites (OR, 2.39; 95% CI, 2.08ŌĆō2.74; P<0.001), AKI (OR, 2.09; 95% CI, 1.85ŌĆō2.35; P<0.001), HE (OR, 2.39; 95% CI, 2.08ŌĆō2.74; P<0.001). We found that prevalence of obesity (OR, 0.803; 95% CI, 0.67ŌĆō0.96; P=0.02) or DM (OR, 0.58; 95% CI, 0.52ŌĆō0.66; P=0.001) to be lower in ALC (Table 1).
MELD and CTP cut-offs as predictors of mortality
The MELD score of more than 19.0 at admission predicted one year mortality with a sensitivity of 72.5% and specificity 72.0%, and area under receiver operating curve (AUROC) of 0.79 (P<0.001). A CTP score of 10.5 or more had a sensitivity 67.4% and specificity of 77.0% in predicting one year mortality with an AUROC of 0.78 (P<0.001). Nearly 40.0% patients had a MELD score more than 19.0, and 36.9% had CTP score more than 10.5. Higher proportion of patients in the ALC had MELD >19 compared to non-ALC (53.2% vs. 29.5%, P<0.001). Similarly, CTP score of more than 10.5 was present in 50.6% of ALC patients compared to 26.8% of non-ALC patients (P<0.001).
IRR of 1 year mortality with respect to baseline characteristics at first admission in liver cirrhotics
By Poisson regression, IRR of each passing year was found to be associated with mortality (P<0.001) (Table 2). It was observed that the risk of mortality in 2017 had increased by 2.58 times (IRR, 2.58; 2.02ŌĆō3.28; P<0.001) compared to 2010. This increase in the IRR of mortality from 2010 to 2017, was due to an increase in the number of patients with more advanced liver disease over time with higher CTP (8.6┬▒2.2 in 2010 to 9.5┬▒2.3 in 2017, P<0.001) and MELD (15.6┬▒6.0 in 2010 to 18.4┬▒8.3 in 2017, P<0.001) with more number of liver related complications (greater prevalence of sepsis, HRS, HE, etc.) in the subsequent years.
Elderly patients (>60 years) and males had higher risk of mortality by 28% (IRR, 1.21; 1.10ŌĆō1.34, P<0.001) and 36% (IRR, 1.36; 1.20ŌĆō1.54, P<0.001) respectively compared to <40 year of age and females. The highest independent risk of mortality was seen with ALC group (IRR, 1.9; 1.71ŌĆō2.07, P<0.001), those with sepsis (IRR, 4.5; 4.07ŌĆō4.97, P<0.001) followed by those presenting with HE (IRR, 3.8; 3.45ŌĆō4.19; P<0.001), HRS (IRR, 2.58; 2.3ŌĆō2.9; P<0.001), ascites (IRR, 2.4; 2.1ŌĆō2.7; P<0.001), SBP (IRR, 1.92; 1.7ŌĆō2.1; P<0.001) and acute variceal bleeding (IRR, 1.30; 1.2ŌĆō1.5; P<0.001). However, lower relative risk (RR) of 1 year mortality (P<0.001) was observed in cirrhotics requiring admission for HCC.
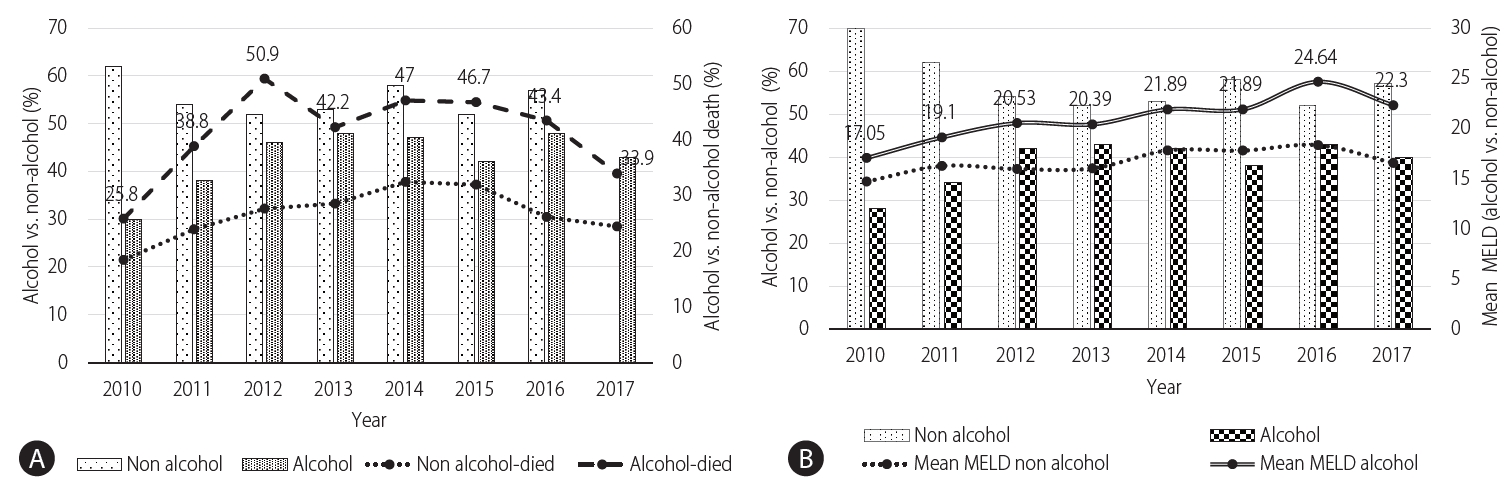
Trends in 1 year mortality in ALC and non-ALC patients over the years
The overall one year mortality in ALC cohort was 42.3% in comparison to 27.3% in the non-ALC cohort. The trend for one year mortality had an initial increase from 2010 to 2012 (25.8% to 50.9%, P<0.001) and then remained nearly uniform from 2013 to 2017 (around 42.6%) which correlates with the increase in the share of alcohol related cirrhotics from 2010ŌĆō2012 (30.3% to 46.3%, P<0.001) and then only marginally (46.3% to 42.6%, P=0.59) till 2017. Additionally, it was seen over the years that the liver disease severity as measured by mean MELD remained higher in the ALC compared to non-ALC group over the years along with higher 1 year mortality (Fig. 2).
Association of etiology with complications and readmissions
Out of 5,138 patients admitted for LC, 1,707 (33.2%) died within a year. Of them, 1,248 (24.3%) died in the first hospitalization itself. The remaining 459 patients (8.9%) died during the follow-up period of 1 year. More than half (59.5%; 2,316/3,890) of the patients surviving the first admission, required at least one readmission during the subsequent 1 year, with an additional mortality of 19.8% (459/2,316) in those requiring readmission. The remaining 1,574 (40.5%) of 3,890 patients, surviving the first admission, remained on regular follow-up visits without need for in-patient care (Table 3).
Half of the patients who died either in the first admission or in the first year of follow-up, had ALC, especially those with sepsis and other liver related complications (SBP, HE, and HRS) with higher liver disease severity (higher MELD and CTP scores), while those with HBV, HCV, and NASH related liver diseases and those with HCC had relatively better 1 year survival. Altogether, 112 (5.5%) of 2,027 alcoholic cirrhotic patients had alcohol relapse and most of them (109/112 [97.3%]) who relapsed, had decompensated liver disease and required readmission.
Association between survival and number of complications and etiologies
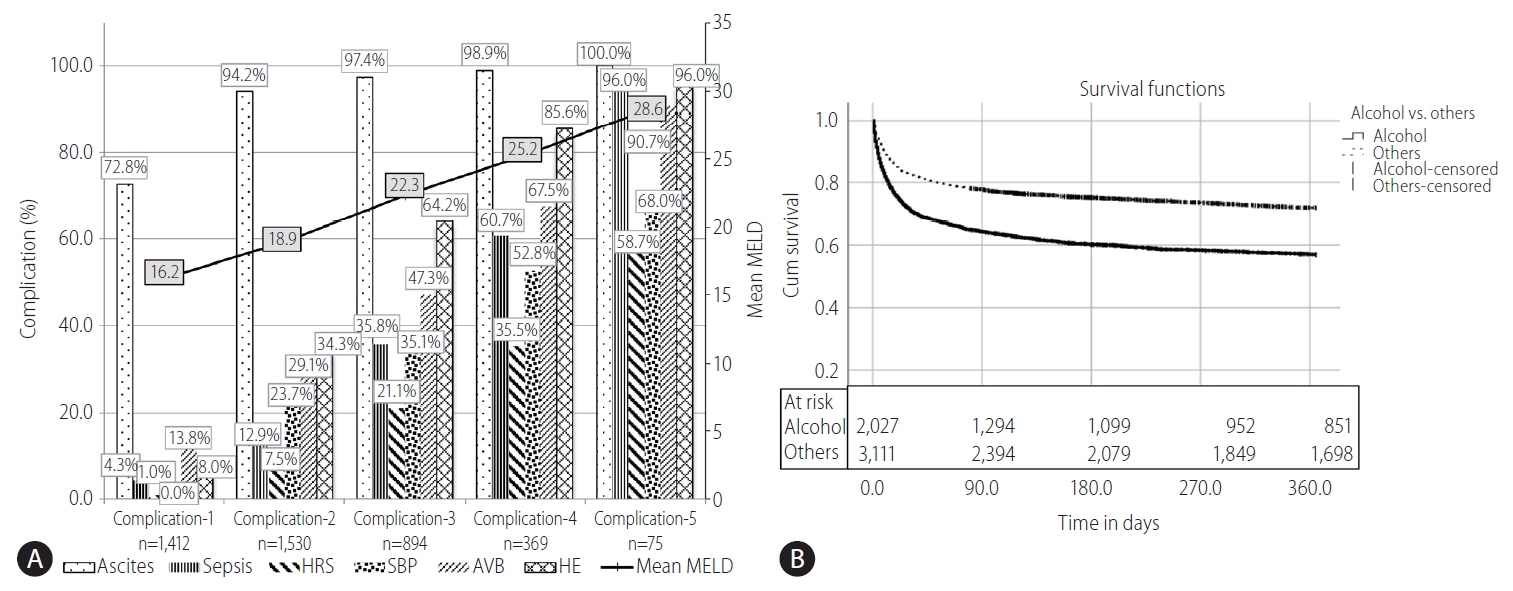
We determined the number of complications, at baseline and grouped them as; any one complication, any two complications, any three complication and so on as shown in Figure 3A. Out of total cases, 1,412 had only one complication, such as only ascites, sepsis, HRS, SBP, AVB, or HE. Total number of complications of more than or equal to five were merged for analysis due to smaller sample size in these groups. It was seen that as the number of complications increased, their corresponding mean MELD score also increased (Fig. 3A).
Cirrhotic patients with ascites, HE and a third complication (any of the sepsis, HRS, AVB, or SBP) at index admission (i.e., complication Ōēź3 vs. complication <3) are unlikely to have good 1 year survival (39.8% vs. 76.3%, P<0.001). Figure 3B depicts the 1 year follow-up survival with ALC compared to non-ALC. Kaplan-Meier curve has shown the probability of 1 year survival in ALC patients to be much lower than the non-ALC group (56.9% vs. 71.9%, P<0.05).
LC patients who required admission were less likely to survive 1 year if the liver disease was due to alcohol, the patient had a MELD of >20.9┬▒6.9 (P<0.001), CTP >10.3┬▒1.86 (P<0.001), if the patient had three or more liver related complications, especially with sepsis, HE or HRS at admission.
We matched MELD and CTP scores using Propensity Score matching, between ALC versus non-ALC groups to assess the etiology and disease severity independent risk on the outcomes. The nearest available matching (1:1) was used to construct the control group with a calliper width of 0.001 of the logit of the propensity score. After matching, a total of 2,282 patients, ALC (n=1,141) and non-ALC (n=1,141) were identified. In the matched cohort, there was no difference noted in the MELD and CTP scores (MELD: 19.4┬▒7.8 vs. 19.3┬▒7.7, P=0.70 and CTP: 9.89┬▒1.98 vs. 9.91┬▒2.02, P=0.75). ALC patients were more likely to be younger (OR, 3.75; 95% CI, 2.84ŌĆō4.95; P<0.001) and also with more chances of liver related complications: AVB (OR, 1.34; 95% CI, 1.12ŌĆō1.61; P=0.001), followed by, ascites (OR, 1.25; 95% CI, 1.01ŌĆō1.55; P=0.04), and HE (OR, 1.18; 95% CI, 1.0ŌĆō1.4; P=0.05) at index admission compared to the disease severity matched non-ALC group. ALC group also had higher readmission rate in the following year in comparison to non-ALC after CTP and MELD matching.
DISCUSSION
In this hospital based study in a large cohort of cirrhotics, we found that alcohol was the leading cause of LC, accounting for 39.4% of all admissions due to LC in the Indian population. ALC was more prevalent etiology in the younger male with 53.9% of cirrhotics below 50 years having alcohol as the etiology of cirrhosis. One-third of the whole cohort of hospitalized patients died within 1 year of follow-up, one-fourth in the first admission itself. Half of the patients who died in the first year of follow-up, had alcohol related liver disease, and were admitted with sepsis and/or other liver related complications. These data bring to the fore a major change in the etiological spectrum of patients with LC in this continent.
This change in the etiological spectrum of LC is quite similar to what is currently prevalent in the Western countries, Latin America and Europe [4,5,11]. Alcohol has been reported to be the second most common cause of LC after HCV infection in the United States, accounting for 20% to 25% of all patients with LC [20] and alcoholic liver disease (ALD) is also increasing in China [21]. In India, among all etiologies, alcohol is now the leading cause of cirrhosis in the adults [22-24]. This is quite in contrast to hepatitis B being the commonest cause of cirrhosis just about 3 decades ago [25] when hepatitis B constituted nearly 50% of all cirrhosis patients and alcohol, only about 15%.
In the current study, the commonest presenting complaints in patients with cirrhosis requiring hospitalization included ascites (72.3%), followed by HE (31.3%) and sepsis (17.1%). Similar findings have been reported in other studies [22,26-29].
Survival data in cirrhotics patients stratified by etiology is very heterogenous from different parts of the world. In our study, survival was the least (33.8%) in patients with alcoholic LC. Similar observations have been made by other workers [22]. According to World Health Organization, alcohol consumption is the main cause of liver-related death in Europe [1]. High mortality (63%) due to alcohol has been well documented in the cohorts of chronic liver disease patients [12]. Ratib et al. [30] have shown 20.2% of liver-related deaths to be due to alcoholic liver disease in England. The regional variations in the proportional mortality may be related to demographic differences in the prevalence of various etiologies, their risk factors and as well as genetic susceptibility.
In this study, the IRR for annual mortality was significantly higher in ALC with RR of 1.88. However, mortality among patients with cirrhosis due to HBV, HCV, autoimmune, cryptogenic or NASH etiology had not changed over time. The IRR increased with sepsis, followed by HE, SBP, ascites, AVB, HRS and was unchanged in patients with HCC. However, reports from the USA, show a decreased risk of mortality now in patients with HE and SBP [31], but an increase with HRS [32]. Similar observations have been made by Kim et al. [20] in the Korean cohorts, where mortality attributable to HE, SBP and AVB has significantly decreased, whereas that due to HRS significantly increased over time. But trends of changes in mortality in patients with LC according to etiology of liver disease is rarely reported.
Overall, 33.2% died (24.3% in first admission, 8.9% in the follow-up), 36.1% survived beyond a year despite repeat admissions and another 30.6% did well beyond a year without need for readmissions. In this study, the trend for mortality in ALD patients showed an initial increase from 2010 to 2012 (25.8% to 50.9%) due to sicker patients getting admitted with higher MELD score and then remained nearly uniform over the years from 2012ŌĆō2017.
Cirrhotic patients with ascites, HE and a third complication (any of the sepsis, HRS, AVB, or SBP) at index admission are unlikely to have good 1 year survival i.e., 39.8% and hence merit early referral to liver transplantation to improve their outcome. The data in the present study also reveals that as the number of complications at index admission increases, the corresponding MELD score also increases and the probability of 1 year survival declines. Liver cirrhotic patients who require admission due to alcohol etiology are also less likely to survive for a year, if at the time of admission, the patient has a MELD of >20.9┬▒6.9, CTP >10.3┬▒1.86, three or more liver related complications, especially sepsis, HE or HRS.
In summary, the results of the present study show the changing pattern of etiology of LC in the Indian subcontinent, alcohol being responsible for nearly 40% of the cirrhotic patients requiring admission with younger age, with higher disease complications at index admission even after matching cohort for MELD and CTP score. Alcohol as etiology of liver disease, number of liver related complications at the index admission in addition to the disease severity predict 1 year morbidity and mortality. Understanding the reasons for readmission could help in reducing morbidity and mortality and help the policy makers to plan strategies to intervene and reduce the impact of causative agents.
 PDF Links
 PubReader
 ePub Link
 Full text via DOI
 Full text via PMC
 Download Citation
 Print
Print