Clin Mol Hepatol > Volume 29(Suppl); 2023 > Article
Nogami, Yoneda, Iwaki, Kobayashi, Honda, Ogawa, Imajo, Saito, and Nakajima: Non-invasive imaging biomarkers for liver steatosis in non-alcoholic fatty liver disease: present and future

ABSTRACT

Non-alcoholic fatty liver disease is currently the most common chronic liver disease, affecting up to 25% of the global population. Simple fatty liver, in which fat is deposited in the liver without fibrosis, has been regarded as a benign disease in the past, but it is now known to be prognostic. In the future, more emphasis should be placed on the quantification of liver fat. Traditionally, fatty liver has been assessed by histological evaluation, which requires an invasive examination; however, technological innovations have made it possible to evaluate fatty liver by non-invasive imaging methods, such as ultrasonography, computed tomography, and magnetic resonance imaging. In addition, quantitative as well as qualitative measurements for the detection of fatty liver have become available. In this review, we summarize the currently used qualitative evaluations of fatty liver and discuss quantitative evaluations that are expected to further develop in the future.

INTRODUCTION

Metabolic syndrome has been attracting attention owing to increasing obesity, diabetes, hypertension, and lipid metabolism abnormalities resulting from the westernization of diet. The prevalence of metabolic syndrome is estimated to be 25% worldwide,¹ with similarly high and increasing rates reported from Japan² and South Korea³ in Asia. Fatty liver is known to be a frequent complication of metabolic syndrome. Fatty liver is collectively called non-alcoholic fatty liver (disease) (NAFL[D]), in which patients drink no or little alcohol (less than 30 g/day ethanol equivalent in men and less than 20 g/day in) but have a fatty liver.
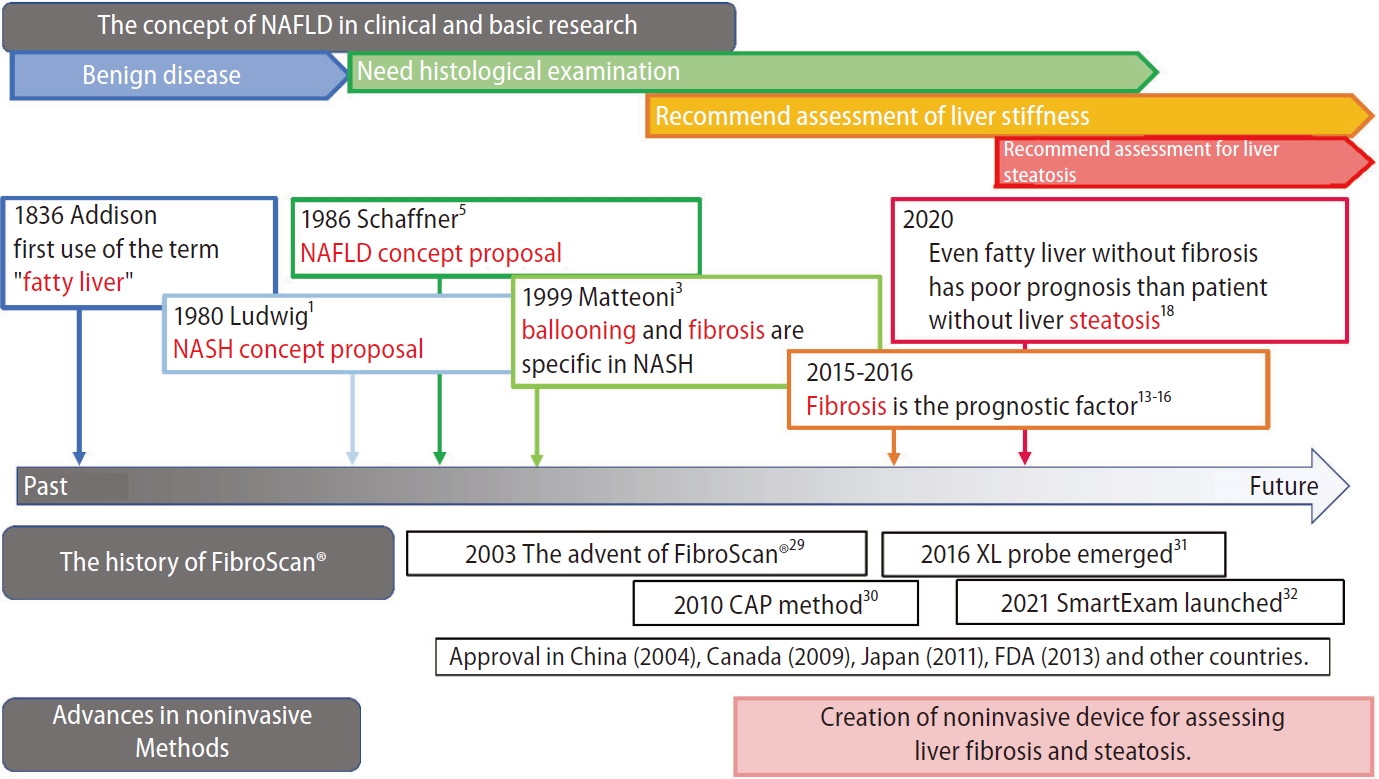
The term fatty liver was first described by Thomas Addison in the 1830s in Guy’s Hospital Reports in the UK. In 1980, Ludwig proposed non-alcoholic steatohepatitis (NASH) as a condition in which a person does not drink alcohol but presents with a histology similar to an alcoholic [4]. In 1986, Schaffner first used the term NAFLD to describe the concept of fatty liver disease [5]. Subsequently, Matteoni et al. [6] published the diagnostic criteria for NASH, based on the assumption that the findings correlating with prognosis among pathological findings of NAFLD are the characteristic findings of NASH.
NAFL often has a relatively benign course, but NASH comprises a group of advanced diseases that can lead to cirrhosis and hepatocarcinoma [7]. NASH accounts for approximately 10–20% of all NAFLD cases, and is pathologically distinguished by the presence of ballooning of hepatocytes and lobular inflammation as well as fat accumulation in more than 5% of the hepatocytes [8]. Moreover, NASH and NAFL are cross connectional conditions.
Although liver biopsy is considered the gold standard for the diagnosis of fatty liver, especially in NASH, it is not practical to perform liver biopsy in all patients due to its invasiveness, potential for sampling errors, and dependency on the pathologist [9]. As Kim [10] summarized, several studies have emerged showing the use of non-invasive biomarkers to reduce the invasiveness of liver biopsy. Recently, the diagnosis of NAFLD, especially liver steatosis, has been improved by magnetic resonance imaging-proton density fat fraction (MRI-PDFF) [11] and ultrasound-controlled attenuation parameter (CAP) [12], which are increasingly recognized as possible alternatives to liver biopsy.
The recommended treatment for NAFLD is weight loss and lifestyle and exercise modifications [13]. There is still no drug that fundamentally treats NAFLD. However, there are several reports of diabetes medications being effective [14].

DEFINITION OF FATTY LIVER DISEASE AND ITS PROGNOSTIC FACTORS

Fatty liver disease is a general term for diseases that cause liver damage due to the deposition of triglycerides in hepatocytes. NAFLD is defined based on a pure ethanol equivalent intake of less than 20 g/day in women and less than 30 g/day in men. Pathologically, liver steatosis was conventionally defined as the presence of liver fat content in more than 30% of the hepatocytes; but currently, NAFLD is defined as liver fat content in more than 5% of the hepatocytes [7,15-17].
Initially, the progression from NAFL to NASH was considered a prognostic factor of NAFLD [18]. However, it has been reported that liver fibrosis is the most important prognostic factor in NAFLD, independent of the degree of liver steatosis, intralobular inflammation, and ballooning degeneration of hepatocytes, which are the findings in NASH [19-22]. It was also found that liver fibrosis progresses both in NAFL and NASH, although at different rates [23]. Therefore, the importance of assessing the degree of fibrosis, rather than diagnosing NAFL or NASH or evaluating liver steatosis, for the diagnosis of NAFLD is now recognized [23].
Since there were no comprehensive reports on the prognostic significance of NAFLD regarding the degree of liver steatosis and intralobular inflammation, simple fatty liver (NAFLD without fibrosis) development in the liver was regarded as a benign disease before 2021. Therefore, the progressive accumulation of steatosis in the liver was not recognized to have morbid implications. However, in 2021, a large Swedish cohort study showed that simple fatty liver disease, compared to the general population without fatty liver disease, was associated with a 1.9, 1.1, 7, 16.8, and 1.3 times higher risk of mortality from extrahepatic cancer, cardiovascular diseases, cirrhosis, hepatocellular carcinoma, and other causes, respectively [24], which emphasizes the importance of appropriate evaluations of liver steatosis.
Qualitative evaluations of liver steatosis have been mainly performed by abdominal sonography, computed tomography (CT) scans, and magnetic resonance imaging (MRI), but with the advent of methods such as the CAP method by FibroScan® (Echosens, Paris, France) and MRI-PDFF, it is now possible to quantify liver steatosis.
The evolution of the disease concept and evaluation methods for NAFLD/NASH are summarized in Figure 1.

ABDOMEN ULTRASONOGRAPHY (QUALITATIVE ASSESSMENT)

Abdominal ultrasonography is simple and useful for the diagnosis of fatty liver. B-mode abdominal echo findings of fatty liver include bright liver [25], hepatorenal echo contrast [26], hepatosplenic echo contrast, vascular blurring and attenuation [27], all of which are used in daily clinical practice.
B-mode findings have been reported to have good sensitivity and specificity when more than 30% of the hepatocytes have intrahepatic steatosis [28-30]. However, sensitivity and specificity are reduced when intrahepatic steatosis is less than 30% [31,32], and no studies have found that B-mode findings can diagnose less than 5% liver steatosis.
Ultrasound is a popular and useful technique for detecting fatty liver. However, ultrasonography does not provide quantitative results, and it is unsuitable for determining increases or decreases in liver steatosis and the effectiveness of treatment. In addition, it cannot detect liver steatosis under 30%, its use varies largely among surgeons; and although it is useful in diagnosing fatty liver, false-positive or -negative cases may occur [33]. At the time when abdominal ultrasound was difficult to quantify fat, a scoring system was developed to predict whether a non-drinker had NAFLD, which had a high diagnostic performance with an area under receiver operating characteristic curve (AUROC) of 0.98 based on histological evaluation [34].

ABDOMEN ULTRASONOGRAPHY (QUANTITATIVE ASSESSMENT)

The amplitude of ultrasound is attenuated exponentially as it propagates through the body. This attenuation can be broadly classified into scattering and absorption, but most of the transmitted waves on the beam are due to absorption. The attenuation constant, which represents the magnitude of attenuation, can be expressed as α=a-f n (dB/cm) as a function of frequency f in case of living tissue (the value of n is almost always 1 in soft tissue). Instead of α, attenuation can be expressed as a proportionality constant a (dB/MHz/cm). This value varies depending on the tissue and lesion type. The fact that fatty liver exhibits more attenuation than normal liver has enabled the application of quantitative ultrasonography for liver steatosis.

CONTROLLED ATTENUATION PARAMETER (CAP)

FibroScan® (EchoSens, Paris, France), the pioneering instrument in vibration controlled transient elastography, was introduced in 2003 [35]. Initially, it could only measure liver stiffness, but in 2010, CAP was introduced to measure the degree of fat attenuation [36]. This was the first time that a device was able to quantify liver steatosis. Although the CAP method was considered non-invasive, rapid, inexpensive, and reproducible, it was less suitable for obese patients, in whom acquiring ultrasound signals was difficult with the available M probe. However, with the introduction of the XL probe for obese patients [37], shear waves are now able to penetrate deeper and generate signals in obese patients as well. The XL probe was also equipped with CAP, making it more useful for measurements in obese patients [38].
In 2021, EchoSens launched the new computation method SmartExam allowing for deeper measurements and an increased number of CAP measurements, which is expected to further improve the accuracy of CAP measurements in obese patients [39]. Owing to its recency, there are few reports on this method, but further studies are in progress. Recently, we presented the first clinical report on the SmartExame-quipped FibroScan [40]. In our study, we compared the SmartExam-equipped FibroScan and the conventional FibroScan with the results obtained with magnetic resonance imaging (MRE)/MRI-PDFF, and reported that both are capable of comparable evaluation. We also concluded that the SmartExame-quipped FibroScan significantly reduced CAP variability, but tended to take slightly longer to obtain measurements compared to the conventional FibroScan. One limitation of this paper was the small number of obese patients, and further studies in a population with a large number of obese patients was recommended.
A meta-analysis of the diagnostic performance of CAP based on histological evaluation by liver biopsy in NAFLD showed high AUROCs of 0.924, 0,784, and 0.778 for S ≥1, 2, and 3, respectively [41]. The usefulness of CAP is emphasized in various NAFLD guidelines, including the American Association for the study of Liver (AASLD) [8], European Association for the study of the liver (EASL) [42], the Korean Association for the Study of the liver (KASL) [43], and Japanese guidelines [16,17].
The advantage of CAP is that fatty liver quantification can be performed easily, quickly, and inexpensively with high diagnostic performance. However, the disadvantage is that the measurement results are affected by the distance to the liver surface making it necessary to change the probe to M or XL depending on advanced obesity and body size [38]. Different probes have different transmission frequencies; thus, resulting values cannot be simply compared. In addition, CAP measurements cannot be performed in cases of ascites or effusion, but some newer techniques have overcome such drawbacks.
Furthermore, it has been reported that liver stiffness measurements using FibroScan® are useful in assessing liver fibrosis in long-term follow-up [44,45]. However, it has not been reported whether the measurement of liver steatosis is also useful in long-term follow-up, and we hope that such studies are conducted in the future.

OTHER UPCOMING ULTRASOUND-BASED QUANTITATIVE EVALUATION METHODS

Since the advent of CAP, devices that measure attenuation coefficients simultaneously with B-mode images on conventional abdominal ultrasound systems have been developed and put into practical use, including UGAP (GE Healthcare, Wauwatosa, WI, USA), ATI (Canon Medical Systems, Tochigi, Japan), Attenuation Imaging (Fujifilm Healthcare, Tokyo, Japan) [46], ultrasound-derived fat fraction (UDFF) (Siemens Healthineers, Erlangen, Germany) [47-49], attenuation estimation algorithm (Hologic, Bedford, MA, USA), tissue-attenuation imaging (Samsung Medison, Seoul, Korea), and Philips attenuation (Philips Medical Systems, Amsterdam, The Netherlands).

ATTENUATION IMAGING (ATI)

ATI can also measure liver fat content without changing the probe. The principle of ATI is that it can avoid multiple reflections from a close range, which has been a disadvantage in diagnosis. It also eliminates the focal point dependence of the transmitted sound field characteristics, deep attenuation, and large vessels, which are dependent on the probe and affect the measured value, and it can automatically calculate and quantitatively evaluate the attenuation due to the properties of biological tissue in any part of the body. In addition, it is possible to automatically calculate and quantitatively evaluate the attenuation rate caused by the characteristics of the biological tissue in any part of the body. ATI has been reported to have as high diagnostic performance as MRI-PDFF in terms of liver fat quantification compared to MRI-PDFF [50-61]. It is reported that ATI has good correlation with CAP (r=0.65, P<0.0001) and the AUROC for detecting S >0 steatosis and S >1 steatosis was 0.91 and 0.88, respectively [52]. Tada et al. [50] also reported that ATI-induced attenuation coefficient values are not affected by liver stiffness.
As for ATI, it has only been studied on a small scale and is expected to be studied on a larger scale in the future. The advantage of ATI is that it has a high diagnostic performance and, unlike CAP, can be measured in the presence of ascites. It is also advantageous that the same machine can perform measurements while observing in B-mode. On the other hand, ATI is less commonly reported and less widely used than CAP.

ULTRASOUND-GUIDED ATTENUATION PARAMETER (UGAP)

UGAP is a fat quantification method based on measuring the attenuation coefficient (dB/cm/MHz) of the ultrasound signal in the common B mode. It was first reported in 2018 by Fujiwara et al. [62], and was shown to be comparable in terms of AUROC to CAP and MRI-PDFF, the latter being considered an alternative to liver biopsy for the evaluation of liver steatosis with comparable diagnostic performance, as shown in a multicenter study [63]. In this study, the AUROCs of UGAP for distinguishing steatosis grade ≥1 (MRI-PDFF ≥5.2%), ≥2 (MRI-PDFF ≥11.3%), and 3 (MRI-PDFF ≥17.1%) were 0.910 (95% confidence interval [95% CI], 0.891–0.928), 0.912 (95% CI, 0.894–0.929), and 0.894 (95% CI, 0.873–0.916), respectively, showing an excellent diagnostic accuracy for grading steatosis with reference to MRI-PDFF. The advantages and disadvantages of UGAP are similar to those of ATI. There have been a few reports, but further evaluations are expected.
Several new ultrasound techniques for measuring liver steatosis from various companies, including improved version of the attenuation coefficient (iATT) and UDFF, have been introduced, but they are still lacking evidence.
Table 1 summarizes the modalities and standard references for liver steatosis reported to date, and Table 2 summarizes the AUROCs of non-invasive imaging modalities.

STEATOSIS QUANTIFICATION AND QUALIFICATION USING CT

A comparison of CT values of the liver and spleen (liver/spleen ratio: L/S ratio) [64,65] is useful for the early detection of fatty liver. When the CT values of the liver are lower than those of the spleen due to increased fat accumulation in the liver, a fatty liver can be diagnosed. However, CT scans are costly and time-consuming; thus, a rapid and more readily available means of assessing NAFLD in routine clinical care is needed [66]. Unlike ultrasound and MRI, CT is now used less frequently due to exposure issues, its low quantitative nature, and its relatively poor performance in detecting mild steatosis and quantifying steatosis [67-69].
Dual energy CT is a quantitative imaging method that uses two different X-ray tube voltages to estimate the composition of an imaging target using a material decomposition method that utilizes material-specific X-ray absorption characteristics.
Since the 1990s, reports on liver fat evaluation using dual energy CT have been published [70,71]. Using MRI-PDFF >6% as a reference diagnosis of fatty obesity, the diagnostic performance of fatty liver using dual energy CT was reported with an AUROC of 0.834. Optimal thresholds were 54.8 hounsfield unit (HU) (right) and 52.5 HU (left), with sensitivities/specificities of 57%/93.9% (right) and 67.9%/90% (left). For the hepatosplenic weight loss difference, the AUROCs were 0.808 (right) and 0.767 (left), with optimal sensitivities/specificities of 93.3%/57.1% (right) and 78.6%/68% (left) [72].
It has been suggested that positron emission tomographycomputed tomography may be used in the future. Liver steatosis in NAFLD patients is independently associated with elevated liver enzymes, increased visceral adipose tissue volume, and decreased myocardial fluorodeoxyglucose-positron emission (FDG) uptake, but not with hepatic FDG uptake [73]. These properties could allow the clinical use of positron emission tomography—computed tomography for liver fat mass quantification in the future.

STEATOSIS QUANTIFICATION USING MRI

MRI signals are obtained from protons belonging to water and fat molecules, making it a good method for quantifying fat in the liver.
Proton magnetic resonance spectroscopy has been shown to be a safe and non-invasive method of quantifying liver fat content that correlates well with liver biopsy [74-78], and can detect fat depositions as little as 2% [79]. However, it has not been widely adopted in general clinical practice, partly, due to specific software requirements [80].
Subsequently, MRI-PDFF was introduced, which is a technique that allows the assessment of the amount of fat in the entire liver or in arbitrary regions of interest, even in small amounts [81,82]. Recently, studies have used MRI-PDFF instead of liver biopsy as a reference standard [50-60,63,78-83]. It has been reported that MRI-PDFF measurements correlate strongly with histological liver fattening [84,85]. In a comparison of pathological findings, the AUROC had an extremely high diagnostic accuracy of 0.99 for predicting hepatic steatosis by MRI-PDFF, which was much higher than that of CAP (AUROC 0.85) [86].
The AASLD [8], KASL [43], and Japanese guidelines [16,17] also emphasize the usefulness of MRI-PDFF. In addition to quantifying liver steatosis in clinical practice, recent clinical trials on NAFLD have examined histological evaluation, MRI-PDFF, and CAP reduction rates to investigate whether liver steatosis improves before and after investigational drug treatment [87]. According to a recent review on quantitative liver steatosis assessment, MRI-PDFF should be used as a non-invasive reference standard in diagnostic studies [46].

APPLICATION OF ARTIFICIAL INTELLIGENCE IN THE MEASUREMENT OF LIVER STEATOSIS

In recent years, artificial intelligence (AI) has been utilized in many fields. AI software tries to reproduce human logical thinking on a computer. With the development of deep learning technology, AI can autonomously learn and construct decision criteria from given data. The fields of pathology and imaging evaluation have a high affinity to AI which has enabled remarkable technological developments for clinical applications.
The advantages of AI are that it continuously provides stable results as it does not suffer from the exhaustion that occurs in humans, and that it prevents inter- and intra-observer variability. It has been reported that AI technology minimizes inter-observer variability in histological assessments [88,89]. Among other things, AI technology has the potential for the objective assessment of ballooning, which is a hallmark in the evaluation of NAFLD steatosis [90].
Reports have also been published on AI-assisted ultrasound and MRI, which are expected to be useful in clinical practice. A meta-analysis on liver steatosis using AI technology was published by Decharatanachart et al. [91]. They summarized 19 previous studies that assessed fibrosis and steatosis of the liver using AI-based ultrasound, elastography, CT, MRI, and clinical parameters. According to the pooled data, the sensitivity, specificity, positive predictive value, negative predictive value, and diagnostic odds ratio (DOR) for the diagnosis of liver steatosis were 0.97 (0.76–1.00), 0.91 (0.78–0.97), 0.95 (0.87–0.98), 0.93 (0.80–0.98), and 191.52 (38.82–944.81), respectively. AI technology is expected to be used in clinical practice in the future.

New concept, metabolic associated fatty liver disease (MAFLD)

It is known that fatty liver can occur whether one drinks alcohol or not; and since it is often complicated by lifestyle-related diseases, it has been proposed that fatty liver should be considered a MAFLD going forward, and not NAFLD [92,93].

CONCLUSIONS

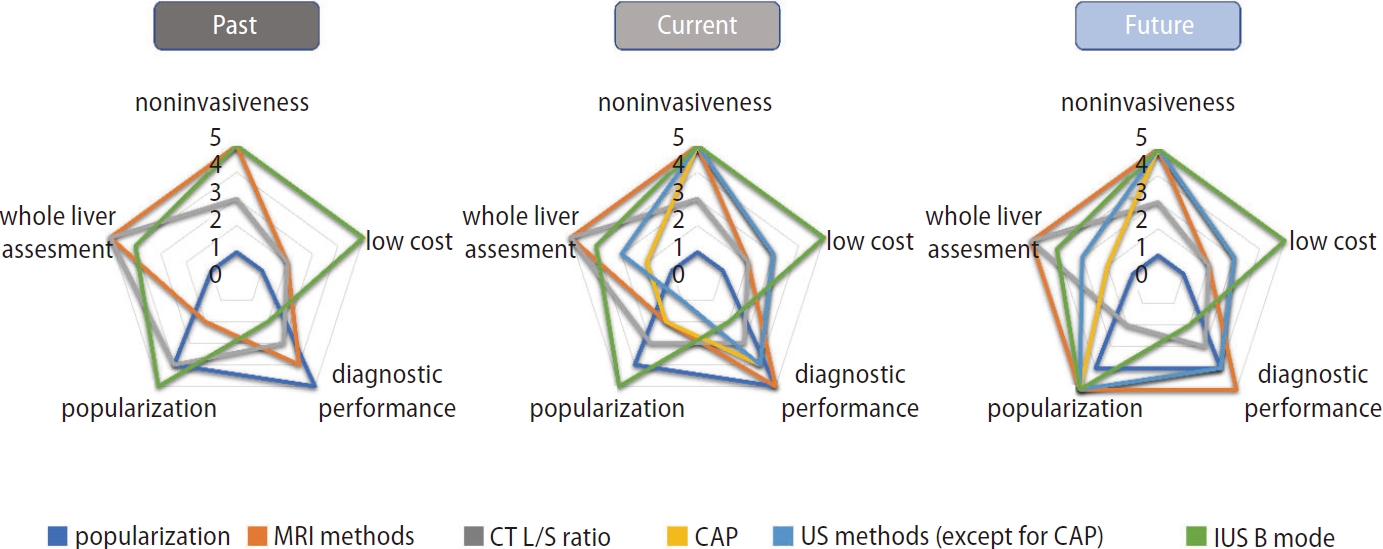
Fat content in NAFLD is nowadays evaluated quantitatively as well as qualitatively. Although histological evaluation remains the gold standard for liver steatosis measurement, it is likely to be replaced by MRI-PDFF in the future. Once additional evidence on the usefulness of fat determination by ultrasound using novel technology becomes available, liver fat content could potentially be measured easier than ever before in general clinical practice. Several methods have emerged to quantify liver steatosis, but each test has its own advantages and disadvantages in terms of diagnostic performance, cost, and invasiveness (Fig. 2).
Various liver steatosis measurement techniques are now available. However, the coherence between these techniques remains unclear. Further evidence and additional clinical studies are required.

FOOTNOTES

Authors’ contribution
AN wrote the manuscript and prepared the figures and tables. MY and AN revised the manuscript. All the authors read and approved the final version.
Conflicts of Interest
The authors have no conflicts to disclose.

Figure 1.
Landmark studies and advances of non-invasive methods in the assessment of NAFLD. NAFLD, non-alcoholic fatty liver disease; NASH, non-alcoholic steatohepatitis; CAP, controlled attenuation parameter; FDA, food and drug administration.

cmh-2022-0357f1.jpg
Figure 2.
Characteristics of examinations to evaluate liver steatosis in the past, present, and future. MRI, magnetic resonance imaging; CT, computed tomography; CAP, controlled attenuation parameter; US, ultrasound; L/S ratio, liver-to-spleen ratio.

cmh-2022-0357f2.jpg
Table 1.
Standard reference and US techniques in the analysis of liver steatosis
US techniques Company, Country Liver biopsy MRI-PDFF CAP
Controlled attenuation parameter (CAP) Echosens, Paris, France -
Attenuation imaging (ATI) Canon Medical Systems, Tochigi, Japan
Attenuation measurement (ATT) Fujifilm Health Care, Tokyo, Japan ×
US-guided attenuation parameter (UGAP) General Electric, Schenectady, NY, USA
US-derived fat fraction (UDFF) Siemens Healthineers, Erlangen, Germany × ×
Attenuation estimation Hologic, Bedford, MA, USA × × ×
Tissue-attenuation imaging (TAI) Samsung Medison, Seoul, Korea × × ×
Attenuation imaging Philips Medical Systems, Amsterdam, the Netherlands × × ×

US, ultrasound; MRI-PDFF, magnetic resonance imaging-proton density fat fraction.

Table 2.
AUCs of non-invasive imaging modalities
Study Study population Patient Imaging Golden AUROC
S≥1 S≥2 S=3
Nogami et al. [40] CLD 167 CAP MRI-PDFF 0.90 (0.83–0.94) 0.85 (0.78–0.90) 0.85 (0.89–0.90)
CAPc 0.85 (0.77–0.90) 0.84 (0.76–0.89) 0.83 (0.75–0.89)
NAFLD 97 CAP 0.83 0.77 0.78
CAPc 0.84 0.77 0.78
Tada et al. [50] nonBnonC 119 ATI MRI-PDFF 0,81 (0.73–0.89) 0.87 (0.79–0.96) 0.94 (0.89–0.98)
Hsu et al. [51] CLD 28 ATI Liver biopsy 0.97 (0.83–1.00) 0.99 (0.86–1.00) 0.97 (0.82–1.00)
Ferraiolo et al. [52] Consecutive adult subjects potentially at risk of steatosis and healthy controls 129 ATI MRI-PDFF 0.91 (0.84–0.95) 0.95 (0.89–0.98)
CAP MRI-PDFF 0.85 (0.77–0.91) 0.88 (0.81–0.93)
Jeon et al. [53] CLD 87 ATI MRI-PDFF 0.76 (0.66–0.85) 0.88 (0.79–0.94)
Bae et al. [54] CLD 108 ATI Liver biopsy 0.843 (0.761–0.906) 0.876 (0.799–0.931) 0.886 (0.811–0.949)
Dioguardi Burgio et al. [55] CLD 101 ATI Liver biopsy 0.805 (0.811–0.88) 0.892 (0.81–0.94)
Lee et al. [56] NAFLD suspected 108 ATI Liver biopsy 0.93 (0.86–0.97) 0.88 (0.80–0.93) 0.83 (0.73–0.89)
Sugimoto et al. [57] NAFLD suspected 120 ATI Liver biopsy 0.88 (0.80–0.97) 0.86 (0.79–0.93) 0.79 (0.68–0.89)
Ferraioli et al. [58] Patients with steatosis 72 ATI-Pen MRI-PDFF 0.90 (0.81–0.96)
ATI-Gen 0.92 (0.82–0.96)
CAP 0.85 (0.74–0.92)
Tada et al. [59] Patients with steatosis 148 ATI Liver biopsy 0.85 (0.72–0.88) 0.91 (0.84–0.97) 0.91 (0.82–0.99)
Obese 41 ATI 0.72 (0.54–0.90) 0.72 (0.55–0.90) 0.78 (0.55–1.00)
NAFLD 38 ATI 0.77 (0.61–0.94) 0.88 (0.77–0.99) 0.86 (0.69–1.00)
Kwon et al. [60] Liver disease 100 ATI MRI-PDFF 0.914 (0.858–0.969) 0.935 (0.886–0.985)
Fujiwara et al. [62] CLD 163 UGAP Liver biopsy 0.900 (0.834–0.967) 0.953 (0.894–0.993) 0.959 (0.920–0.999)
CAP 0.829 (0.743–0.914) 0.841 (0.728–0.953) 0.817 (0.703–0.932)
Imajo et al. [63] CLD 1,010 UGAP MRI-PDFF 0.910 (0.891–0.928) 0.912 (0.894–0.929) 0.894 (0.873–0.916)

Values are presented in 95% confidence interval.

AUROC, area under receiver operating characteristic curve; CLD, chronic liver disease; NAFLD, non-alcoholic fatty liver disease; nonBnonC, non hepatitis B non hepatitis C; CAP, controlled attenuation parameter; CAPc, continuous Controlled Attenuation Parameter; ATI, attenuation imaging; ATI-Pen, attenuation imaging–penetration; UGAP, ultrasound-guided attenuation parameter; MRI-PDFF, magnetic resonance imaging-proton density fat fraction.

Abbreviations

AASLD
American Association for the study of Liver
AI
artificial intelligence
AUROC
area under receiver operating characteristic curve
ATI
attenuation imaging
CAP
controlled attenuation parameter
CLD
chronic liver disease
CT
computed tomography
EASL
European Association for the study of the liver
KASL
Korean Associatoin for the Study of the liver
MRI
magnetic resonance imaging
MRI-PDFF
magnetic resonance imaging-proton density fat fraction
NAFL
non-alcoholic fatty liver
NAFLD
non-alcoholic fatty liver disease
NASH
non-alcoholic steatohepatitis
UGAP
ultrasound-guided attenuation parameter

REFERENCES

1. Younossi ZM, Koenig AB, Abdelatif D, Fazel Y, Henry L, Wymer M. Global epidemiology of nonalcoholic fatty liver disease-metaanalytic assessment of prevalence, incidence, and outcomes. Hepatology 2016;64:73-84.
crossref pmid
2. Ito T, Ishigami M, Zou B, Tanaka T, Takahashi H, Kurosaki M, et al. The epidemiology of NAFLD and lean NAFLD in Japan: a metaanalysis with individual and forecasting analysis, 1995-2040. Hepatol Int 2021;15:366-379.
crossref pmid pdf
3. Park SH, Plank LD, Suk KT, Park YE, Lee J, Choi JH, et al. Trends in the prevalence of chronic liver disease in the Korean adult population, 1998-2017. Clin Mol Hepatol 2020;26:209-215.
crossref pmid pmc pdf
4. Ludwig J, Viggiano TR, McGill DB, Oh BJ. Nonalcoholic steatohepatitis: Mayo Clinic experiences with a hitherto unnamed disease. Mayo Clin Proc 1980;55:434-438.
pmid
5. Schaffner F, Thaler H. Nonalcoholic fatty liver disease. Prog Liver Dis 1986;8:283-298.
pmid
6. Matteoni CA, Younossi ZM, Gramlich T, Boparai N, Liu YC, McCullough AJ. Nonalcoholic fatty liver disease: a spectrum of clinical and pathological severity. Gastroenterology 1999;116:1413-1419.
crossref pmid
7. Chalasani N, Younossi Z, Lavine JE, Charlton M, Cusi K, Rinella M, et al. The diagnosis and management of nonalcoholic fatty liver disease: practice guidance from the American Association for the Study of Liver Diseases. Hepatology 2018;67:328-357.
crossref pmid pdf
8. Bedossa P. Pathology of non-alcoholic fatty liver disease. Liver Int 2017;37 Suppl 1:85-89.
crossref pmid pdf
9. Rockey DC, Caldwell SH, Goodman ZD, Nelson RC, Smith AD. Liver biopsy. Hepatology 2009;49:1017-1044.
crossref pmid
10. Kim HY. Recent advances in nonalcoholic fatty liver disease metabolomics. Clin Mol Hepatol 2021;27:553-559.
crossref pmid pmc pdf
11. Caussy C, Reeder SB, Sirlin CB, Loomba R. Noninvasive, quantitative assessment of liver fat by MRI-PDFF as an endpoint in NASH trials. Hepatology 2018;68:763-772.
crossref pmid pmc pdf
12. de Lédinghen V, Wong GL, Vergniol J, Chan HL, Hiriart JB, Chan AW, et al. Controlled attenuation parameter for the diagnosis of steatosis in non-alcoholic fatty liver disease. J Gastroenterol Hepatol 2016;31:848-855.
crossref pmid pdf
13. Hydes TJ, Ravi S, Loomba R, Gray ME. Evidence-based clinical advice for nutrition and dietary weight loss strategies for the management of NAFLD and NASH. Clin Mol Hepatol 2020;26:383-400.
crossref pmid pmc pdf
14. Kim KS, Lee BW. Beneficial effect of anti-diabetic drugs for nonalcoholic fatty liver disease. Clin Mol Hepatol 2020;26:430-443.
crossref pmid pmc pdf
15. Kleiner DE, Brunt EM, Van Natta M, Behling C, Contos MJ, Cummings OW, et al. Design and validation of a histological scoring system for nonalcoholic fatty liver disease. Hepatology 2005;41:1313-1321.
crossref pmid
16. Tokushige K, Ikejima K, Ono M, Eguchi Y, Kamada Y, Itoh Y, et al. Evidence-based clinical practice guidelines for nonalcoholic fatty liver disease/nonalcoholic steatohepatitis 2020. J Gastroenterol 2021;56:951-963.
crossref pmid pmc pdf
17. Tokushige K, Ikejima K, Ono M, Eguchi Y, Kamada Y, Itoh Y, et al. Evidence-based clinical practice guidelines for nonalcoholic fatty liver disease/nonalcoholic steatohepatitis 2020. Hepatol Res 2021;51:1013-1025.
crossref pmid pdf
18. Rafiq N, Bai C, Fang Y, Srishord M, McCullough A, Gramlich T, et al. Long-term follow-up of patients with nonalcoholic fatty liver. Clin Gastroenterol Hepatol 2009;7:234-238.
crossref pmid
19. Angulo P, Kleiner DE, Dam-Larsen S, Adams LA, Bjornsson ES, Charatcharoenwitthaya P, et al. Liver fibrosis, but no other histologic features, is associated with long-term outcomes of patients with nonalcoholic fatty liver disease. Gastroenterology 2015;149:389-397.e10.
crossref pmid pmc
20. Loomba R, Chalasani N. The hierarchical model of NAFLD: prognostic significance of histologic features in NASH. Gastroenterology 2015;149:278-281.
crossref pmid
21. Dulai PS, Singh S, Patel J, Soni M, Prokop LJ, Younossi Z, et al. Increased risk of mortality by fibrosis stage in nonalcoholic fatty liver disease: systematic review and meta-analysis. Hepatology 2017;65:1557-1565.
crossref pmid pmc pdf
22. Hagström H, Nasr P, Ekstedt M, Hammar U, Stål P, Hultcrantz R, et al. Fibrosis stage but not NASH predicts mortality and time to development of severe liver disease in biopsy-proven NAFLD. J Hepatol 2017;67:1265-1273.
crossref pmid
23. Singh S, Allen AM, Wang Z, Prokop LJ, Murad MH, Loomba R. Fibrosis progression in nonalcoholic fatty liver vs nonalcoholic steatohepatitis: a systematic review and meta-analysis of paired-biopsy studies. Clin Gastroenterol Hepatol 2015;13:643-654.e1-e9 quiz e39-e40.
crossref pmid pmc
24. Simon TG, Roelstraete B, Khalili H, Hagström H, Ludvigsson JF. Mortality in biopsy-confirmed nonalcoholic fatty liver disease: results from a nationwide cohort. Gut 2021;70:1375-1382.
crossref pmid pmc
25. Joseph AE, Dewbury KC, McGuire PG. Ultrasound in the detection of chronic liver disease (the “bright liver”). Br J Radiol 1979;52:184-188.
crossref pmid
26. Yajima Y, Ohta K, Narui T, Abe R, Suzuki H, Ohtsuki M. Ultrasonographical diagnosis of fatty liver: significance of the liver-kidney contrast. Tohoku J Exp Med 1983;139:43-50.
crossref pmid
27. Saadeh S, Younossi ZM, Remer EM, Gramlich T, Ong JP, Hurley M, et al. The utility of radiological imaging in nonalcoholic fatty liver disease. Gastroenterology 2002;123:745-750.
crossref pmid
28. Hernaez R, Lazo M, Bonekamp S, Kamel I, Brancati FL, Guallar E, et al. Diagnostic accuracy and reliability of ultrasonography for the detection of fatty liver: a meta-analysis. Hepatology 2011;54:1082-1090.
crossref pmid pmc
29. Lewis JR, Mohanty SR. Nonalcoholic fatty liver disease: a review and update. Dig Dis Sci 2010;55:560-578.
crossref pmid pdf
30. Dasarathy S, Dasarathy J, Khiyami A, Joseph R, Lopez R, McCullough AJ. Validity of real time ultrasound in the diagnosis of hepatic steatosis: a prospective study. J Hepatol 2009;51:1061-1067.
crossref pmid pmc
31. Wieckowska A, Feldstein AE. Diagnosis of nonalcoholic fatty liver disease: invasive versus noninvasive. Semin Liver Dis 2008;28:386-395.
crossref pmid
32. Bohte AE, van Werven JR, Bipat S, Stoker J. The diagnostic accuracy of US, CT, MRI and 1H-MRS for the evaluation of hepatic steatosis compared with liver biopsy: a meta-analysis. Eur Radiol 2011;21:87-97.
crossref pmid pmc
33. Kondo R, Kusano H, Mihara Y, Kage M, Akiba J, Yano H. Pathological findings of liver steatosis that is difficult to evaluate with ultrasound. J Med Ultrason (2001) 2021;48:515-522.
crossref pmid pdf
34. Hamaguchi M, Kojima T, Itoh Y, Harano Y, Fujii K, Nakajima T, et al. The severity of ultrasonographic findings in nonalcoholic fatty liver disease reflects the metabolic syndrome and visceral fat accumulation. Am J Gastroenterol 2007;102:2708-2715.
crossref pmid
35. Sandrin L, Fourquet B, Hasquenoph JM, Yon S, Fournier C, Mal F, et al. Transient elastography: a new noninvasive method for assessment of hepatic fibrosis. Ultrasound Med Biol 2003;29:1705-1713.
crossref pmid
36. Sasso M, Beaugrand M, de Ledinghen V, Douvin C, Marcellin P, Poupon R, et al. Controlled attenuation parameter (CAP): a novel VCTE™ guided ultrasonic attenuation measurement for the evaluation of hepatic steatosis: preliminary study and validation in a cohort of patients with chronic liver disease from various causes. Ultrasound Med Biol 2010;36:1825-1835.
crossref pmid
37. de Lédinghen V, Vergniol J, Foucher J, El-Hajbi F, Merrouche W, Rigalleau V. Feasibility of liver transient elastography with FibroScan using a new probe for obese patients. Liver Int 2010;30:1043-1048.
crossref pmid
38. Sasso M, Audière S, Kemgang A, Gaouar F, Corpechot C, Chazouillères O, et al. Liver steatosis assessed by controlled attenuation parameter (CAP) measured with the XL probe of the FibroScan: a pilot study assessing diagnostic accuracy. Ultrasound Med Biol 2016;42:92-103.
crossref pmid
39. Audière S, Labourdette A, Miette V, Fournier C, Ternifi R, Boussida S, et al. Improved ultrasound attenuation measurement method for the non-invasive evaluation of hepatic steatosis using FibroScan. Ultrasound Med Biol 2021;47:3181-3195.
crossref pmid
40. Nogami A, Iwaki M, Kobayashi T, Honda Y, Ogawa Y, Imajo YT, et al. Real-world assessment of SmartExam, a novel FibroScan computational method: a retrospective single-center cohort study. J Gastroenterol Hepatol 2022 Nov 27;doi: https://doi.org/10.1111/jgh.16076.
crossref pmid
41. Cao YT, Xiang LL, Qi F, Zhang YJ, Chen Y, Zhou XQ. Accuracy of controlled attenuation parameter (CAP) and liver stiffness measurement (LSM) for assessing steatosis and fibrosis in nonalcoholic fatty liver disease: a systematic review and metaanalysis. EClinicalMedicine 2022;51:101547.
crossref pmid pmc
42. European Association for the Study of the Liver (EASL); European Association for the Study of Diabetes (EASD); European Association for the Study of Obesity (EASO). EASL-EASD-EASO Clinical Practice Guidelines for the management of non-alcoholic fatty liver disease. J Hepatol 2016;64:1388-1402.
crossref pmid
43. Kang SH, Lee HW, Yoo JJ, Cho Y, Kim SU, Lee TH, et al. KASL clinical practice guidelines: management of nonalcoholic fatty liver disease. Clin Mol Hepatol 2021;27:363-401.
crossref pmid pmc pdf
44. Suzuki K, Yoneda M, Imajo K, Kirikoshi H, Nakajima A, Maeda S, et al. Transient elastography for monitoring the fibrosis of nonalcoholic fatty liver disease for 4 years. Hepatol Res 2013;43:979-983.
crossref pmid
45. Nogami A, Yoneda M, Kobayashi T, Kessoku T, Honda Y, Ogawa Y, et al. Assessment of 10-year changes in liver stiffness using vibration-controlled transient elastography in non-alcoholic fatty liver disease. Hepatol Res 2019;49:872-880.
crossref pmid pdf
46. Ferraioli G, Raimondi A, Maiocchi L, De Silvestri A, Filice C. Quantification of liver fat content with the iATT algorithm: correlation with controlled attenuation parameter. Diagnostics (Basel) 2022;12:1787.
crossref pmid pmc
47. Labyed Y, Milkowski A. Novel method for ultrasound-derived fat fraction using an integrated phantom. J Ultrasound Med 2020;39:2427-2438.
crossref pmid pdf
48. Gao J, Wong C, Maar M, Park D. Reliability of performing ultrasound derived SWE and fat fraction in adult livers. Clin Imaging 2021;80:424-429.
crossref pmid
49. Dillman JR, Thapaliya S, Tkach JA, Trout AT. Quantification of hepatic steatosis by ultrasound: prospective comparison with MRI proton density fat fraction as reference standard. AJR Am J Roentgenol 2022;219:784-791.
crossref pmid
50. Tada T, Kumada T, Toyoda H, Nakamura S, Shibata Y, Yasuda S, et al. Attenuation imaging based on ultrasound technology for assessment of hepatic steatosis: a comparison with magnetic resonance imaging-determined proton density fat fraction. Hepatol Res 2020;50:1319-1327.
crossref pmid pdf
51. Hsu PK, Wu LS, Yen HH, Huang HP, Chen YY, Su PY, et al. Attenuation imaging with ultrasound as a novel evaluation method for liver steatosis. J Clin Med 2021;10:965.
crossref pmid pmc
52. Ferraioli G, Maiocchi L, Raciti MV, Tinelli C, De Silvestri A, Nichetti M, et al. Detection of liver steatosis with a novel ultrasoundbased technique: a pilot study using MRI-derived proton density fat fraction as the gold standard. Clin Transl Gastroenterol 2019;10:e00081.
crossref pmid pmc
53. Jeon SK, Lee JM, Joo I, Yoon JH, Lee DH, Lee JY, et al. Prospective evaluation of hepatic steatosis using ultrasound attenuation imaging in patients with chronic liver disease with magnetic resonance imaging proton density fat fraction as the reference standard. Ultrasound Med Biol 2019;45:1407-1416.
crossref pmid
54. Bae JS, Lee DH, Lee JY, Kim H, Yu SJ, Lee JH, et al. Assessment of hepatic steatosis by using attenuation imaging: a quantitative, easy-to-perform ultrasound technique. Eur Radiol 2019;29:6499-6507.
crossref pmid pdf
55. Dioguardi Burgio M, Ronot M, Reizine E, Rautou PE, Castera L, Paradis V, et al. Quantification of hepatic steatosis with ultrasound: promising role of attenuation imaging coefficient in a biopsy-proven cohort. Eur Radiol 2020;30:2293-2301.
crossref pmid pdf
56. Lee DH, Cho EJ, Bae JS, Lee JY, Yu SJ, Kim H, et al. Accuracy of two-dimensional shear wave elastography and attenuation imaging for evaluation of patients with nonalcoholic steatohepatitis. Clin Gastroenterol Hepatol 2021;19:797-805.e7.
crossref pmid
57. Sugimoto K, Moriyasu F, Oshiro H, Takeuchi H, Abe M, Yoshimasu Y, et al. The role of multiparametric US of the liver for the evaluation of nonalcoholic steatohepatitis. Radiology 2020;296:532-540.
crossref pmid
58. Ferraioli G, Maiocchi L, Savietto G, Tinelli C, Nichetti M, Rondanelli M, et al. Performance of the attenuation imaging technology in the detection of liver steatosis. J Ultrasound Med 2021;40:1325-1332.
crossref pmid pmc pdf
59. Tada T, Iijima H, Kobayashi N, Yoshida M, Nishimura T, Kumada T, et al. Usefulness of attenuation imaging with an ultrasound scanner for the evaluation of hepatic steatosis. Ultrasound Med Biol 2019;45:2679-2687.
crossref pmid
60. Kwon EY, Kim YR, Kang DM, Yoon KH, Lee YH. Usefulness of US attenuation imaging for the detection and severity grading of hepatic steatosis in routine abdominal ultrasonography. Clin Imaging 2021;76:53-59.
crossref pmid
61. Yoo J, Lee JM, Joo I, Lee DH, Yoon JH, Kang HJ, et al. Reproducibility of ultrasound attenuation imaging for the noninvasive evaluation of hepatic steatosis. Ultrasonography 2020;39:121-129.
crossref pmid pmc pdf
62. Fujiwara Y, Kuroda H, Abe T, Ishida K, Oguri T, Noguchi S, et al. The B-mode image-guided ultrasound attenuation parameter accurately detects hepatic steatosis in chronic liver disease. Ultrasound Med Biol 2018;44:2223-2232.
crossref pmid
63. Imajo K, Toyoda H, Yasuda S, Suzuki Y, Sugimoto K, Kuroda H, et al. Utility of ultrasound-guided attenuation parameter for grading steatosis with reference to MRI-PDFF in a large cohort. Clin Gastroenterol Hepatol 2022;20:2533-2541.e7.
crossref pmid
64. Mehta SR, Thomas EL, Bell JD, Johnston DG, Taylor-Robinson SD. Non-invasive means of measuring hepatic fat content. World J Gastroenterol 2008;14:3476-3483.
crossref pmid pmc
65. Zhong L, Chen JJ, Chen J, Li L, Lin ZQ, Wang WJ, et al. Nonalcoholic fatty liver disease: quantitative assessment of liver fat content by computed tomography, magnetic resonance imaging and proton magnetic resonance spectroscopy. J Dig Dis 2009;10:315-320.
crossref pmid
66. Mellor-Crummey LE, Lake JE, Wilhalme H, Tseng CH, Grant PM, Erlandson KM, et al. A comparison of the Liver Fat Score and CT liver-to-spleen ratio as predictors of fatty liver disease by HIV serostatus. J Clin Gastroenterol Hepatol 2018;2:16.
pmid pmc
67. Tobari M, Hashimoto E, Yatsuji S, Torii N, Shiratori K. Imaging of nonalcoholic steatohepatitis: advantages and pitfalls of ultrasonography and computed tomography. Intern Med 2009;48:739-746.
crossref pmid
68. Qayyum A, Chen DM, Breiman RS, Westphalen AC, Yeh BM, Jones KD, et al. Evaluation of diffuse liver steatosis by ultrasound, computed tomography, and magnetic resonance imaging: which modality is best? Clin Imaging 2009;33:110-115.
crossref pmid pmc
69. Lee SW, Park SH, Kim KW, Choi EK, Shin YM, Kim PN, et al. Unenhanced CT for assessment of macrovesicular hepatic steatosis in living liver donors: comparison of visual grading with liver attenuation index. Radiology 2007;244:479-485.
crossref pmid
70. Raptopoulos V, Karellas A, Bernstein J, Reale FR, Constantinou C, Zawacki JK. Value of dual-energy CT in differentiating focal fatty infiltration of the liver from low-density masses. AJR Am J Roentgenol 1991;157:721-725.
crossref pmid
71. Mendler MH, Bouillet P, Le Sidaner A, Lavoine E, Labrousse F, Sautereau D, et al. Dual-energy CT in the diagnosis and quantification of fatty liver: limited clinical value in comparison to ultrasound scan and single-energy CT, with special reference to iron overload. J Hepatol 1998;28:785-794.
crossref pmid
72. Zhang PP, Choi HH, Ohliger MA. Detection of fatty liver using virtual non-contrast dual-energy CT. Abdom Radiol (NY) 2022;47:2046-2056.
crossref pmid pmc pdf
73. Hu L, Shao X, Qiu C, Shao X, Wang X, Niu R, et al. Hepatic steatosis is associated with abnormal hepatic enzymes, visceral adiposity, altered myocardial glucose uptake measured by 18FFDG PET/CT. BMC Endocr Disord 2020;20:75.
crossref pmid pmc pdf
74. Longo R, Ricci C, Masutti F, Vidimari R, Crocé LS, Bercich L, et al. Fatty infiltration of the liver. Quantification by 1H localized magnetic resonance spectroscopy and comparison with computed tomography. Invest Radiol 1993;28:297-302.
pmid
75. Longo R, Pollesello P, Ricci C, Masutti F, Kvam BJ, Bercich L, et al. Proton MR spectroscopy in quantitative in vivo determination of fat content in human liver steatosis. J Magn Reson Imaging 1995;5:281-285.
crossref pmid
76. Thomsen C, Becker U, Winkler K, Christoffersen P, Jensen M, Henriksen O. Quantification of liver fat using magnetic resonance spectroscopy. Magn Reson Imaging 1994;12:487-495.
crossref pmid
77. Szczepaniak LS, Babcock EE, Schick F, Dobbins RL, Garg A, Burns DK, et al. Measurement of intracellular triglyceride stores by H spectroscopy: validation in vivo. Am J Physiol 1999;276:E977-E989.
crossref pmid
78. Mehta SR, Thomas EL, Patel N, Crofton ME, McCarthy J, Eliahoo J, et al. Proton magnetic resonance spectroscopy and ultrasound for hepatic fat quantification. Hepatol Res 2010;40:399-406.
crossref pmid
79. Guiu B, Petit JM, Loffroy R, Ben Salem D, Aho S, Masson D, et al. Quantification of liver fat content: comparison of triple-echo chemical shift gradient-echo imaging and in vivo proton MR spectroscopy. Radiology 2009;250:95-102.
crossref pmid
80. Springer F, Machann J, Claussen CD, Schick F, Schwenzer NF. Liver fat content determined by magnetic resonance imaging and spectroscopy. World J Gastroenterol 2010;16:1560-1566.
crossref pmid pmc
81. Raptis DA, Fischer MA, Graf R, Nanz D, Weber A, Moritz W, et al. MRI: the new reference standard in quantifying hepatic steatosis? Gut 2012;61:117-127.
crossref pmid
82. Roldan-Valadez E, Favila R, Martínez-López M, Uribe M, Ríos C, Méndez-Sánchez N. In vivo 3T spectroscopic quantification of liver fat content in nonalcoholic fatty liver disease: correlation with biochemical method and morphometry. J Hepatol 2010;53:732-737.
crossref pmid
83. Nakajima A, Eguchi Y, Yoneda M, Imajo K, Tamaki N, Suganami H, et al. Randomised clinical trial: Pemafibrate, a novel selective peroxisome proliferator-activated receptor α modulator (SPPARMα), versus placebo in patients with non-alcoholic fatty liver disease. Aliment Pharmacol Ther 2021;54:1263-1277.
crossref pmid pmc pdf
84. Noureddin M, Lam J, Peterson MR, Middleton M, Hamilton G, Le TA, et al. Utility of magnetic resonance imaging versus histology for quantifying changes in liver fat in nonalcoholic fatty liver disease trials. Hepatology 2013;58:1930-1940.
crossref pmid pmc
85. Idilman IS, Keskin O, Elhan AH, Idilman R, Karcaaltincaba M. Impact of sequential proton density fat fraction for quantification of hepatic steatosis in nonalcoholic fatty liver disease. Scand J Gastroenterol 2014;49:617-624.
crossref pmid
86. Park CC, Nguyen P, Hernandez C, Bettencourt R, Ramirez K, Fortney L, et al. Magnetic resonance elastography vs transient elastography in detection of fibrosis and noninvasive measurement of steatosis in patients with biopsy-proven nonalcoholic fatty liver disease. Gastroenterology 2017;152:598-607.e2.
crossref pmid pmc
87. Konerman MA, Jones JC, Harrison SA. Pharmacotherapy for NASH: current and emerging. J Hepatol 2018;68:362-375. Erratum in: J Hepatol 2018;68:1337.

88. Liu F, Goh GB, Tiniakos D, Wee A, Leow WQ, Zhao JM, et al. qFIBS: an automated technique for quantitative evaluation of fibrosis, inflammation, ballooning, and steatosis in patients with nonalcoholic steatohepatitis. Hepatology 2020;71:1953-1966.
crossref pmid pdf
89. Taylor-Weiner A, Pokkalla H, Han L, Jia C, Huss R, Chung C, et al. A machine learning approach enables quantitative measurement of liver histology and disease monitoring in NASH. Hepatology 2021;74:133-147.
crossref pmid pmc pdf
90. Brunt EM, Clouston AD, Goodman Z, Guy C, Kleiner DE, Lackner C, et al. Complexity of ballooned hepatocyte feature recognition: defining a training atlas for artificial intelligence-based imaging in NAFLD. J Hepatol 2022;76:1030-1041.
crossref pmid
91. Decharatanachart P, Chaiteerakij R, Tiyarattanachai T, Treeprasertsuk S. Application of artificial intelligence in chronic liver diseases: a systematic review and meta-analysis. BMC Gastroenterol 2021;21:10.
crossref pmid pmc pdf
92. Eslam M, Newsome PN, Sarin SK, Anstee QM, Targher G, Romero-Gomez M, et al. A new definition for metabolic dysfunctionassociated fatty liver disease: an international expert consensus statement. J Hepatol 2020;73:202-209.
crossref pmid
93. Kang SH, Cho Y, Jeong SW, Kim SU, Lee JW. From nonalcoholic fatty liver disease to metabolic-associated fatty liver disease: big wave or ripple? Clin Mol Hepatol 2021;27:257-269.
crossref pmid pmc pdf

Editorial Office
The Korean Association for the Study of the Liver
Room A1210, 53 Mapo-daero(MapoTrapalace, Dowha-dong), Mapo-gu, Seoul, 04158, Korea
TEL: +82-2-703-0051   FAX: +82-2-703-0071    E-mail: kasl@kams.or.kr
Copyright © The Korean Association for the Study of the Liver.         
COUNTER
TODAY : 2210
TOTAL : 1781586
Close layer