


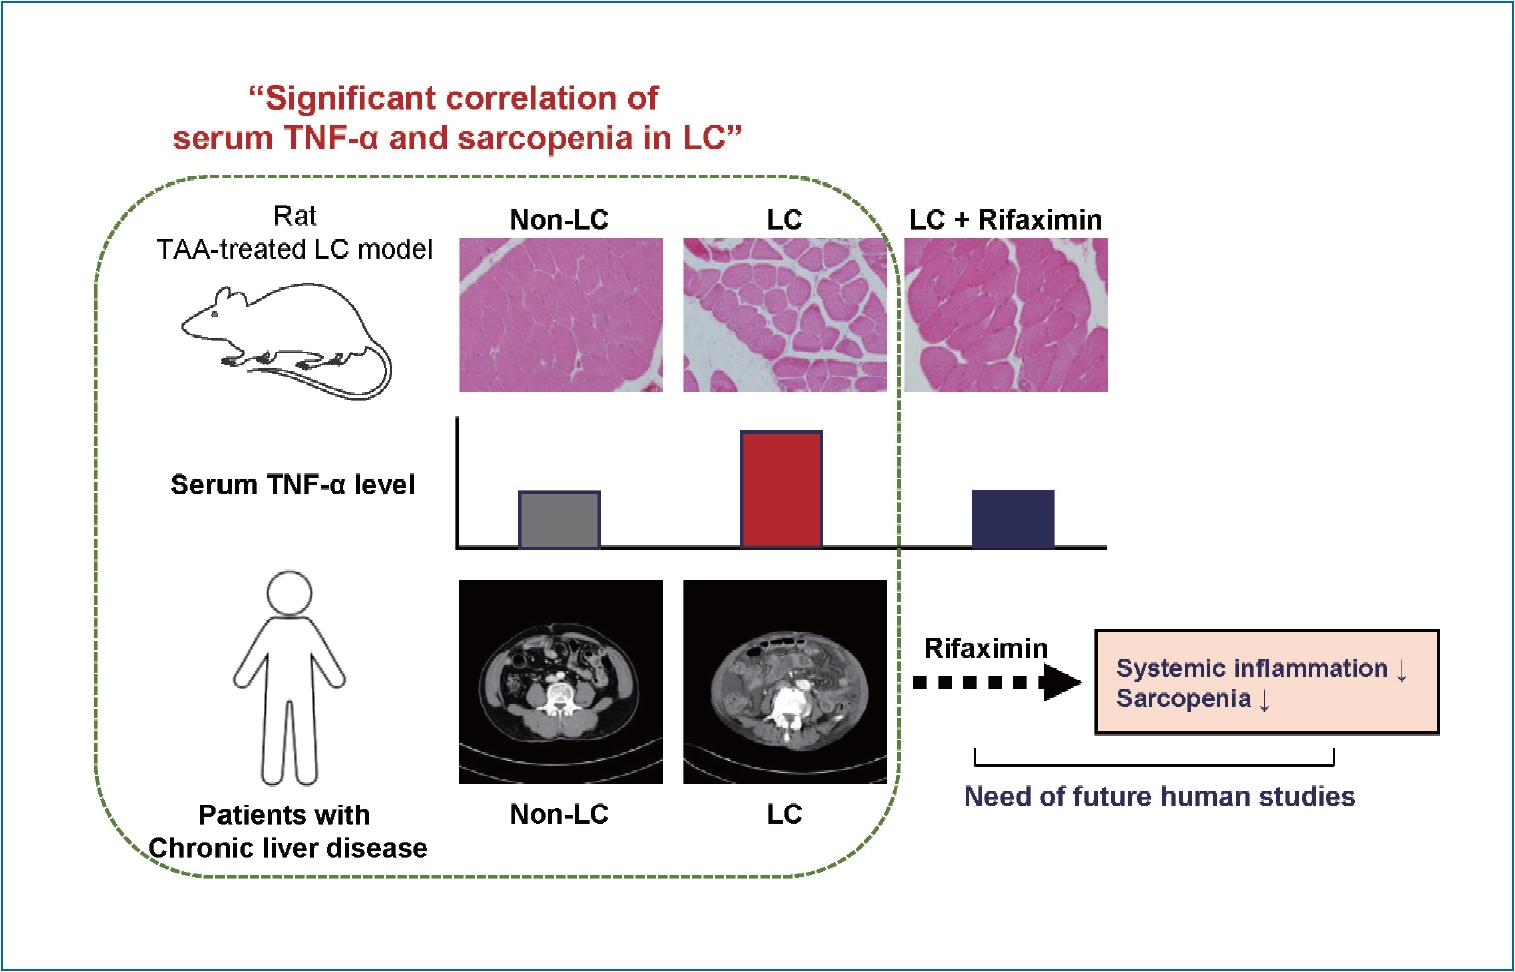
Graphical Abstract
INTRODUCTION
Sarcopenia is defined as muscle atrophy and depletion, and it is prevalent in elderly individuals. Sarcopenia is associated with decreased protein intake [1] and reduced levels of growth hormone and cortisol [2]. In addition, chronic low-grade inflammation, as indicated by the increased levels of inflammatory cytokines such as interleukin (IL)-6 and tumor necrosis factor-╬▒ (TNF-╬▒) [3-5], is also associated with sarcopenia. More importantly, sarcopenia is a risk factor for mortality in elderly people [6]. Sarcopenia is prevalent in patients with liver cirrhosis (LC), affecting 40ŌĆō70% of LC patients [7], and it is associated with increased LC complications [8]. Emerging evidence has suggested that sarcopenia is an independent prognostic factor in LC patients [9,10]. It is a major risk factor for mortality in LC patients regardless of the degree of liver function deterioration [11]. As sarcopenia was also correlated with poor liver function, the inclusion of sarcopenia in the model for end-stage liver disease (MELD) could effectively predict mortality in patients with LC [12]. Therefore, identifying the mechanism of sarcopenia and how it can be modulated might provide clinical benefits to patients with LC.
The mechanism of sarcopenia in LC is not fully understood. Hyperammonemia, which is considered to be a main contributor to hepatic encephalopathy (HE), is one of the causes of sarcopenia in LC [13,14]. Several previous studies reported that hyperammonemia reduces the synthesis of muscle protein and induces dysfunction in mitochondria, which might exacerbate muscle damage through oxidative stress [15,16]. In addition, a previous study showed that reducing ammonia levels with rifaximin was associated with improvements in sarcopenia in a rat model [17]. In LC patients, inflammatory cytokines such as IL-6 and TNF-╬▒, which play roles in the development of sarcopenia in elderly individuals [3], are increased [18]. However, their roles in LC-related sarcopenia remain unclear.
In the present study, we investigated the association between inflammatory cytokines and sarcopenia using a thioacetamide (TAA)-induced rat model of LC and data from patients with chronic liver disease (CLD). We also examined the effect of rifaximin, an antibiotic that reduces the levels of ammonia-producing intestinal bacteria, on the levels of both inflammatory cytokines and sarcopenia.
MATERIALS AND METHODS
Rats
Sprague-Dawley rats (6-week-old males) were purchased from DBL Inc. Rats in the LC and rifaximin groups were intraperitoneally injected with 4% TAA (Sigma-Aldrich, St. Louis, MO, USA) at a dose of 200 mg/kg three times per week for 10 weeks. Rats in the control group were intraperitoneally injected with saline at a dose of 10 mL/kg of body weight three times per week for 10 weeks. After 10 weeks of injections, the rats were rested for 3 weeks to avoid analyzing the direct effects of the TAA. Rifaximin (50 mg/kg/day) was administered daily for 6 weeks by oral gavage starting at 7 weeks after initiation of TAA injections. Six rats were used for the control, LC, and LC plus rifaximin groups. Among them, two rats in the LC group were excluded from the subsequent analyses because of death during the TAA injection period. The rats were sacrificed, and blood samples from the abdominal aorta and liver, intestine (terminal ileum), and calf muscle (gastrocnemius and soleus muscles) tissue samples were collected. To measure aspartate aminotransferase (AST), alanine aminotransferase (ALT), albumin, and total bilirubin levels in serum, we used an AU480 analyzer (Beckman Coulter, Seoul, Korea). For histologic examinations, muscle, liver, or intestinal tissues were fixed with 10% formalin and embedded in paraffin. After sectioning at a thickness of 4 ╬╝m, the samples were stained with hematoxylin and eosin (H&E). Myofiber diameters were measured at ├Ś200 magnification, and the average minimal diameter of five myofibers was used for analyses. Liver tissues were examined at each magnification. Sirius red (Abcam, Cambridge, UK) staining of liver tissues was performed according to the manufacturerŌĆÖs instructions.
Immunohistochemistry (IHC)
IHC was performed using mouse- and rabbit-specific HRP/DAB detection IHC kits (Abcam) according to the manufacturerŌĆÖs instructions. Briefly, following deparaffinization and blocking, primary antibodies for each molecule were applied. After the samples were washed, anti-mouse or rabbit antibodies were applied and incubated at room temperature for 10 minutes, followed by streptavidin peroxidase and DAB substrate application. Antibodies against occludin, zona occludens (ZO)-1, and myostatin were all purchased from Abcam. Each protein was quantified by automated scoring using ImageJ software version 1.53 (NIH, Bethesda, MD, USA) as previously described [19].
Real-time quantitative polymerase chain reaction (RT-PCR)
RNA was extracted and isolated from rat liver, intestine, and muscle tissues using TRIzol┬« reagent (Sigma-Aldrich) according to the manufacturerŌĆÖs protocol. RNA was reverse-transcribed into cDNA using a PrimeScript RT reagent kit (Takara, Shiga, Japan). PCR was performed using qPCR 2├Ś premix (Enzynomics, Daejeon, Korea) and a Light Cycler 2.0 system (Roche, Mannheim, Germany). The relative expression of each gene was normalized to that of GAPDH. Information about the primers is presented in Table 1.
Enzyme-linked immunosorbent assay (ELISA)
Serum levels of ammonia, lipopolysaccharide (LPS), IL-6, and TNF-╬▒ were analyzed using ELISA kits from R&D Systems (Minneapolis, MN, USA) according to the manufacturerŌĆÖs protocol. Optical density values were determined at 450 nm using a VersaMax ELISA microplate reader (Molecular Devices, Sunnyvale, CA, USA).
Study patients
We included 198 patients with chronic hepatitis or LC who visited Seoul St. MaryŌĆÖs Hospital, The Catholic University of Korea between January 2018 and December 2019 and underwent laboratory tests, including serum cytokine panels, and retrospectively analyzed the data. Among them, 74 patients without transient elastography, 14 patients with hepatocellular carcinoma (HCC) stage 3 or 4 by modified Union for International Cancer Control staging, and 50 patients without computed tomography (CT) scans were excluded. All patients with HCC were treatment na├»ve. Therefore, 60 patients were analyzed in the present study. Data including age, sex, height, etiology of liver disease, liver stiffness (LS), serum IL-6, and TNF-╬▒ levels were collected from medical records. Transient elastography, CT scans, and cytokine levels were measured within a 3-month period. LS was examined using FibroScan┬« (Echosense, Paris, France) and presented as kPa, as previously described [20]. An LS of 7 kPa was used as the cutoff value of fibrosis because patients with 7 kPa predicted significant fibrosis over F2 in a previous report [21]. An LS of 10 kPa was also used as a secondary cutoff because it reflects advanced liver fibrosis over F3 [22]. Serum TNF-╬▒ levels were examined using a MILLPLEX MAP human cytokine panel (Millipore, Billerica, MA, USA) and Luminex 200 (Luminex, Austin, TX, USA) as previously described [23].
L3 skeletal muscle index (L3SMI)
Skeletal muscle area was calculated on abdominal CT scans at the L3 vertebra level using the BMI_CT program as previously described [24]. The L3SMI was calculated by dividing the skeletal muscle area at the L3 vertebra level by the squared height and presented as cm2/m2. Sarcopenia was defined as L3SMI Ōēż52.4 cm2/m2 in males and Ōēż38.5 cm2/m2 in females [24].
RESULTS
The development of LC correlated with sarcopenia in a rat model
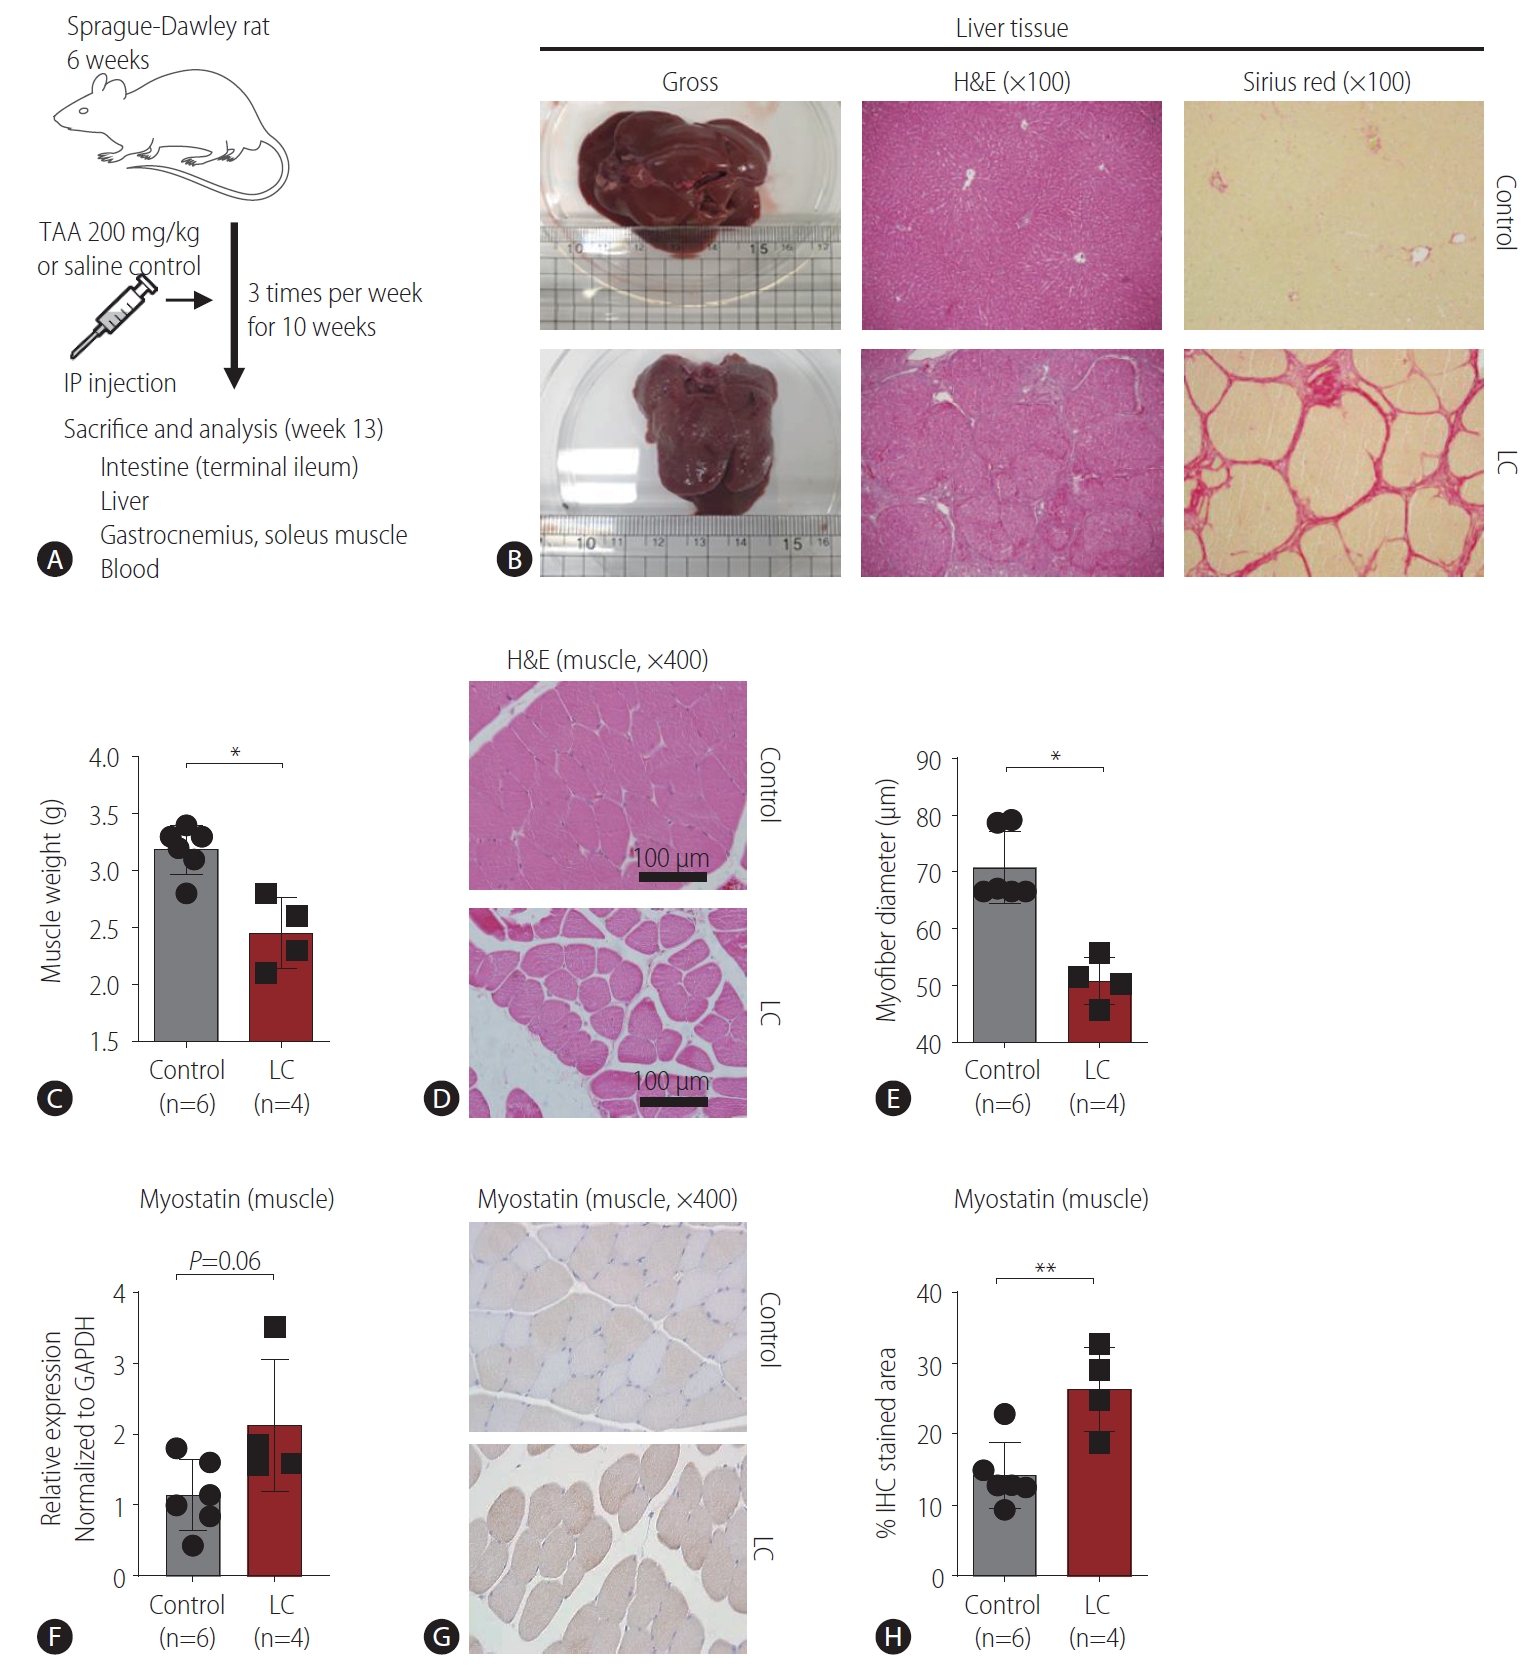
We induced LC in Sprague-Dawley rats by 3 TAA injections per week for 10 weeks, and we sacrificed the animals at week 13 (Fig. 1A). When we measured liver sizes, the TAA-injected rats had significantly smaller livers than the saline controls (Fig. 1B, Supplementary Fig. 1A). Furthermore, H&E staining showed regenerative nodules with significant fibrosis in TAA-induced rats, and this result was confirmed by Sirius red staining, suggesting that LC was successfully induced in these rats (Fig. 1B). LC rats had significantly lower body weights (Supplementary Fig. 1B), but serum levels of AST, ALT, albumin, and total bilirubin were not different between the two groups (Supplementary Fig. 1C). Next, we measured the weights of the gastrocnemius and soleus muscles and found that the rats with TAA-induced LC had lower muscle weights than the controls (Fig. 1C). In addition, the myofiber diameters in the calf muscles of the LC rats were significantly lower than those of the control rats (Fig. 1D, E), indicating that our model effectively induced sarcopenia. Myostatin expression in the calf muscle, which correlates with the degree of sarcopenia [25], tended to increase in LC rats (Fig. 1F). In addition, immunohistochemical analysis of myostatin in the calf muscle showed stronger staining in LC rats than in control rats (Fig. 1G, H). Finally, liver size and muscle weight were significantly correlated (Supplementary Fig. 1D). These findings suggest that our model effectively induced both LC and sarcopenia and that these factors correlated with each other.
Serum TNF-╬▒ levels were associated with sarcopenia
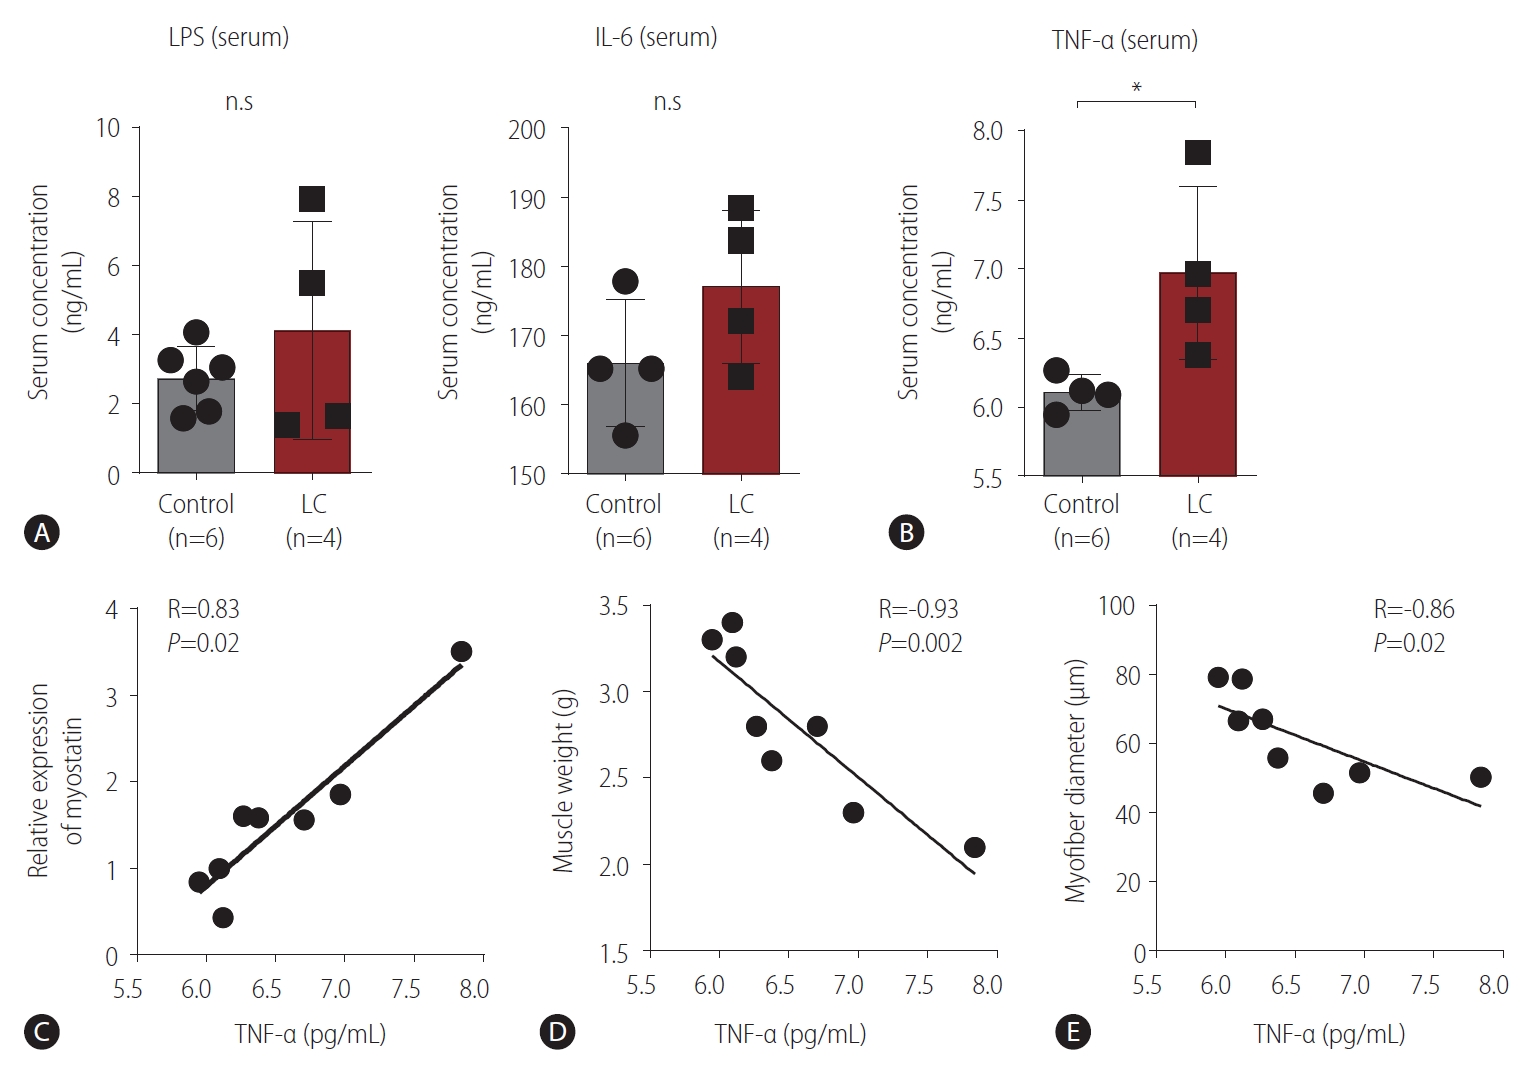
Next, we hypothesized that inflammatory mediators associated with sarcopenia would be increased in LC rats. Serum level of LPS, which can induce multiple inflammatory molecules, did not differ significantly between the LC and control groups (Fig. 2A). Similarly, serum level of IL-6, which is a representative inflammatory cytokine associated with LC and sarcopenia, did not differ significantly between the two groups (Fig. 2A). However, serum level of TNF-╬▒, another representative inflammatory cytokine in both LC and sarcopenia, was significantly higher in LC rats than in control rats (Fig. 2B). Next, we examined whether this increase in TNF-╬▒ was associated with sarcopenia. We found that myostatin expression (Fig. 2C), muscle weight (Fig. 2D), and myofiber diameter (Fig. 2E) in calf muscle correlated with serum TNF-╬▒ levels.
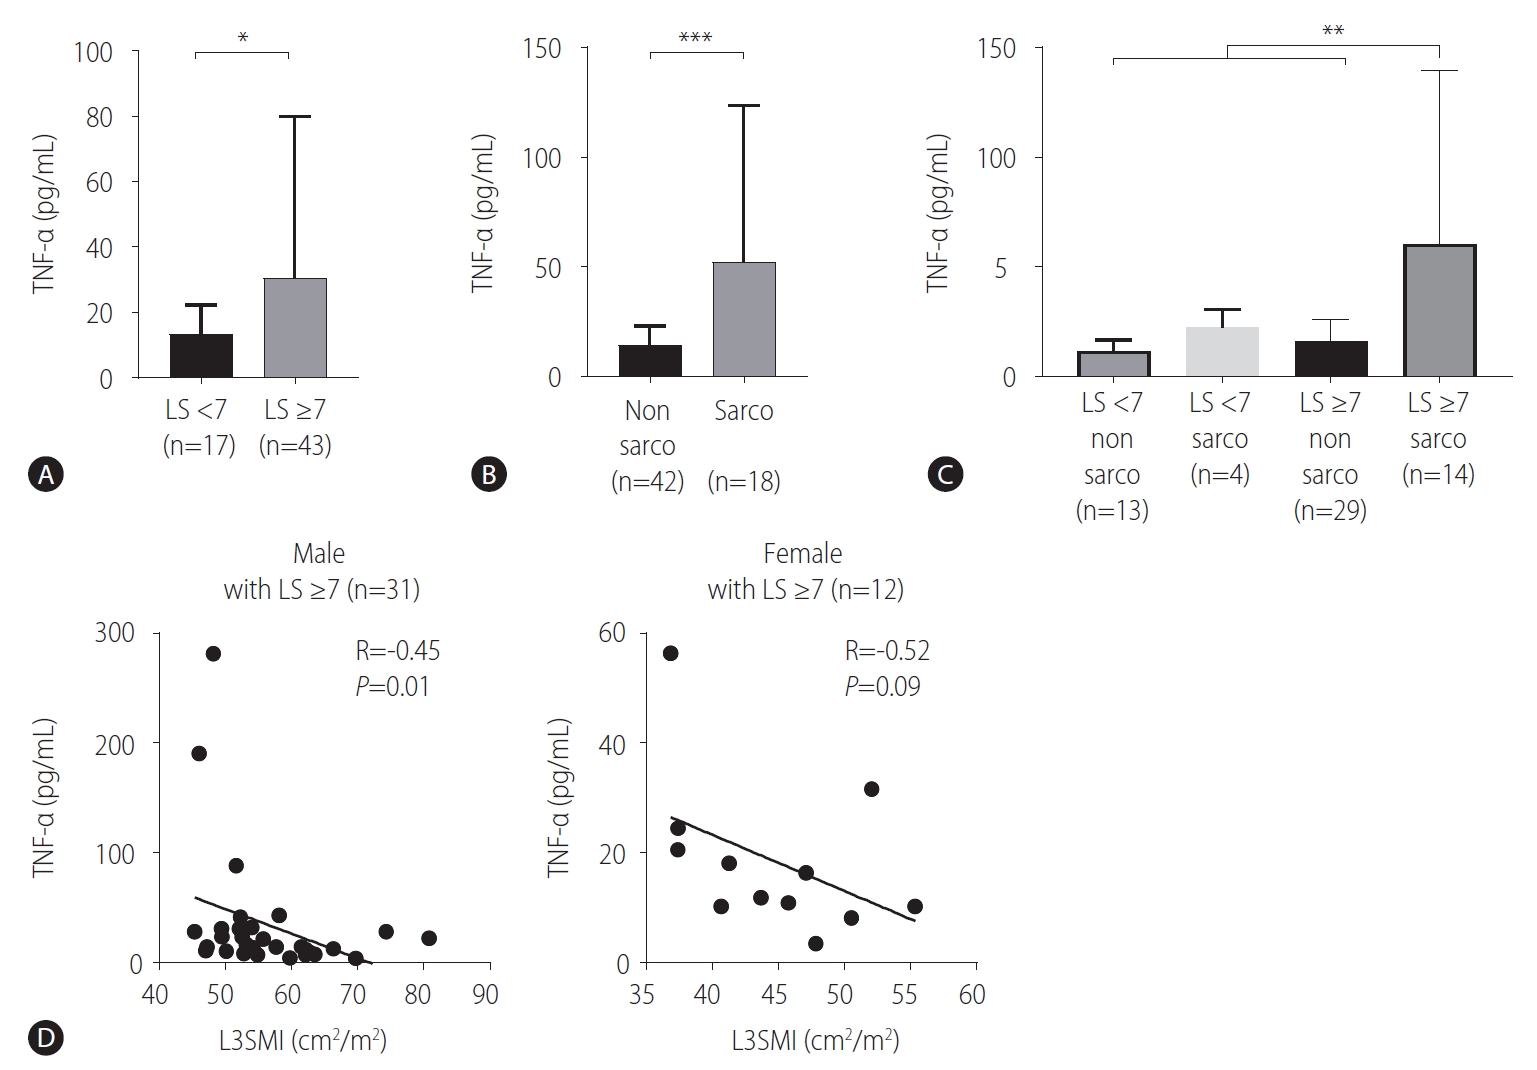
We validated these findings in human subjects with CLD, such as chronic hepatitis or LC. Patient characteristics according to high (Ōēź7 kPa) and low (<7 kPa) LS are presented in Table 2. The high LS group included more LC patients (40/43, 93.0%) than the low LS group (5/17, 29.4%) (P<0.001), although the MELD score was not different between the two groups (Table 2). As observed in rats, there was no difference in serum IL-6 levels between the high and low LS groups (Supplementary Fig. 2). Importantly, we found that patients with high LS (n=43) had significantly higher serum TNF-╬▒ levels than those with low LS (n=17) (Table 2, Fig. 3A). Moreover, patients with sarcopenia (n=18) had significantly higher serum TNF-╬▒ levels than those without sarcopenia (n=42) (Fig. 3B). We further divided patients into LS Ōēź10 kPa (n=33) and LS <10 kPa groups (n=27), and serum TNF-╬▒ levels were also significantly higher in patients with LS Ōēź10 kPa (Table 2). Furthermore, we compared serum TNF-╬▒ levels among the LS <7 kPa/sarcopenia (-) (n=13), LS <7 kPa/sarcopenia (+) (n=4), LS Ōēź7 kPa/sarcopenia (-) (n=29) and LS Ōēź7 kPa/sarcopenia (+) groups (n=14). The LS Ōēź7 kPa/sarcopenia (+) group showed significantly higher serum TNF-╬▒ levels than the other groups, including the LS Ōēź7 kPa/sarcopenia (-) group (Fig. 3C). Importantly, the L3SMI value was inversely correlated with serum TNF-╬▒ levels in male patients with an LS Ōēź7 kPa (n=31), whereas there was marginal significance in female patients (n=12), which might be due to the small sample number (Fig. 3D). These findings suggested that the LC-associated increase in TNF-╬▒ was associated with sarcopenia.
Altered expression of intestinal tight junction molecules correlated with TNF-╬▒-associated sarcopenia
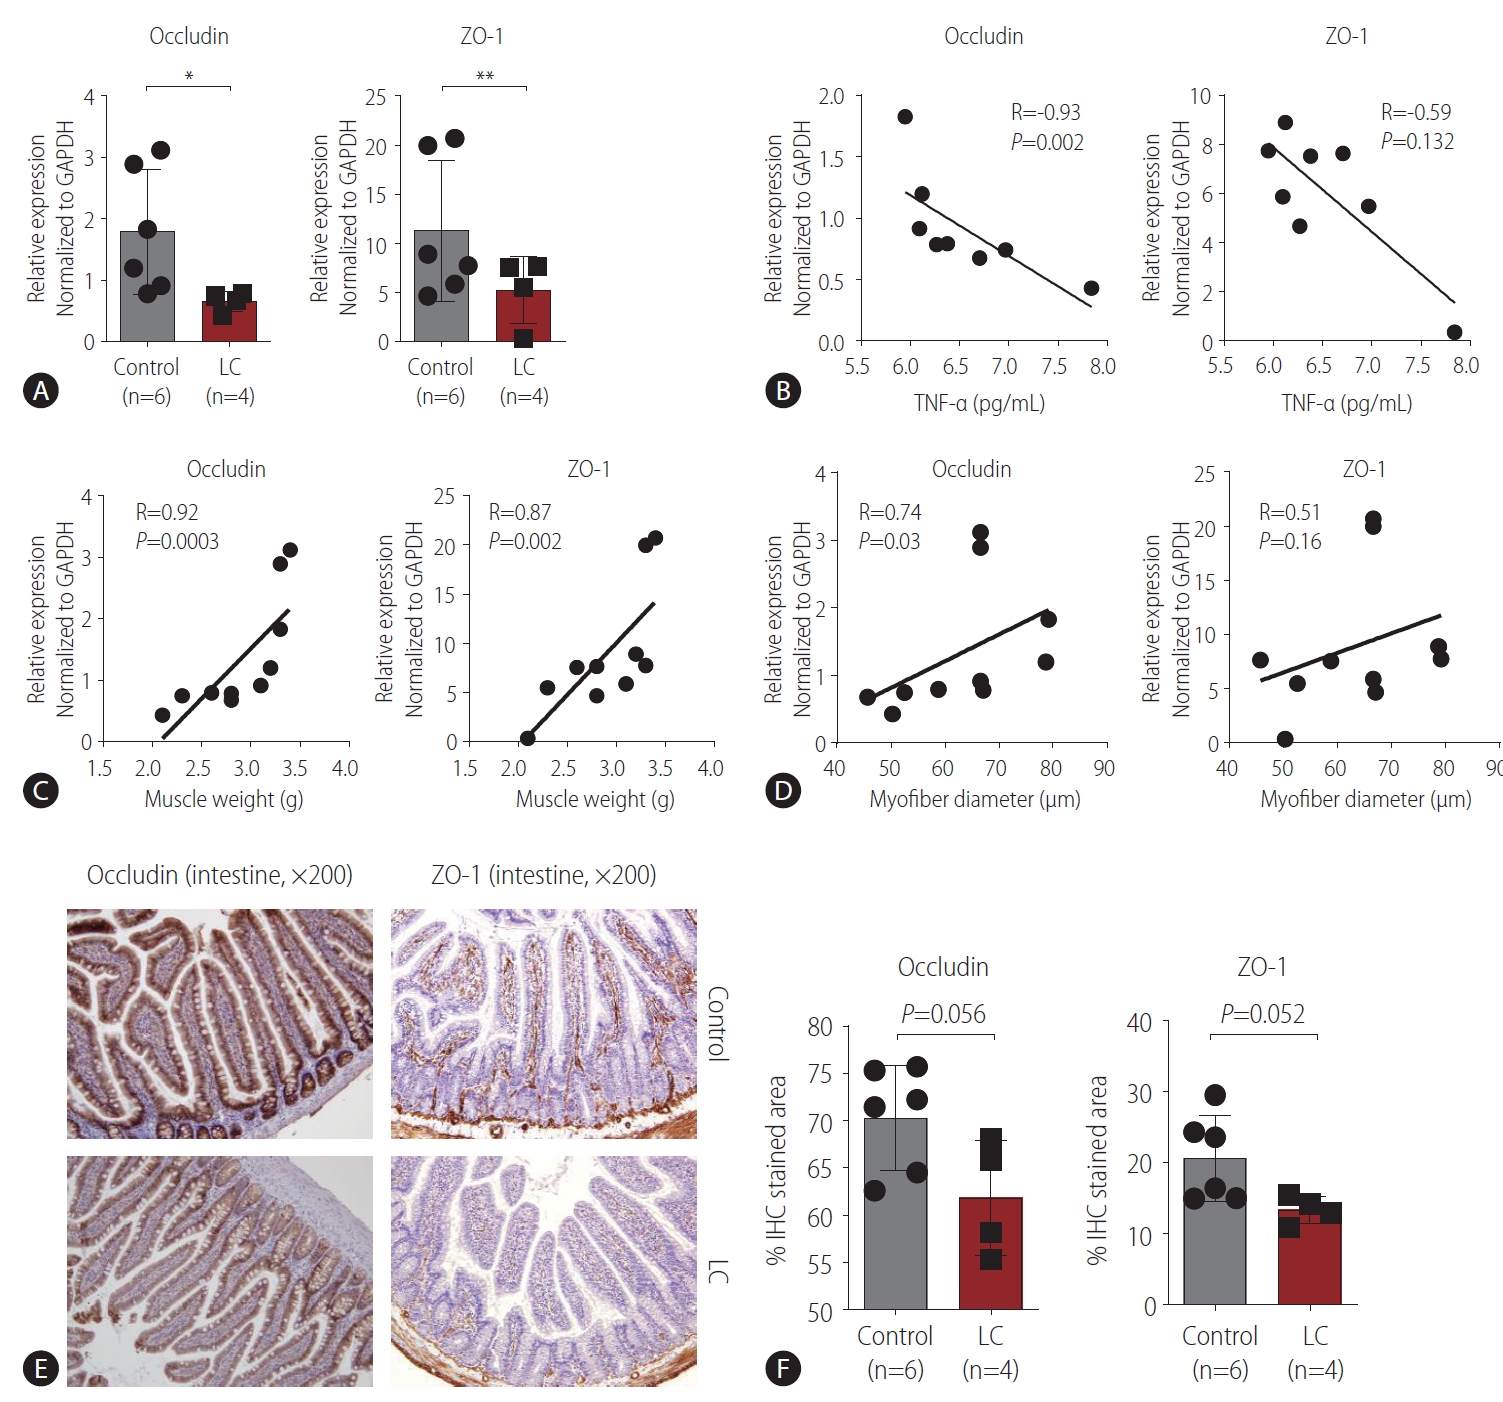
Because previous reports suggested that increased serum TNF-╬▒ levels are associated with altered intestinal tight junctions [26,27], we measured the expression of intestinal occludin and ZO-1, which maintain the integrity of intestinal tight junctions [28]. Compared with the controls, rats with LC showed significantly lower expression of occludin and ZO-1 (Fig. 4A). When we examined the correlation between the expression of these tight junctional molecules and serum TNF-╬▒ levels, we found significant negative correlations (Fig. 4B), suggesting that alterations in intestinal tight junctions are linked to systemic inflammation. Next, we examined the correlation between the expression of tight junctional molecules and sarcopenia. Both occludin and ZO-1 expression in the intestine correlated with muscle weight (Fig. 4C). Moreover, occludin expression was associated with myofiber diameter, although ZO-1 expression was not (Fig. 4D). When we separately analyzed the correlation between occludin or ZO-1 expression and muscle weight or diameter in control and LC rats, we could not find significant correlations, which might be due to the small sample number (Supplementary Fig. 3). We also performed immunohistochemical analysis of occludin and ZO-1 in the intestinal tissues of each group and found that their levels tended to be lower in LC rats than in the controls (Fig. 4E, F). These findings suggest that alterations in tight junctions are linked to systemic inflammation and sarcopenia.
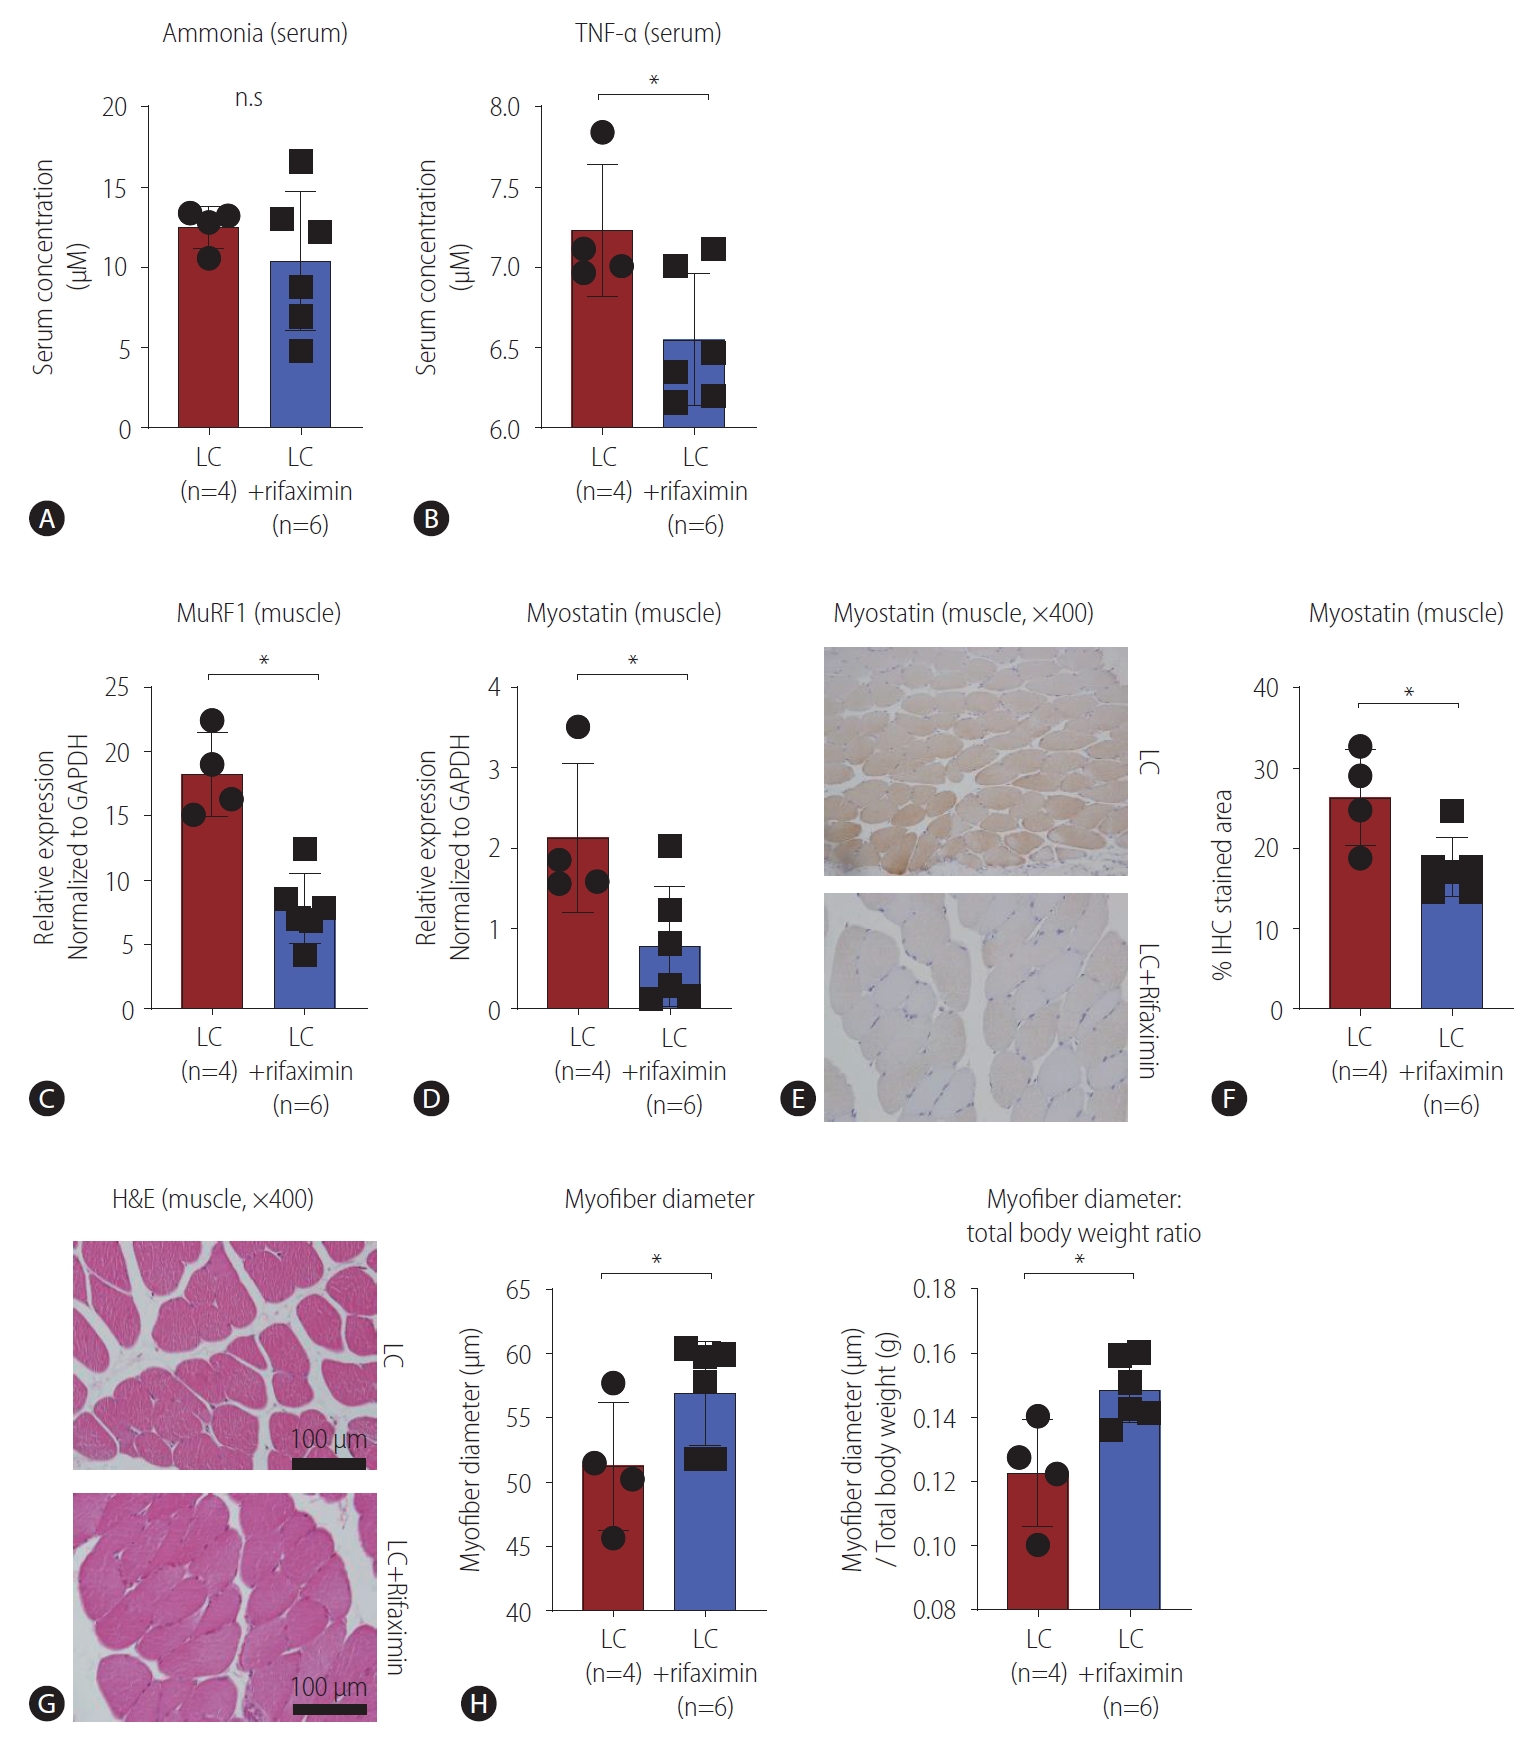
Rifaximin improved TNF-╬▒-associated sarcopenia
Rifaximin has been reported to improve sarcopenia that occurs with cirrhosis because of its ammonia-lowering effect [17]. Therefore, we first tested whether rifaximin affected the ammonia levels in our LC model, and we did not find any significant difference in serum ammonia levels between the rifaximin-treated and untreated groups (Fig. 5A). Previous reports suggested that rifaximin could improve systemic inflammation in LC [29,30]. When we compared serum level of TNF-╬▒ between the groups, we observed a significant decrease in the rifaximin-treated group (Fig. 5B). We also evaluated whether sarcopenia in the LC model could be improved by rifaximin treatment. MuRF1 expression in muscle tissue, which is associated with muscle atrophy caused by cirrhosis [31], was significantly lower in the rifaximin-treated group than in the LC group (Fig. 5C). Similarly, muscular myostatin expression was significantly lower in the rifaximin-treated group than the LC group (Fig. 5D), which was confirmed at the protein level by IHC (Fig. 5E, F), suggesting that the expression of molecules associated with LC-related sarcopenia was reversed by rifaximin treatment. Next, we also performed IHC to analyze occludin and ZO-1 in the intestinal tissues in the two groups, but only ZO-1 tended to be increased in rifaximin-treated LC rats (P=0.067) (Supplementary Fig. 4A). When we measured myofiber diameters, we found significant improvements in the rifaximin-treated group (Fig. 5G, H). Furthermore, although the total body weight and muscle weight of LC rats were not significantly increased by rifaximin (Supplementary Fig. 4B), the ratio of myofiber diameter to total body weight was significantly increased (Fig. 5H). These findings suggested that rifaximin can improve LC-related sarcopenia, which is associated with systemic inflammation.
DISCUSSION
In the present study, we showed that sarcopenia was effectively induced in rats with TAA-induced LC. In addition, serum TNF-╬▒ levels were increased in LC rats compared with controls, and this increase correlated with sarcopenia, which was also verified in human subjects with CLD. Furthermore, rifaximin improved TNF-╬▒-associated sarcopenia in LC. Inflammatory cytokines such as IL-1, IL-6, and TNF-╬▒ have been regarded as catabolic mediators of skeletal muscles [8]. In addition, these inflammatory cytokines were significantly increased in serum of LC patients [18], although their associations with sarcopenia remain unclear. To our knowledge, this pilot study is the first to demonstrate a relationship between serum TNF-╬▒ levels and sarcopenia in an animal model and human subjects. Furthermore, we showed that rifaximin treatment improves both serum TNF-╬▒ levels and sarcopenia, which intensifies the possibility of using rifaximin therapeutically to treat LC-related sarcopenia.
Proinflammatory cytokines such as TNF-╬▒, IL-1, and IL-6 are increased in the sera of patients with LC. These cytokines suppress muscle synthesis, induce protein catabolism and muscle wasting, and are associated with reduced growth hormone levels. Moreover, they are also associated with the recruitment of various immune cells and the activation of the inflammatory pathway, which is an important mechanism of muscle atrophy [32]. However, the association between systemic inflammation and sarcopenia in LC has not been clearly elucidated. In the present study, we found a significant correlation between serum TNF-╬▒ levels and both muscle weight and myofiber diameter, which suggests that targeting systemic inflammation might improve LC-related sarcopenia in an animal model. Importantly, we showed that serum TNF-╬▒ levels were increased in patients with higher LS and correlated with the L3SMI, which suggests that serum TNF-╬▒ might be a target for improving sarcopenia in patients with LC.
Furthermore, we found associations among the expression of intestinal tight junctional molecules, serum TNF-╬▒, and sarcopenia, suggesting that alterations in epithelial barrier integrity are linked to LC-related sarcopenia. A previous report suggested that intestinal barrier dysfunction triggers the release of proinflammatory cytokines, including TNF-╬▒, which is consistent with our results [33]. Indeed, a previous in vitro study showed that the TNF-╬▒ pathway induced LPS-derived inhibition of myogenic differentiation [34]. Therefore, further detailed studies are needed to investigate the association between gut-derived systemic inflammation and sarcopenia. Rifaximin is an oral antibiotic that acts on aerobic/anaerobic and gram-positive/negative bacteria. In patients with LC, it is used to prevent recurrent HE. Rifaximin has been thought to reduce the urease-producing bacterial species that are an important source of ammonia, which is one of the most important neurotoxins in HE [35]. Hyperammonemia reduces protein synthesis in skeletal muscle and induces muscular autophagy by increasing eIF2a phosphorylation and impairing mTORC1 signaling [36,37]. Furthermore, lowering ammonia concentrations using rifaximin reversed the skeletal muscle phenotype, function, and molecular deterioration due to sarcopenia in a rat model of cirrhosis [17]. In this study, rifaximin treatment did not significantly decrease the ammonia level. Instead, serum TNF-╬▒ level, a representative inflammatory cytokine associated with LC, was decreased significantly by rifaximin treatment. In addition, rifaximin treatment improved the myofiber diameter. These findings suggest that lowering the levels of inflammatory cytokines might be an important mechanism by which rifaximin improves LC-related sarcopenia, in addition to its ammonia-lowering effect. In fact, rifaximin might alter inflammation through its direct bactericidal effects or the activation of genes associated with detoxification and the elimination of foreign chemicals [35,38].
In the present study, we also showed the correlation between intestinal tight junctional molecules and muscle diameter or muscle weight. Furthermore, ZO-1 expression tended to be increased by rifaximin treatment. The role of rifaximin in altering gut integrity in LC is still unclear but has been well described previously in a mouse model of irritable bowel syndrome (IBS) [39]. Consistent with our study, rifaximin improved gut permeability and the molecules associated with intestinal tight junctions, including occludin and ZO-1, which might be linked to the TNF-╬▒-NF-╬║B pathway [39]. In another study using an IBS mouse model, rifaximin also altered intestinal bacteria and gut inflammation, which resulted in an improved intestinal barrier [40]. This improvement in gut integrity by rifaximin might further improve the systemic inflammation caused by LC, which can potentiate the amelioration of sarcopenia. However, the detailed effect of rifaximin on intestinal tight junctions in LC and its association with sarcopenia need to be elucidated in future studies.
This study has some limitations. First, the mechanism of TNF-╬▒-induced sarcopenia in LC was not presented in detail. Second, study patients were analyzed retrospectively, and the sample size was small. Third, the role of rifaximin in the regulation of intestinal tight junctional molecules in LC and its impact on improvements in sarcopenia need to be investigated in future studies. Nevertheless, we first showed that elevated serum TNF-╬▒ levels were associated with sarcopenia in an animal model and human subjects with LC, which suggests that targeting TNF-╬▒ is a possible strategy to improve sarcopenia in LC, although future mechanistic and clinical studies are needed.
In conclusion, our study is the first to show an association between systemic inflammation and sarcopenia using a rat model of LC and patients with liver fibrosis. Importantly, rifaximin reduced TNF-╬▒ expression, thereby improving sarcopenia in an animal model with LC. Although further mechanistic and clinical studies are needed, inflammatory cytokines could be candidate therapeutic targets for treating sarcopenia associated with LC. In addition, rifaximin could be considered a treatment option to improve sarcopenia in LC patients.
 PDF Links
 PubReader
 ePub Link
 Full text via DOI
 Full text via PMC
 Download Citation
 Supplement1
 Print
Print