Hepatic angiomyolipoma with minimal fat, mimicking hepatocellular carcinoma
Article information
INTRODUCTION
An angiomyolipoma (AML) is a benign mesenchymal tumor composed of blood vessels, smooth muscle cells, and a varying amount of fat. The liver is the second most common site of AML involvement, after the kidney. In general, hepatic AML can be easily suggested as a diagnosis by identifying the abundant fatty component seen on computed tomography (CT) or magnetic resonance imaging (MRI).1 However, in some instances, intratumoral fat cannot be easily perceived on CT or even on MRI, and is known as AML with minimal fat. AML with minimal fat usually appears as a hypervascular mass on arterial phase images. Given the high incidence of hepatocellular carcinoma (HCC) in Korea, HCC should be put at the top of the differential diagnoses when we encounter a hypervascular hepatic mass. In general, AML shows the different enhancement pattern from that of HCC on portal and delayed phases. However, in the case of AML showing unusual imaging features, including a minimal fat component or an unusual enhancement pattern, AML can mimic HCC, which could thus lead to unnecessary treatment. Recently, liver-specific contrast agent (Gadoxetate disodium, Primovist, Bayer HealthCare, Germany) has been increasingly used to evaluate, detect, and characterize focal hepatic lesions.2 To the best of our knowledge, little is known regarding the imaging features of AML on gadoxetate disodiumenhanced MRI.3,4 We describe here one case of hepatic AML with minimal fat and an unusual enhancement pattern mimicking HCC on the imaging studies including gadoxetate disodium-enhanced MRI.
CASE
A 25-year-old Korean woman with abdominal pain was admitted to our hospital because a hepatic tumor was detected by CT. Her physical examination was unremarkable. She did not have any history of tuberous sclerosis.
Serum viral hepatitis markers, including hepatitis B surface antigen, hepatitis B surface antibody: pisitive and hepatitis C virus antibody, showed negative results. The blood chemistry test revealed the following findings: hemoglobin, 12.9 g/dL; leukocyte count, 7,100/mm3 with 67% neutrophil; platelet count, 336,000/mm3; total bilirubin, 0.8 mg/dL; aspartate aminotransferase, 27 IU/L; alanine aminotransferase, 24 IU/L; and alkaline phosphatase, 58 IU/L. Tumor markers showed 4.6 ng/mL of α-fetoprotein (AFP), 48 mAU/ml of PIVKA-II, 76 U/ml (normal range, 0-35) of CA-125, and 94 U/ml (normal range, 0-37) of CA-19-9.
Non-contrast CT showed a homogenous and well-circumscribed mass with subtle low attenuation in segment IV of the liver, although no gross fat was noted within the mass. On contrast-enhanced CT, the mass was seen as a hypoattenuating lesion in the portal phase (Fig. 1).
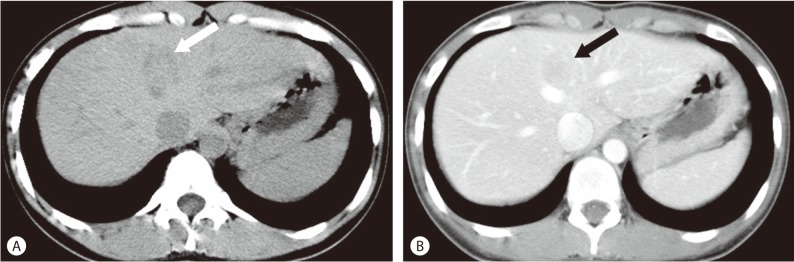
Abdominal CT findings. (A) Non-contrast CT, a homogenous and well-circumscribed mass with subtle low attenuation (arrow) is shown in segment IV of the liver, although no gross fat is noted within the mass. (B) On contrast-enhanced CT, the mass is shown as a hypoattenuating lesion (arrow) in the portal phase.
Subsequent positron emission tomography (PET)/CT with F-18 fluorodexoyglucose (FDG) was performed for evaluation of the hepatic tumor. FDG PET/CT demonstrated homogeneously increased FDG uptake in the tumor which corresponded to a low-density lesion on contrast-enhanced CT (Fig. 2).

PET/CT with FDG findings. PET scanning was performed 60 minutes after the injection of 13.6 mCi F-18 FDG. Axial (A) and coronal (B) images on fused PET/CT show a single mass with increased FDG uptake (arrow, SUVmax 3.8) that corresponds to low density areas on contrast-enhanced CT.
MRI (1.5T Magnetom Avanto, Simens Medical Solutions, Erlangen, Germany) was then performed (Fig. 3). T1-weighted out-of phase image revealed a small focus of signal loss in the peripheral portion of the mass, compared to the in-phase image, indicating a fat component. On T2-weighted image, the mass was shown to be a relatively homogenous and moderately hyperintense lesion. A dynamic contrast-enhanced MRI using gadoxetate disodium was then performed. On the arterial phase image, the tumor was intensely and homogeneously enhanced, and on the delayed phase image, the tumor showed wash-out. On the hepatobiliary phase image obtained in 20 minutes after contrast injection, the low signal intensity of the mass in contrast to the increased signal intensity of the surrounding hepatic parenchyma, was noted. With these image findings as well as a increased FDG uptake in the tumor, we strongly suspected HCC as a differential diagnosis. We also considered the possibility of a hepatic adenoma as the patient does not have chronic liver disease.
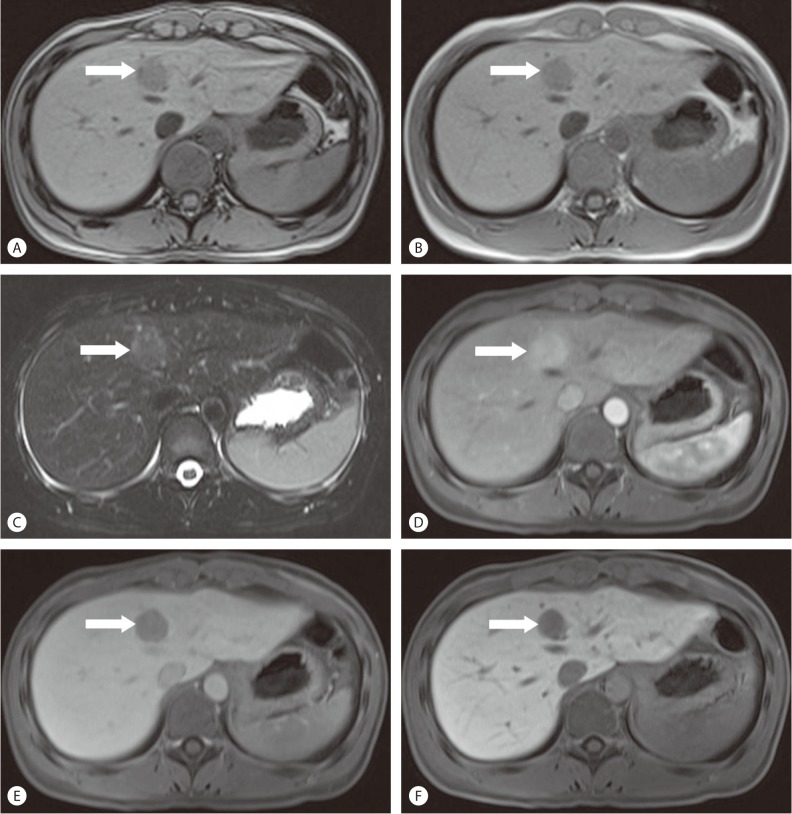
Liver MRI findings. (A) T1-weighted out-of phase image shows a small focus of signal loss (arrow) in the peripheral portion of the mass, (B) Compared to the in-phase images, indicating a fat component. (C) On T2-weighted image, the mass shows to be a relatively homogenous and moderately hyperintense lesion. (D) Dynamic contrast-enhanced MRI using gadoxetate disodium shows intense and homogeneous enhancement of the tumor (arrow) on arterial phase, (E) Washout of the tumor on delayed phase and (F) Low signal intensity of the mass compared to the increased signal intensity of the surrounding hepatic parenchyma on hepatobiliary phase.
Ultrasonography revealed a well-circumscribed, hypoechoic mass in the medial segment of the left lobe of the liver (Fig. 4). We then decided to perform a needle biopsy. Pathologic findings of the needle biopsy specimen indicated hepatic AML.

Sonographic finding. The lesion (arrow) is a well-circumscribed, hypoechoic mass compared with surrounding liver parenchyma.
Even though the mass was confirmed as hepatic AML, the patient underwent laparoscopic left medial segmentectomy as she strongly wished to have the mass removed. Grossly, the tumor was 2.7×2.4×2 cm with a firm consistency and good demarcation from the hepatic parenchyma (Fig. 5). Microscopically, the tumor margin was generally well-demarcated but was focally blurred by a mixture of tumor cells and hepatocytes (Fig. 6A). The vascular wall was irregularly thinned or thickened and spindle-shaped tumor cells were radiating from it (Fig. 6B). Fat vacuoles were aggregated along the tumor margin, corresponding to the grossly visible yellow rim. However, fat vacuoles were only sparsely identified within the tumor (Fig. 6A). The adipose tissue component comprised less than 5% of the total tumor volume. Immunohistochemically, the tumor cells were positive for human melanocyte B-45 (1:50, Dako, Glostrup, Denmark) (Fig. 6C) and smooth muscle actin (1:200, Dako, Glostrup, Denmark) (Fig. 6D), thus confirming the pericytic differentiation. The microscopic features were the same as those seen on the liver biopsy specimen. The histologic and immuhistochemical features were consistent with angiomyolipoma. The patient recovered uneventfully and was discharged eight days following surgery.

Gross photograph of the mass. A well-demarcated ovoid mass has bright yellow rim in periphery (arrows). Internal area is grayish yellow, vaguely lobulated firm and flesh.
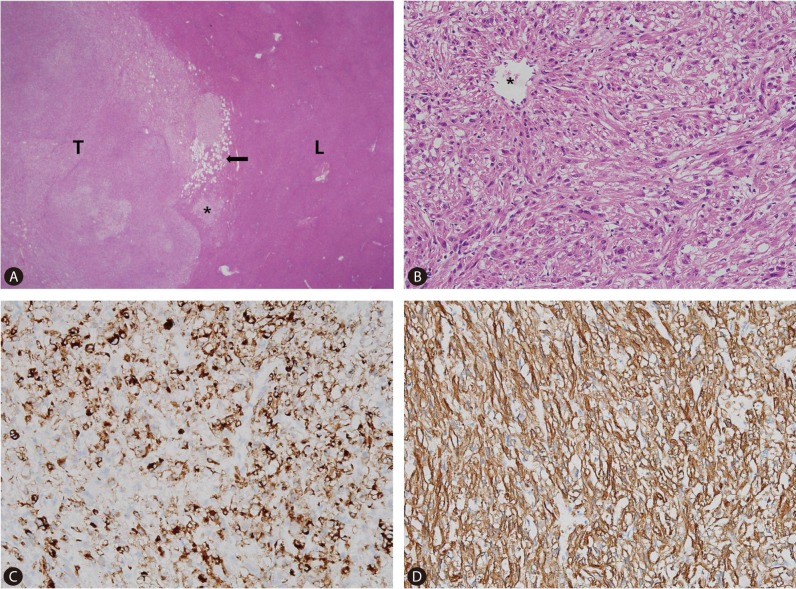
Histologic and immunohistochemical findings. (A) Tumor (T) and liver parenchyma (L) have relative good delineated interface with focal infiltrative margin (asterisk). Fat vacuoles are aggregated in the periphery of the tumor (arrow), but are very rarely identified in the center (original magnification ×40). (B) The spindle shaped tumor cells are arranged in short intersecting fascicles. The cells have abundant eosinophilic cytoplasm and ill-defined cell membrane. (C) Nuclei are round to oval and have small nucleolus. The tumor cells grow radiating from the wall of vessel (asterisk). The spindle cells are positive for human melanocyte B-45 (HMB-45). (D) Smooth muscle actin. HMB-45 is strongly positive in this tumor. Smooth muscle actin demonstrates diffuse strong positive staining in the tumor cells.
DISCUSSION
Hepatic AML is usually asymptomatic and discovered incidentally. A few patients present with abdominal pain which resolves following tumor resection.5 The intratumoral hemorrhage might cause the abdominal pain,6 although the incidence of the complication of hemorrhage or rupture is very low.7
According to the predominant component, hepatic AMLs are categorized as mixed, lipomatous (≥70% fat), myomatous (≤10% fat), and angiomatous types. A classic mixed type of hepatic AML including all of the tissue components, is most commonly seen.8,9 As the proportion of fat in AMLs varies widely from 5 to 90% of the total volume,10 this heterogenicity can cause diagnostic difficulties.
The imaging characteristics of hepatic AML are correlated with its histological components, and detection of the fat content leads to the diagnosis of a typical AML. CT attenuation values less than -20 HU confirm the presence of fat. MRI is more sensitive than CT for detecting fat which appears hypointense on fat saturation pulses11 or on chemical-shift imaging.12 However, it is occasionally difficult to make a differential diagnosis between hepatic AML and other fat-containing hepatic tumors such as fatty metamorphosis of HCC, hepatocellular adenoma with a fat content, lipoma, and liposarcoma.13,14 In the present case, we suspected HCC and hepatocellular adenoma based on the presence of fat on imaging studies.
On dynamic CT and MRI, a previous study reported that hepatic AMLs show early and prolonged enhancement (>4 min) with delayed peak enhancement at 40-80s, as opposed to HCCs which show peak enhancement at 10s and wash-out on the portal and delayed phases.15 However in our patient, the tumor showed marked enhancement on the arterial phase images and obvious wash-out on the portal venous and delayed phase images. These findings are typical imaging findings of HCC rather than of AML.
On hepatobiliary phase images of gadoxetate disodium-enhanced MR, the mass appeared as definite low signal intensity mass compared to the hepatic parenchyma. This finding is also a well known feature of HCC and adenoma.2,16
FDG PET/CT is useful for detecting and differentiating benign from malignant tumors. Even though benign tumors tend to demonstrate a low FDG uptake, in contrast, our case showed increased FDG uptake in the tumor. A few previous reports have described FDG PET findings in patients with hepatic AML, which showed varying amounts of FDG uptake in the tumor.6 Takanami et al.6 suggested that benign hepatic AMLs can show an increased FDG uptake if there is hemorrhage and a related inflammatory response.
In conclusion, hepatic AML with atypical imaging features, as demonstrated in our case, present an obstacle to making the correct diagnosis. Despite its rare incidence, hepatic AML should be considered as a differential diagnosis, particularly if a hypervascular mass is seen in female patients and there is no evidence of chronic liver disease.
SUMMARY
Hepatic AML is a rare benign mesenchymal tumor composed of blood vessels, smooth muscle cells, and a varing amount of fat. We report of one case of hepatic AML with a minimal fat component and atypical enhancement patterns, which mimicked HCC on imaging studies.
Notes
The authors have no conflicts to disclose.
Abbreviations
AML
angiomylolipoma
CT
computed tomography
MRI
magnetic resonance imaging
HCC
hepatocellular carcinoma
AFP
alpha fetoprotein
PET
positron emission tomography
FDG
fluorodexoyglucose