

INTRODUCTION
Chronic Hepatitis B (CHB) is a leading cause of liver cirrhosis and hepatocellular cacinoma in South Korea and a disease that affects over 3 billion people worldwide. Recently, a significant improvement has been made in the treatment of CHB, as various antiviral agents were developed. According to the 3-phase clinical research that compared the effects of lamivudine in HBeAg-positive CHB for 12 months, Entecavir was superior to lamivudine in the aspects of a decrease of serum HBV DNA, the rate of undetectable HBV DNA (less than 300 copies/mL) and alanine aminotransferase (ALT) normalization rate.1 The effect of hepatitis B antiviral drugs has been greatly enhanced thanks to the recent development of entecavir, but the non-response rate of serum ALT level even after 12-month treatment and the rate of partial virologic response were reported 20-30%.2
Godex® which is carnitine and vitamin complex has been used in patients with various liver disease to reduce liver enzyme level. Among previous studies, one clinical test of carnitine complex reported that the ALT normalization rate of ALT elevated chronic liver disease with carnitine complex was 86%.3 Carnitine has showed beneficial effects on various liver disease. The counteracting effect of carnitine on alcoholic fatty liver disease is well documented.4 Dietary supplementation with L-carnitine significantly reduced steatosis, mild inflammation, elevated plasma alanine aminotransferase and tumor necrosis factor alpha.5 However, the exact mechanism by which carnitine reduces steatosis is not clear. Elliott et al suggested that one mechanism may involve Kupffer cells, the resident liver macrophages.6 Carnitine and its acyl derivatives can modulate eicosanoid synthesis by peritoneal macrophages, and decrease their response to chemotactic stimuli.6 Carnitine and vitamin complex supplement reduced serum ALT, aspirate aminotransferase (AST), and bilirubin in nonalcoholic fatty liver disease.4 Carnitine transports long chain fatty acid to mitochondria and cause beta-oxidation, which helps to reduce intrahepatic fat mass and inflammation of non-alcoholic fatty liver disease.7-8 Moreover, the co-administration of carnitine to patients with chronic hepatitis C is reported not only to reduce symptoms, but also to lower the frequency of hematological abnormality resulted from interferon treatment.9-11 It is known that the administration of carnitine influences the activation of lymphocyte.12 Also, carnitine regulates the production of prostaglandin E1 and E2 to control the functions of lymphocyte.12 Carnitine has diverse effects on various liver disease via fatty acid oxidation, immune modulation, and mitochondrial biosynthesis, etc.4-6 However, effects of supplementary carnitinine on CHB have been not investigated.
The purpose of this study is to assess the effect of improving the liver inflammation when Godex® is co-administered to ALT elevated CHB patients who go through the antiviral drug therapy and to identify the clinical safety of carnitine complex.
PATIENTS AND METHODS
Subjects
The subjects of this study are hepatitis patients whose ALT is greater than or equal to 80 U/L but the ALT is less than or equal to 10 times the upper limit of normals and who did not receive the antiviral drug therapy. Specifically, HBV >105 copies/mL in case of HBeAg positive and HBV >104 copies/mL in case of HBeAg negative were included in this study. Acute hepatitis A patients and chronic hepatitis C patients were excluded. Among liver cirrhosis patients, those who had hepatic coma, esophageal variceal hemorrhage, spontaneous bacterial peritonitis, and uncompensated liver cirrhosis of Child-Pugh score Ōēź10 were excluded. Also, patients with hepatocellular carcinoma and malignant tumors in other organs, patients with creatinine of greater than 1.5 times ULN, patients given immunosuppressive drugs in 6 months prior to the enrollment in this study, and patients with serious diseases believed to affect the test other than liver disease (e.g. uncontrollable diabetes, alcoholics, and malignant tumor, etc.) were excluded.
Stratified randomization
Subjects are randomized at an one to one ratio to the entecavir monotherapy and the entecavir plus carnitine complex (Godex®, Seoul, Celltrion pharm) combination therapy. After the central institution grants randomized groups to the study organization, randomization is carried out by stratifying the groups according to the presence of HBeAg by checking if they were HBeAg positive or negative at the time of screening. Computer program generates a list of random numbers. First, with the date of random number generation set as a seed number, two random numbers are created and then used as seed numbers for creating random numbers for two HBeAg positive and negative groups. The block sizes of four and six are both used. Sufficient random numbers are generated in each layer. In each block, entecavier plus carnitine complex combination therapy (test group) was allocated with small numbers and entecavir monotherapy (control group) was allocated to big numbers depending to the size of random numbers. The randomization table is randomly allocated to subjects depending on HBeAg type in the order of the subject patients' enrollment in the study organization. They are randomly selected to be divided into a monotherapy group and a combination therapy group. Entecavir (0.5 mg) and entecavir plus carnitine complex (2 cap./time, 3 times/day, totally 2,472 mg/day, oral administration) were given to the monotherapy group and the combination therapy group, respectively for 12 months.
Test items & schedule
Before and 3, 6, 9, 12 months after medication, ALT, AST, bilirubin, HBV-DNA PCR, HBsAg, HBsAb, HBeAg, and HBeAb were measured. Then abdominal ultrasonography and AFP examination were carried out every six months. HBV DNA was measured by real-time PCR method on a central lab using a COBAS TaqMan analyser (Roche Diagnostics, Mannheim, Germany) with a detection limit of 20 IU/mL. Quantitative HBsAg was tested on a central lab using the ARCHITECT HBsAg QT immunoassay (Abbott Diagnostics, Wiesbaden, Germany). Quantitative HBsAg was examined every 3 months during the follow-up period.
Lymphocyte interferon-╬│ secretion test
Interferon gamma enzyme-linked immunosorbent spot (ELISPOT) examination was performed using the ELISPOT test to evaluate the ability of leucocytic interferon-╬│ secretion caused by HBsAg stimulation. Blood specimen was transferred to the central laboratory within 2 days after blood-collecting. Peripheral blood mononuclear cells (PBMC) were separated here to be stored in a nitrogen tank. Seed 100 ┬ĄL of cell suspension in 5-well plates and put 1uL of dilution of core and surface protein 1 to medium 9. For a positive control group, mAb CD3-2 was added until its maximum concentration reached 100 ng/mL and cultured in 5% CO2 incubator at 37Ōäā for 12-48 hours. The cell suspension was removed and washed five times using PBS. The detection reagent (mAb 7-B6-1) was added in the ratio of 200 to 1 in PBS where 10% FBS is contained and another 100 ┬ĄL of it was added into each well. Incubate it at room temperature for 2 hours and wash five time using PBS. Filter it at 0.45 ┬Ąm and put 100 ┬ĄL of substrate solution (BCIP/NBT-plus) to be developed for 15 minutes. Water-wash and dry it at room temperature to be counted using ELISpot reader (AELVIS, Germany).
Peripheral blood mitochondria copy number
We collected 5 mL of peripheral venous blood before and after administration of each drug an put it in EDTA tube to be kept in a freezer at -80Ōäā. Process it in a centrifuge at room temperature and extract DNA from it, then measure peripheral blood mitochondria DNA using real-time polymerase chain reaction (PCR) using COBAS Ampliprep (Roche, Indianapolis, IN, USA). Develop a probe for GAPDH and mtDNA and mark 5' terminal and 3' terminal each with 5-carboxyfluorescein(FAM) reporter and 6-carboxy-tetramethyl-rhodamine (TAMRA) quencher. PCR was performed for mtDNA and PCR mixture was 15 ┬ĄL which consists of TaqMan Universal PCR Master Mix (ABI, USA) 7.5 ┬ĄL, primer forward (5 pmol/mL) 1.5 ┬ĄL, primer reverse (5 pmol/mL) 1.5 ┬ĄL, probe (1 pmol/┬ĄL) 1.5 ┬ĄL, and distilled water 0.5 ┬ĄL, DNA 2.5 ┬ĄL. PCR used ABI 7500 Real-Time PCR System and amplification was repeated forty times on conditions of 2 minutes at 50Ōäā, once for 10 minutes, 15 seconds at 95┬░, and 1 minute at 60┬░. For a qualitative analysis of mitochondrial DNA copy number, the comparative analysis using the amplification of glyceraldehyde-3-phosphate dehydrogenase (GAPDH) was implemented.
Statistical analysis method
Since the primary end point is ALT normalization rate when 12-month treatment is completed, Fisher's exact test or Chi-square test needs to be used to verify the difference between two groups. But, if there are significant differences between demographic data and clinical history data, logistic regression analysis is used for correction.
Continuous variables (HBsAg titer, HBV DNA titer, ELISPOT and the peripheral blood mitochondrial DNA copy number) were analyzed by t -test or Wilcoxon Rank test. Categorical variables (rate of ALT normalization and HBV DNA <300 copies/mL) were analyzed by the Fisher's exact test of Chi-square test.
RESULTS
Subjects
A total of 130 patients were randomized in this clinical trial. Out of those randomized patients, six were excluded from analysis due to withdrawal, two due to follow-up failure, one due to adverse reactions, and two due to inclusion/exclusion criteria, while a total of 119 patients were included in this study (Fig. 1). The average ages of the monotherapy group and the combination therapy group were 44.9 and 43.0 years old, respectively. There was no difference in ALT, AST, and virus concentration in serum between two groups (Table 1).
Normalization rate of aminotransferase activity
Normalization rates of subjects' serum ALT were 58.9% and 87.5% in 3-month dosing and 6-month dosing for the monotherapy group, and 95.2% and 100% for the combination therapy group, which showed that the figure was statistically higher in the combination therapy group (P<0.0001 vs. P=0.0038). After 9-month dosing, the figures showed no significant difference between the monotherapy group and the combination therapy group (P=0.1011). At the time of 12-month dosing, the figures showed statistically significant difference between two groups with 85.7% and 100% (P=0.0019) (Fig. 2). On condition of the ALT threshold value below than 30 U/L for males and 19 U/L for females, the serum ALT normalization rates after 3, 6, 9-month dosing were statistically significantly higher in the combination therapy. At the time of 12-month dosing when the study is completed, the normalization rates were 69.6% in the monotherapy group and 93.7% in the combination therapy group, which showed statistically significant difference between two groups (P=0.0006) (Table 2). At the time of 12-month dosing, the average values of serum ALT were 25.2┬▒15.0 in the monotherapy group and 13.6┬▒5.1 in the combination therapy group, which showed lower in the combination therapy group (P<0.0001). When pretreatment ALT was over 200 U/L, the serum ALT normalization rates after 3-month dosing were 53.9% and 88.2% in the monotherapy group and the combination therapy group, respectively (P=0.0348). At the time of 12-month dosing when the study is completed, the ALT normalization rates were 69.2% and 100% in the monotherapy group and the combination therapy group, respectively, which showed statistically significant difference between two groups (P=0.014). Normalization rates of subjects' serum AST were 73.2% and 79.4% in 3-month dosing and 12-month dosing for the monotherapy group, and 92.6% and 88.9% for the combination therapy group, which showed no significant difference between the monotherapy group and the combination therapy group.
Seroconversion rate and virus negative conversion rate
The rates of ALT normalization and HBV DNA of less than 300 copies/mL after 3, 6, 9, 12-month dosing were 43.6%, 50.9%, 69.1%, 75.9% in the monotherapy group and 54.8%, 50.0%, 64.4%, 70.7% in the combination therapy group, respectively, which showed the increasing trend of serum virus negative conversion rate in both groups according to treatment period, but no difference in HBV DNA negative conversion rate between two groups.
HBeAg seroclearance rates at the time of therapeutic termination were 14.3% and 5.6% in the monotherapy group and the combination therapy group, respectively while HBeAg seroconversion rates were 10.2% and 5.6% in the monotherapy group and the combination therapy group, respectively, which showed no difference between two groups. In the monotherapy group, quantitative HBsAg level declined from 42,810 IU/mL to 10,433 IU/mL at the time of 12-month dosing on average, while in the combination therapy group, quantitative HBsAg level reduced from 44,037 IU/mL to 8,621 IU/mL at the time of 12-month dosing on average, which showed no difference between two groups.
Lymphocyte interferon-╬│ secretion test (ELISPOT test)
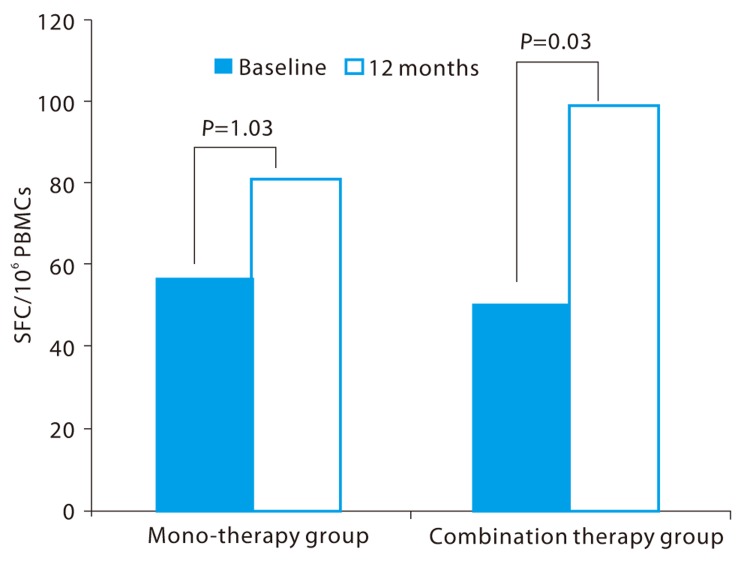
Before treatment, the abilities of leucocytic interferon-╬│ secretion caused by hepatitis B surface antigen stimulation were 56.5 SFC/106 PBMCs and 50.5 SFC/106 PBMCs in the monotherapy group and the combination therapy group, respectively. But after 12-month treatment, the ELISPOT values increased to 81.3 SFC/106 PBMCs and 99.2 SFC/106 PBMCs, respectively. The monotherapy group showed no statistical difference in the ability of leucocytic interferon-╬│ secretion between pretreatment and 12-month treatment (P=0.131), but the combination therapy group showed a significant increase in the 12-month treatment compared to pretreatment (P=0.030) (Fig. 3).
Peripheral blood mitochondria copy number
At the baseline and end of treatment, peripheral blood mitochondria copy numbers were 1,298.3 copies/mL and 2,944.1 copies/mL in the monotherapy group and 1,437.2 copies/mL and 2,320.8 copies/mL in the combination therapy group, respectively, but no statistical significance was found in both groups (P=0.7351).
Results of safety analysis
The most frequently reported adverse effects occurred during the study period were fatigue, skin rash, and indigestion. During 12-months, the numbers of adverse events in monotherapy group and combination therapy group were 22 and 35, respectively. Among them only six cases were highly suggested having causal relationship with medication. Indigestion, skin rash, and drowsiness were the frequent adverse events of the medication. However, the prevalence of each symptom was not statistically significant (Table 3). Rest of symptoms did not seem to have causal relation with medication. The prevalence of fatigue, general weakness, chronic gastritis, and upper respiratory infection, has not related with treatment (P=0.2573).
DISCUSSION
In this study, the ALT normalization rate of Godex® and entecavir co-administration was significantly higher than those of monotherapy group at the time of 3, 6, 12 months after treatment.
The normalization rate of serum ALT level was higher and the average value of serum ALT was lower in the combination therapy group of CHB patients. Mean ALT level of 12-month were 25.1┬▒15.0 in the monotherapy group and 13.6┬▒5.1 in the combination therapy group, which showed the significant difference between two groups (P<0.0001). Such difference was more evident when the ALT level was higher at the point of the commencement of treatment. In this study, the ALT normalization rate at the time of 12-month dosing was high at 85.7% even in the entecavir monotherapy group which is the result similar to those of existing studies. However, if the ALT level was over 200 U/L at the time of treatment, the ALT normalization rate during the monotherapy was low at 53.9% and 69.2% at the time of 3-month and 12-month treatment, respectively. On the other hand, if the ALT level was over 200 IU/L before treatment, the ALT normalization rate during the combination therapy group was significantly high at 88.2% and 100% at the time of 3-month and 12-month treatment, respectively. Our study showed ALT normalization rate was nearly 100% at 6 months. That means that at six month combination treatment will have beneficial effects in case of high ALT patients.
It is known that the administration of carnitine influences the activation of lymphocyte.12 Carnitine regulates the production of prostaglandin E1 and E2 to control the functions of lymphocyte.12 Hao et al also reported that a diet containing carnitine improved the functions of lymphocyte of type II diabetic patients.13-14 This study was aimed to identify the effects of Godex® co-administration on an immune reaction. It is known that if the virus concentration of CHB patients is high, the 'anergy' occurs that slows down the T-cell function.15 In this study, patients' lymphocyte was stimulated using hepatitis B virus surface antigen in order to evaluate the T-cell's function. Amount of lymphocyte interferon-γ secretion was not different between two groups at the end of 12 months. However, interferon-γ secretion was significantly increased only in combination group comparing to baseline (P=0.030). Such results were consistent with those of preceding studies which reported that the administration of Godex® including carnitine affected the regulation of an immune reaction. However, HBeAg seroclearance and seroconversion rate after 12-month treatment showed no statistical difference between the monotherapy group and combination therapy group. The reason of discrepancy between changes of INF-γ secretion and seroclearance rate is not clear. These mean that immune reaction shows no statistical significance between two groups. Significant INF-γ secretion increase was shown in mono-therapy arm within-group comparison, but INF-γ secretion was not different between two arms at the end of study. Other researches on Godex's potential to regulate the immune reaction also reported that biphenyl dimethyl dicarboxylate (DDB) containing Godex® suppressed the reproduction and activation of hepatitis B virus by stimulating the interferon alpha route.16 But according to this study, there was no difference in the virus concentration in serum between the monotherapy group and combination group.
In conclusion, co-treatment of entecavir and Godex® to CHB patients can improve the ALT normalization rate, and especially when the ALT level was over 200 U/L before treatment, the normalization rate of liver inflammation level was higher.


 PDF Links
 PubReader
 ePub Link
 Full text via DOI
 Full text via PMC
 Download Citation
 Print
Print