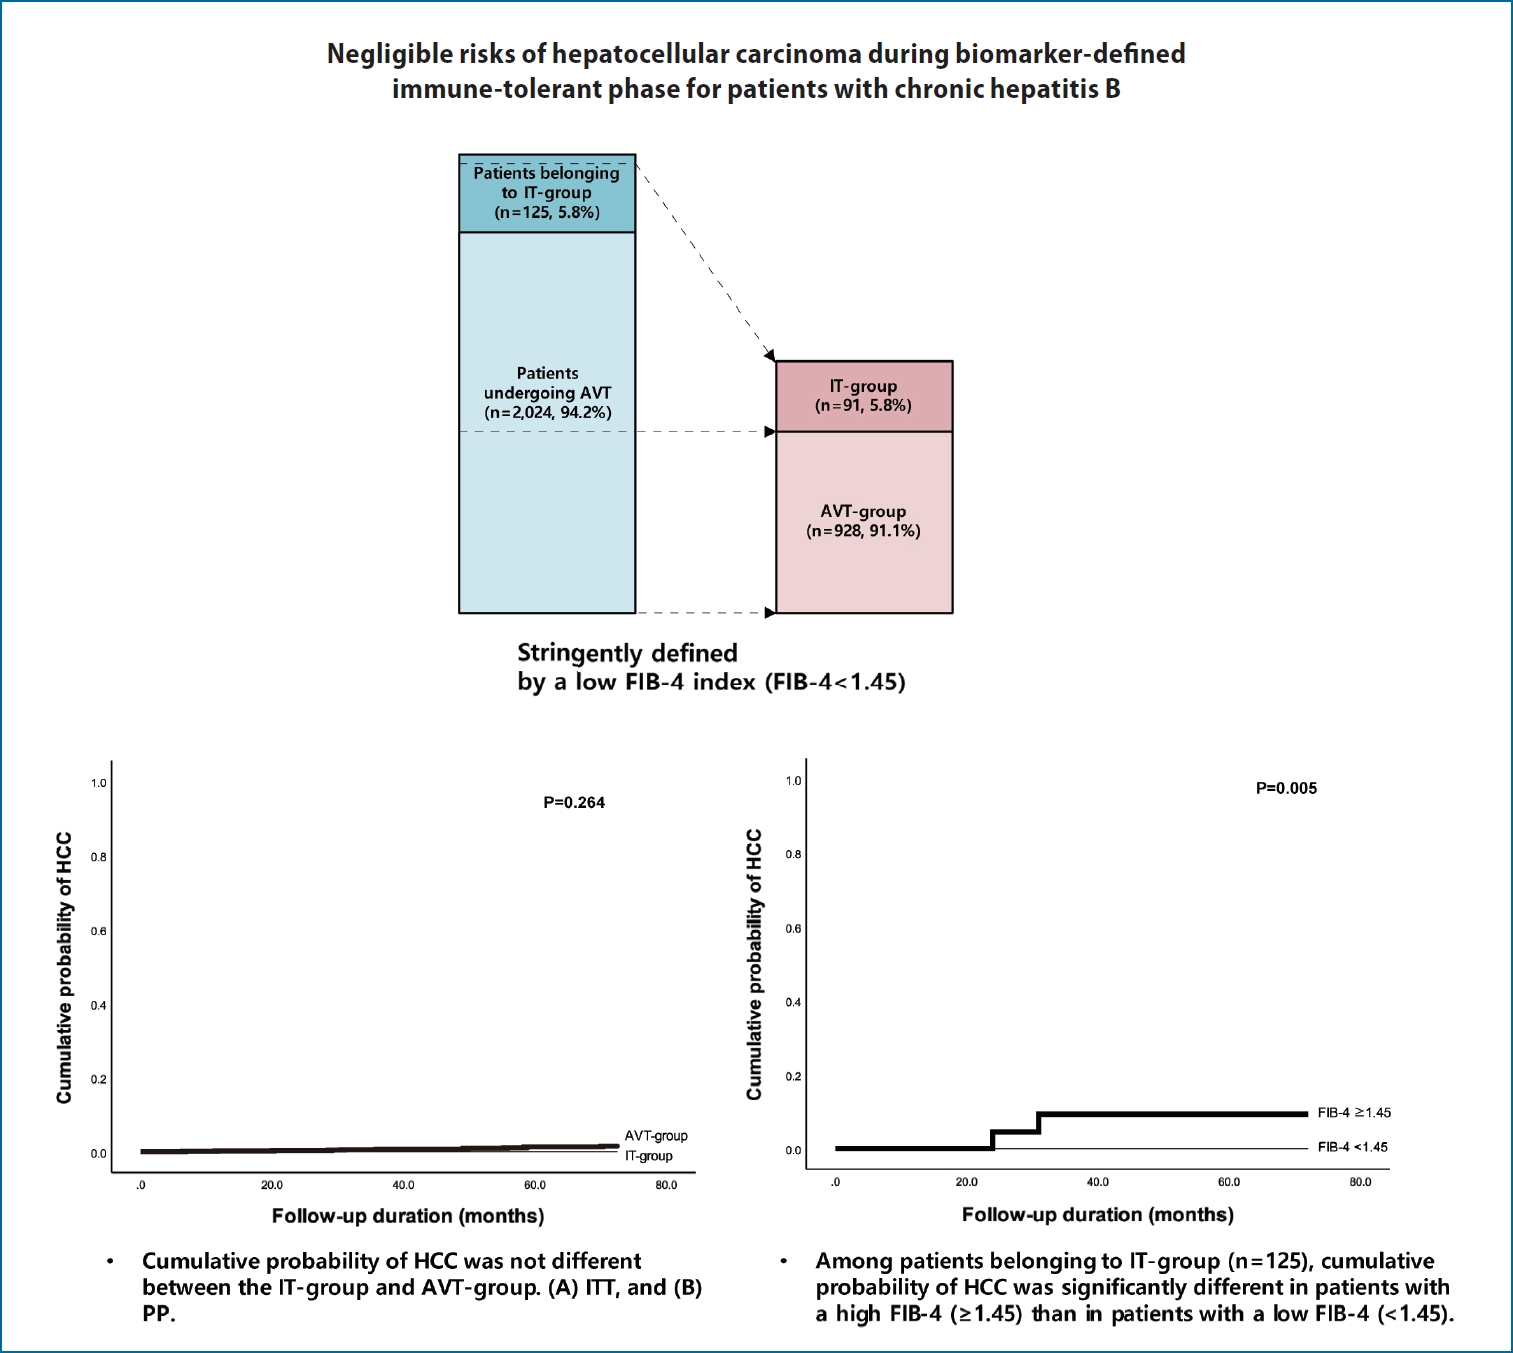
Negligible risks of hepatocellular carcinoma during biomarker-defined immune-tolerant phase for patients with chronic hepatitis B
Article information

Abstract
Background/Aims
The immune-tolerant (IT) phase of chronic hepatitis B (CHB) patients is not generally indicative of antiviral therapy (AVT). We assessed and compared the risk of hepatocellular carcinoma (HCC) during the IT-phase stringently defined by a low fibrosis-4 (FIB-4) index, compared to that in patients undergoing AVT.
Methods
Among 125 untreated patients that were hepatitis B e-antigen positive, hepatitis B virus-DNA >20,000 IU/mL, with normal alanine aminotransferase level from 2012 to 2018, those with a FIB-4 index of <1.45 were classified into the IT-group. The cumulative probability of HCC was estimated using Kaplan-Meier analysis. All patients were assessed until HCC development (intention-to-treat [ITT] analysis), whereas those suspected of experiencing CHB phase switch were assessed using the per-protocol (PP) and censored at the time of phase switch.
Results
The cumulative probability of HCC at 1-, 3-, and 5-years among the IT-group was zero, compared to AVT-treated patients with FIB-4 indices <1.45 during the same period: 0.2%, 0.6%, and 1.4%, respectively (P=0.264 for ITT and P=0.533 for PP). Among the initially screened 125 untreated patients, those with a FIB-4 index of ≥1.45 had a higher risk of HCC compared to the IT-group (P=0.005). Furthermore, among AVT-treated patients, those with a FIB-4 index of ≥1.45 had a higher risk of HCC compared to their counterpart (P<0.001).
Conclusions
The risk of HCC was negligible in the IT-group stringently defined by a low FIB-4 index. However, given that a higher HCC risk exists among untreated patients with higher FIB-4, appropriate criteria for AVT should be established.
Graphical Abstract
INTRODUCTION
Chronic hepatitis B (CHB) can lead to a range of diseases from asymptomatic status to the development of liver cirrhosis or hepatocellular carcinoma (HCC). Elevated serum levels of hepatitis B virus (HBV)-DNA are associated with an increased risk of this spectrum of diseases [1-4]. Long-term suppression of HBV-DNA using potent nucleos(t)ide analogues (NA) with high genetic barriers is required to reduce the risk of disease progression in CHB patients who are in the hepatitis B e-antigen (HBeAg)-positive or HBeAg-negative immune-active (IA)-phase [5-9].
Chronic HBV infection has been divided into several phases, including immune-tolerant (IT)-phase, immune inactive (IIA)-phase, and an IA-phase, which requires antiviral therapy (AVT) [5,10,11]. Of these, the IT-phase, also known as HBeAg-positive chronic HBV infection, is characterized by the presence of HBeAg, high levels of HBV-DNA (>106–107 IU/mL), a normal range of alanine aminotransferase (ALT) levels, and minimal or no necroinflammation. Thus, in spite of the high viral load, AVT is not generally recommended for patients with IT-phase due to the low risk of disease progression and HCC development [5,10-12].
However, several studies have suggested the possibility of immune responses for patients with IT-phase, proposing the risk of hepatocarcinogenesis [2,13-16]. The high level of HBV-DNA integration and clonal hepatocyte expansion observed during the IT-phase demonstrated that it may be an early stage in which high replicative and low inflammatory activities occur, suggesting HCC risk and disease progression [13]. In addition, a recent study by Kim et al. [17] suggested that earlier AVT might be required for a certain proportion of patients with IT-phase, based on the results that the untreated patients with IT-phase that lasted for at least 1 year showed an increased risk of HCC, and mortality or liver transplantation, compared with patients treated using AVT. However, in this study, patients that had IT-phase for 1-year, were selected regardless of the phase afterwards, which might result in the heterogeneity of the population with IT-phase. Therefore, it has not been fully confirmed whether the long-term outcomes of patients with IT-phase are unfavorable [12,18,19]. Furthermore, a recent multicenter study reported contradictory results that the risk of HCC development is extremely low in patients with CHB in IT-phase [20].
Thus, we aimed to compare the risk between patients developing HCC in the IT-phase and those undergoing AVT through intention-to-treat (ITT) and per-protocol (PP) analyses. In addition, we investigated whether the HCC development could differ depending on the fibrosis-4 (FIB-4) index, an indicative marker of potential liver damage and fibrosis, among both untreated patients with IT-phase and those undergoing AVT for chronic HBV infection.
MATERIALS AND METHODS
Patient’s eligibility
For the current study, consecutive CHB patients were recruited from 2012 to 2018. Infection was considered as CHB for patients who tested positive for the hepatitis B s antigen for more than 6 months [5,11]. Among untreated patients with positive HBeAg, HBV-DNA levels were >20,000 IU/mL with normal ALT levels (untreated patients belonging to the IT-phase) [5,10,11], we defined a subgroup with an FIB-4 index of <1.45 as belonging to IT-phase (IT-group) [21], considering their minimal fibrotic burden and excellent prognosis. ALT levels of <40 IU/L were defined as normal according to clinical guidelines developed by the Korean Association for the Study of the Liver (KASL) [5,11]. Patients undergoing AVT included those who had already received AVT during enrollment or those who had begun AVT within three months according to the treatment guidelines developed by KASL [11], and the reimbursement guidelines of the national health insurance program of the Republic of Korea. Likewise, among patients undergoing AVT, we defined a subgroup with a FIB-4 index of <1.45 as the AVT-group.
Exclusion criteria included the following: 1) untreated minimal active status or IIA-phase [22,23]; 2) negative for hepatitis e-antigen; 3) liver cirrhosis; 4) co-infection with hepatitis C virus; 5) prior history of decompensation, HCC, or liver transplantation; 6) significant alcohol consumption (daily intake of more than 60 g of alcohol in men and 20 g of alcohol in women) [24,25]; 7) development of HCC within 6 months after enrollment; and 8) follow-up duration of <12 months (Supplementary Fig. 1). Cirrhosis was defined as the presence of a coarse liver echo texture or nodular liver surface on sonography. Fatty liver was also diagnosed using sonography. FIB-4 index was calculated using the following formula: [age (years) × aspartate aminotransferase (AST; IU/L)] / [platelet (109/L) × ALT (IU/L)1/2]. Among the cutoff values suggested in previous studies, we used 1.45 as the cutoff for FIB-4 index [21,26].
The study protocol was in accordance with the ethics guidelines of the 1975 Declaration of Helsinki and the study was approved by the Institutional Review Board of Severance Hospital. Informed consent from patients was waived due to the retrospective nature of this cohort study.
CHB phase switch among patients with IT-phase
Although the majority of the IT-group were expected to maintain a virological phase during the course of the study period, a phase switch from IT-phase into IA-phase requiring AVT, IIA-phase, or minimally active CHB phase might have been experienced. A phase switch was confirmed when the pre-switch phase lasted for at least 6 months. HCC development was monitored using ITT analysis, whereas PP analysis was used for patients who experienced a phase switch and were censored at the time of phase switch during the follow-up period.
Follow-up assessments and the primary end-point
Patients received regular assessments of serum aminotransferase, serologic markers (e.g., HBeAg and anti-HBe), HBV-DNA levels, alpha-fetoprotein, and sonography every 3–6 months [11]. The follow-up periods for each patient were calculated from the date of enrollment to the date of developing HCC, and mortality.
The cumulative probabilities of HCC and Cox proportional hazard ratio were calculated during the follow-up period. The diagnosis of HCC was based on typical features of nodules (>1 cm) with arterial enhancement and a portal/delayed phase washout through dynamic computed tomography and/or magnetic resonance images, as well as elevated tumor marker, and/or histological examination [11].
Statistical analysis
Baseline characteristics are expressed as the median (interquartile range [IQR]) or number (%) as appropriate. The Mann-Whitney test or chi-squared test (Fisher’s exact test) was used to compare characteristics between two groups. In addition, the Cox proportional hazard model was used for uni- and multivariate analyses.
Cumulative probabilities of HCC development were estimated using the Kaplan-Meier method. A value of P<0.05 was an indication of statistical significance. Multivariate analysis was performed using variables with a P-value of <0.1 in univariate analysis. Data was analyzed using the statistical package for the social sciences (SPSS) ver. 25.0 for Windows (IBM Corp., Armonk, NY, USA).
RESULTS
Baseline characteristics of the entire study population
Based on enrollment criteria, a total of 2,149 patients were finally analyzed. The baseline characteristics of the study population are summarized in Table 1. The median age of the entire study population was 46.7 (IQR, 36.2–55.6) years and 887 (41.3%) of the patients were male. When initially screened, 125 (5.8%) untreated patients with positive HBeAg, HBV-DNA levels of >20,000 IU/mL with normal ALT levels (untreated patients belonging to the IT-phase), were compared with 2,024 (94.2%) patients undergoing AVT. The former was significantly younger (median 38.6 vs. 47.2 years; P<0.05) and more likely to be male than the latter (61.6% vs. 40.0%; P<0.05). The proportion of diabetes mellitus was significantly lower in untreated patients belonging to IT-phase than those undergoing AVT (5.6% vs. 12.9%; P<0.001). In addition, the untreated patients belonging to the IT-phase had significantly higher platelet counts (median, 210 vs. 193 ×109/L), higher serum albumin level (median, 4.4 vs. 4.2 g/L), lower AST (median, 23 vs. 44 IU/L) and ALT levels (median, 23 vs. 53 IU/L), and higher HBV-DNA level (median, 8.04 vs. 5.10 log IU/mL) than the patients undergoing AVT (all P<0.05).
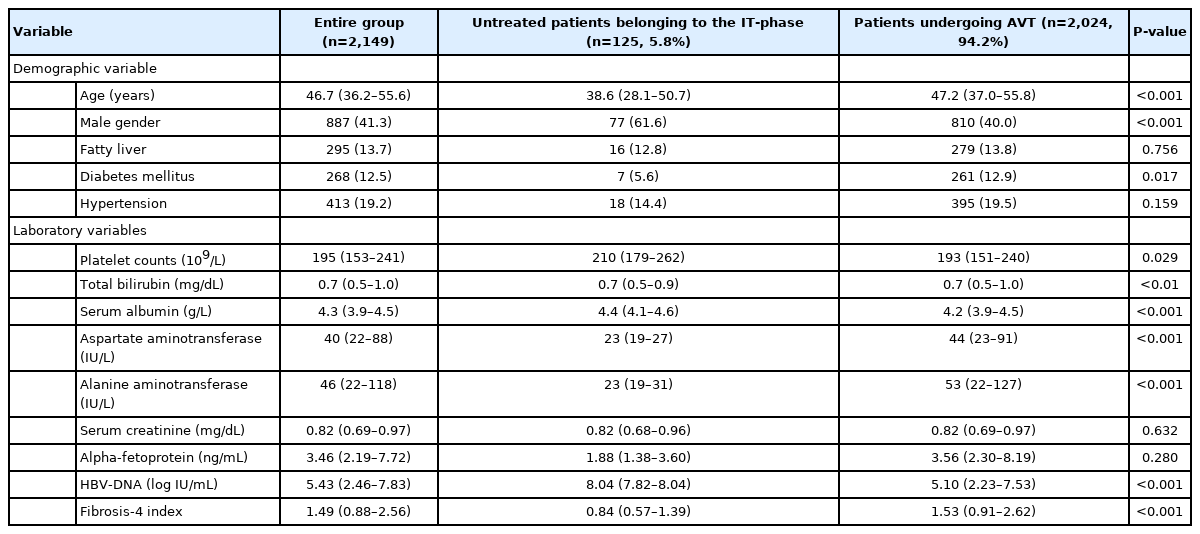
Baseline characteristics in entire cohort
Among untreated patients belonging to the IT-phase, 63.2% of patients who were in the IT-phase at enrollment experienced a phase switch into the IA-phase during the follow-up period. The median follow-up period of the entire study population was 59.4 months (IQR, 30.9–93.0) (86.7 [IQR, 55.8–11.07] in untreated patients belonging to the IT-phase and 57.8 [IQR, 30.3–91.3] in patients undergoing AVT, respectively).
Baseline characteristics of the subgroups with FIB-4 <1.45
Among untreated patients belonging to the IT-phase and those undergoing AVT, we identified the IT-group and AVT-group using FIB-4 index <1.45. We also compared the baseline characteristics of the IT-group and AVT-group including, age, gender, the presence of diabetes mellitus, serum albumin, AST, ALT, and HBV-DNA level which were significantly different between the IT-group and the AVT-group (P<0.05) (Table 2).
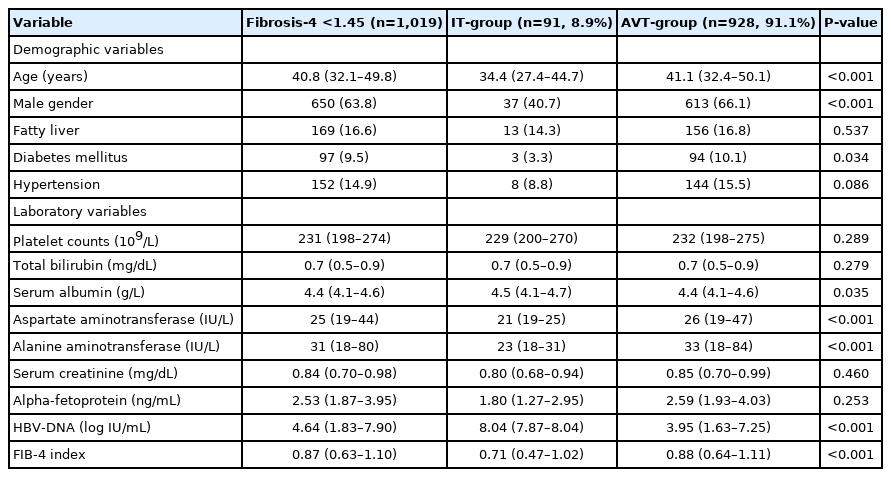
Baseline characteristics and comparison between patients with IT-phase and those undergoing AVT stringently defined by FIB-4 <1.45
Independent predictors of HCC in patients with FIB-4 <1.45
Univariate analysis indicated that older age significantly affected HCC development (P=0.019). However, overall the AVT-group (vs. IT-group) were not significantly associated with the risk of HCC development (P=0.471). Multivariate using these variables, showed that older age was a significantly independent predictor of HCC (Table 3). By contrast, another multivariate analysis showed age, male gender, the presence of diabetes mellitus, low platelet counts, and low albumin level as independent predictors of HCC development in the subgroup with FIB-4 >1.45 (Supplementary Table 1).

Independent predictors of HCC in subgroup with FIB-4 <1.45 (n=1,019)
Cumulative probabilities of HCC
According to ITT and PP analysis, the cumulative probability of HCC at 1-, 3-, and 5-years were 0.2%, 0.6%, and 1.4% in the AVT-group, respectively, whereas the cumulative probability of HCC was zero in IT-group at the respective years. However, the cumulative probability for HCC development was not statistically different between the IT-group and AVT-group ITT and PP analysis (P>0.05) (Fig. 1).

Cumulative probability of HCC for the IT-group and AVT-group. (A) ITT analysis and (B) PP analysis. HCC, hepatocellular carcinoma; AVT, antiviral therapy; IT, immune-tolerant; ITT, intention-to-treat; PP, per-protocol.
Among the untreated patients belonging to the the IT-phase, the cumulative probability of HCC in those with FIB-4 ≥1.45 were significantly higher than those with FIB-4 <1.45 (P=0.005) (Fig. 2). In these patients, the cumulative probability of HCC was zero for the subgroup with FIB-4 <1.45, whereas, 0.0% at 1-year, 6.0% at 3 years, and 6.0% at 5 years was recorded for patients with FIB-4 ≥1.45, respectively.
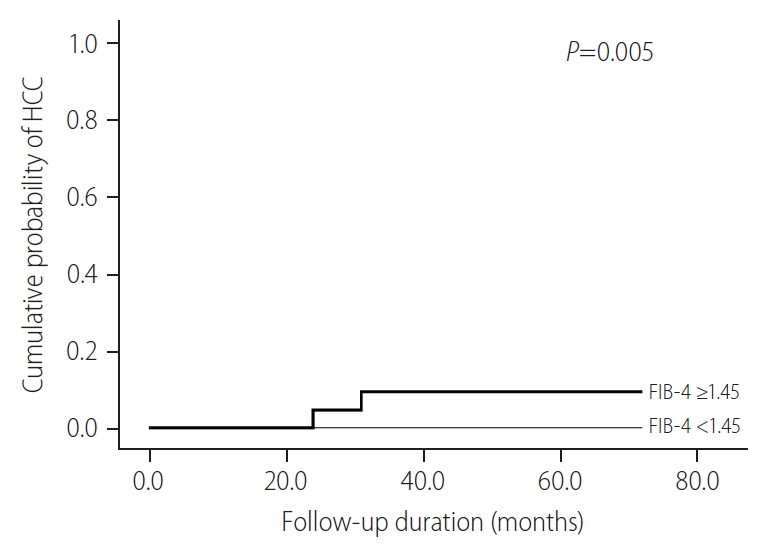
Cumulative probability of HCC according to FIB-4 scores for untreated patients belonging to IT-phase. HCC, hepatocellular carcinoma; FIB-4, fibrosis-4; IT, immune-tolerant.
Among patients undergoing AVT, the subgroup with FIB-4 ≥1.45 were at a significantly higher risk of HCC compared to those with FIB-4 <1.45 (P<0.001) (Fig. 3). We presented the cumulative probabilities of the following three groups in Supplementary Figure 2; IT-group (n=91), AVT-group (n=928) (stringently defined by a low FIB-4 index), and patients undergoing AVT with high FIB-4 (n=1,052) (overall P<0.001). In addition, the cumulative probabilities of HCC development were not significantly different, when we further categorized the subjects into three groups according to their HBV-DNA levels; patients with HBV-DNA level of <20,000 IU/mL, 20,000–10,000,000 IU/mL, and >10,000,000 IU/mL (overall P=0.852) (Supplementary Fig. 3).

Cumulative probability of HCC according to FIB-4 scores for patients undergoing AVT. HCC, hepatocellular carcinoma; FIB-4, fibrosis-4; AVT, antiviral therapy.
Distribution of FIB-4 scores in untreated patients belonging to the IT-phase and those underoing AVT
Among the untreated patients belonging to the IT-phase, the patients with HCC development showed a higher distribution of FIB-4 scores than those without HCC development (P=0.195) (Fig. 4A). Furthermore, among the patients undergoing AVT, patients with HCC development had a significantly higher distribution of FIB-4 scores than those without HCC development (P=0.003) (Fig. 4B).
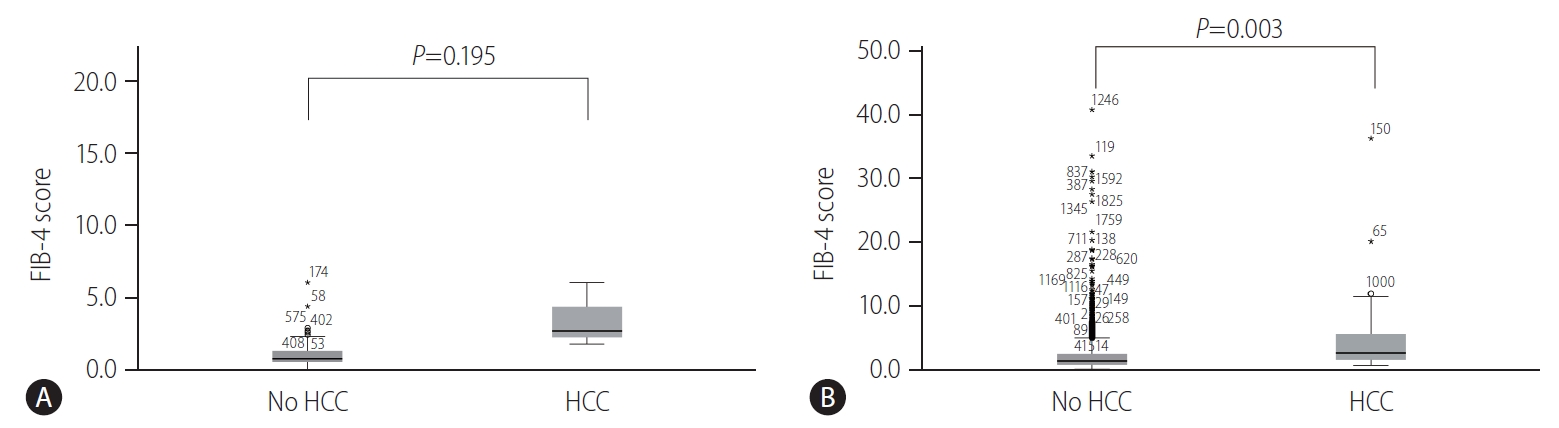
Distribution of FIB-4 score depending on HCC development among patients belonging to the IT-phase (A) and those undergoing AVT (B). FIB-4, fibrosis-4; HCC, hepatocellular carcinoma; IT, immune-tolerant; AVT, antiviral therapy.
DISCUSSION
According to the American Association for the Study of Liver Diseases (AASLD), the European Association for the Study of the Liver, or KASL guidelines, the IT-phase is indicated by presence of serum HBeAg, elevated HBV-DNA levels (typically >1 milion IU/mL), normal ALT level (<30–40 IU/L for males and <19–40 IU/mL for females), and/or biopsies without signs of inflammation or fibrosis [5,10,11]. All these guidelines advise against starting AVT for patients in the IT-phase of CHB.
A recent study insisted that earlier AVT intervention may reduce the risk of liver fibrosis and disease progression in patients in the IT-phase based on the findings of higher incidences of liver-related events in untreated patients when compared to patients undergoing AVT [13,17,27]. In contrast, another large multicenter study showed that CHB patients in the IT-phase had an extremely low incidence of HCC development, even though patients experienced phase switchs that may have potentiallly increased the risk of HCC development during the long-term [20]. Furthermore, a clinical trial where tenofovir disoproxil fumarate (TDF) and TDF plus emtricitabine was administed to patients for 4 years showed a high rate of relapse after NA cessation in patients in the IT-phase, and their natural history, such as their HBeAg seroconversion rates, did not change [28]. That is, there were still unresolved issues such as a potential harm, medical cost, and long-term safety of drug uses, as well as a lack of evidence indicating that AVT in patients in the IT-phase is beneficial in reducing rates of liver-related events.
In our study, after excluding the patients with cirrhosis or a FIB-4 score of ≥1.45 (a high risk of liver-related events), the cumulative probability of HCC development in the IT-group was lower than that of the AVT-group, but the difference was not statistically significant. These findings suggest that early AVT intervention to prevent disease progression should be carefully weighed for untreated patients usually referred as IT-phase without significant fibrosis, because the clinical evidence of liver disease progression can not be established in these patients. Furthermore, early AVT intervention might raise challenges such as the socioeconomic burden and unintended risks of adverse influences of AVT such as bone loss or renal insufficiencies [29]. In addition, we identified the low risk of HCC development in patients undergoing AVT without significant liver fibrosis, which is supported by recent studies [30].
Our study had several advantages that strengthen its clinical implications. First, our study focused on long-term prognosis during the period of IT-phase. The cumulative probability of HCC development had no significant difference between the IT-group and AVT-group, irrespective of ITT or PP analysis. The conflicting results from a previous study [17] showed favorable clinical outcomes for patients undergoing AVT compared to untreated CHB patients. Therefore, it would be premature to affirm a high risk of disease progression and the need for early AVT intervention in patients with IT-phase.
Second, in the comparison of subgroups according to the FIB-4 index, no one experienced HCC development in the IT-group, whereas three patients developed HCC in the FIB-4 ≥1.45 among untreated patients belonging to the IT-phase. This result indicates that if patients have a higher fibrotic burden, even though patients are expected to have a low risk of necroinflammation, the risk of HCC development might be increased. However, it is difficult to determine whether inflammation or fibrosis in the liver indicates potent disease progression [17]. Persistently normal ALT levels which are required to determine the IT-phase are not always consistent with signs of fibrosis or inflammation [2,14,31]. Thus, when we are uncertain if patients in the IT-phase require treatment or not. However, other assessments for fibrosis, such as the FIB-4 score or pathology tests may allow for detection of advanced fibrosis for early AVT intervention [5,10]. It is thus not confirmed whether AVT should be started at the time of phase switch or whether AVT should be considered earlier for patients who are anticipated to experience a phase switch or disease progression. In addition, future studies should focus on establishing the criteria for selecting the optimal candidates for early AVT intervention among untreated patients belonging to IT-phase.
Thirdly, our study had a relatively long-term follow-up period (median, 59.4; IQR, 30.9–93.0 months). This might have increased the statistical influence of our study and enabled us to investigate and compare long-term outcomes of patients with IT-phase to that of patients undergoing AVT. However, because the sample size of the untreated patients belonging to the IT-phase was small, a large multicenter study is warranted to validate our results.
We are also aware of several limitations in our study. First, because no histological information was available, there is a possibility that some patients with significant fibrosis or inflammation might have been incorporated with the untreated patients belonging to the IT-phase in our study. Despite this pitfall, after excluding patients with a higher fibrotic burden, there was no evidence of HCC development in the IT-group during follow-up period. Thus, if patients with little fibrosis were selected, a more favorable long-term prognosis would have been anticipated, which might support our results.
Secondly, we selected untreated patients who had various ranges from very high levels of HBV-DNA to ≥20,000 IU/mL according to guidelines [5,10,11]. It is known that levels of >6–8 log IU/mL of HBV-DNA are considered a lower risk of HCC, while levels of HBV-DNA above 20,000 IU/mL might suggest a higher risk of HCC [32]. In our study, we used the cutoff value of 20,000 IU/mL to categorize groups. Nevertheless, the risks of HCC development was not significantly different between the IT-group and AVT-group. Thus, it is hypothesized that if we used higher HBV-DNA levels as the cutoff value to define the IT-phase, the long-term prognosis of patients with IT-phase would become favorable. Therefore, further large-scale studies are required to determine the association between viral titer concentrations and the risks of liver-related events.
Third, similar to HBV-DNA levels, we used 40 IU/L as the ALT cutoff value to define the IT-phase for patients. However, the overall similar results were maintained when we used cutoff values defined by AASLD (<30 IU/L for men and <19 IU/L for women) and KASL (<34 IU/L for men and <30 IU/L for women), respectively (data not shown). Because serum levels of ALT and necroinflammatory activity of liver disease are not always associated [2,14], some patients requiring AVT might have been incorporated into IT-group [33]. This issue signifies that another surrogate factor other than 40 IU/L to define the IT-phase is required in real practice.
In conclusion, our study showed that after excluding patients with an FIB-4 score of ≥1.45, the risk of HCC development was not significantly different between the IT-group and AVT-group. However, there were no events of HCC in the IT-group stringently defined by a lower FIB-4 index. Thus, early AVT intervention should be cautiously considered for this group, especially if patients have been expected of a low fibrotic burden. However, in the absence of solid criteria to signify an IT-phase in patients without histology, the optimal criteria required to select an appropriate candidate for early AVT intervention for patients with IT-phase who would be at increasing risk of HCC should be investigated in further large-scale, well-designed studies.
Notes
Authors’ contribution
S.U. Kim and B.K. Kim designed this study. M.Y. Jeon, S.U. Kim, and B.K. Kim carried out the data analysis and interpretation, and wrote the manuscript. J.Y. Park, D.Y. Kim, S.H. Ahn, K.H. Han contributed to inclusion of patients, acquisition and analysis of data. All authors contributed to the interpretation of results, critical revision of the manuscript and approved the final manuscript. S.U. Kim and B.K. Kim are the guarantors.
Conflicts of Interest: The authors have no conflicts to disclose.
Acknowledgements
This study was supported by the National Research Foundation of Korea (NRF) grant funded by the Korea government (MSIT) (No. 2019R1A2C4070136). The funders had no role in the study design, data collection and analysis, decision to publish, or preparation of the manuscript.
Abbreviations
AASLD
American Association for the Study of Liver Diseases
ALT
alanine aminotransferase
AST
aspartate aminotransferase
AVT
antiviral therapy
CHB
chronic hepatitis B
FIB-4
fibrosis-4
HBeAg
hepatitis B e-antigen
HBV
hepatitis B virus
HCC
hepatocellular carcinoma
IA
immune-active
IIA
immune inactive
IQR
interquartile range
IT
immune-tolerant
ITT
intention-to-treat
KASL
Korean Association for the Study of the Liver
NA
nucleos(t)ide analogues
PP
perprotocol
TDF
tenofovir disoproxil fumarate
SUPPLEMENTAL MATERIAL
Supplementary material is available at Clinical and Molecular Hepatology website (http://www.e-cmh.org).
Independent predictors of HCC in subgroup with FIB-4 >1.45 (n=1,130)
Flowchart of study population. In consecutive patients with chronic hepatitis B between 2007 and 2018, untreated patients belonging to the IT phase and those undergoing AVT were enrolled according to the inclusion criteria. A subgroup of patients with FIB-4 score <1.45 in those in the IT phase was defined as the IT group, whereas that of patients with FIB-4 score <1.45 in those undergoing AVT was defined as the AVT-group. IIA, immune-inactive; HCC, hepatocellular carcinoma; IT, immune-tolerant; AVT, antiviral therapy; FIB-4, fibrosis-4.
We divided with the subjects into three groups; IT-group (n=91), AVT-group (n=928) (both groups stringently defined by a low FIB-4 index), and patients undergoing AVT with high FIB-4 (n=1,052). The cumulative probabilities of HCC development were not significantly different between these groups (overall P<0.001). HCC, hepatocellular carcinoma; IT, immune-tolerant; AVT, antiviral therapy; FIB-4, fibrosis-4.
We categorized the subjects into the following three groups; patients with <20,000 IU/mL, 20,000–10,000,000 IU/mL, <10,000,000 IU/mL of HBV-DNA level. The cumulative probabilities of HCC development were not significantly different between these groups (overall P=0.852). HCC, hepatocellular carcinoma; AVT, antiviral therapy; FIB-4, fibrosis-4; IT, immune-tolerant; HBV, hepatitis B virus.
References
Article information Continued
Notes
Study Highlights
Several studies have suggested a possibility of disease progression in CHB patients within the IT phase, who are not generally indicative of AVT. This study showed negligible risk of HCC in IT phase patients with a pre-defined low FIB-4 index, thus, an early antiviral intervention should be carefully considered for appropriate candidates.