Current consensus and guidelines of contrast enhanced ultrasound for the characterization of focal liver lesions
Article information
Abstract
The application of ultrasound contrast agents (UCAs) is considered essential when evaluating focal liver lesions (FLLs) using ultrasonography (US). Microbubble UCAs are easy to use and robust; their use poses no risk of nephrotoxicity and requires no ionizing radiation. The unique features of contrast enhanced US (CEUS) are not only noninvasiveness but also real-time assessing of liver perfusion throughout the vascular phases. The later feature has led to dramatic improvement in the diagnostic accuracy of US for detection and characterization of FLLs as well as the guidance to therapeutic procedures and evaluation of response to treatment. This article describes the current consensus and guidelines for the use of UCAs for the FLLs that are commonly encountered in US. After a brief description of the bases of different CEUS techniques, contrast-enhancement patterns of different types of benign and malignant FLLs and other clinical applications are described and discussed on the basis of our experience and the literature data.
INTRODUCTION
Grayscale ultrasonography (US) and Doppler US are widely used in the detection and differentiation of focal liver lesions (FLLs) relying on the differences in echogenicity and vascularity between the FLLs and surrounding liver tissues. However, gray-scale US and Doppler US lack specificity in the characterization of FLLs. Contrast-enhanced US (CEUS) can achieve dynamic images throughout the vascular phases of the liver which lead to great advances in diagnostic accuracy of US. CEUS can be used routinely for lesions detected incidentally on conventional US, and used to clarify obscure lesions detected on computed tomography (CT) or magnetic resonance imaging (MRI). Real-time assessments of a FLL can be performed during at least 3-4 minutes using specific imaging methods based on contrast agents. The enhancement patterns depend on the microvascularization of the FLLs, and the characteristics of lesion scan be assessed based on three vascular phases: the arterial, portal venous (PV), and late phases.
There are two UCAs, Sonovue® and Sonazoid®, clinically used for liver images. Sonovue is strictly intravascular, whereas CT/MRI contrast agents also diffuse into the interstitial space.1 This is why there are a few differences during the arterial and PV phases in the behaviors of UCAs and CT/MRI contrast agents, which are otherwise very similar.2,3 Whereas, Sonazoid is cleared by Kupffer cells. Uptake of Sonazoid perfluorobutane microbubbles by the Kupper cells makes post vascular images (Kupffer phase images) similar to that of gadolinium ethoxybenzyl-diethylenetriamine-enhanced MRI. The recent introduction of UCA for Kupffer cell imaging has dramatically expanded the application of liver US.4
CEUS is much more useful than CT/MRI in differentiating FLLs, and this cost-effective methodology also avoids the ionizing radiation used in CT5-7 and has no severe adverse effects (the UCAs do not induce allergic reactions and are not excreted through the kidneys). The most important difference from CT/MRI is that CEUS allows real-time evaluation of liver nodules and immediate results to be obtained, and consequently CEUS provides a significant improvement in clinical practice with an accurate diagnosis, in contrast to the inconclusive results obtained in traditional US.
US is the most popular tool for diagnosing FLLs in Korea, especially in private clinics. Also, the expanding CEUS indications for FLLs make this technique an important tool in the assessment of vascularization, including evaluations for the detailed diagnosis of FLLs. The use of CEUS is already permitted by the Committee for New Health Technology Assessment in Korea,8 but appropriate guidelines have not yet been published. Consistent with the current situation of CEUS in Korea, the KASCU (Korean Association for the Study of Contrast Enhanced Ultrasonography) had final consensus meeting on 19 Jan 2013 in Daegu, Korea. We present current consensus and guidelines of CEUS for the Characterization of FLLs in this review.
UCAs and safety issues
The use of UCAs was first described in the aorta during cardiac catheterization by Gramiak and Shah in 1968.9 Those UCAs were composed of bubbles without a shell and were large enough to be filtered by the lungs, so they disappeared within a few seconds after intravenous injection. There have been various attempts to overcome these shortcomings. Current UCAs are typically microbubbles encapsulated by a stabilizing shell such as albumin, polymer, or phospholipid. Microbubbles are miniature gas bubbles smaller than red blood cells (up to 7 µm in diameter) so that they easily pass through the capillary beds, thereby acting as bloodpool tracers based on using ultrasound signals back scattered from tissue to determine the US echogenicity.10
The mid-1990s saw the development of Levovist® (Schering, Berlin, Germany) as a first-generation air-based UCA with galactose and palmitic acid as a surfactant, with a mean of 2-5 µm in microbubble diameter.11,12 After intravenous injection, the pharmacokinetic behavior of Levovist can be divided into a vascular phase and a delayed parenchymal phase.13 Its prolonged liver-specific phase is advantageous for distinguishing FLLs,12,14 but it is unsuitable for real-time applications, requiring a high mechanical index (MI) that destroys the microbubbles.15 Levovist production has ceased and it is no longer marketed.16
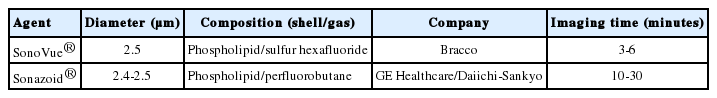
In order to overcome the disadvantages of UCAs such as Levovist, second-generation UCAs were designed both to improve the US echogenicity and to last for longer periods in the bloodstream with low solubility. These features of microbubbles make stable nonlinear oscillations possible with a low MI, resulting in real-time harmonic signals.17 The UCAs for the liver currently available in Korea are SonoVue® (Bracco, Milan, Italy) and Sonazoid® (Daiichi-Sankyo, GE Tokyo, Japan) (Table 1).16
Ultrasound contrast agents available for clinical use in Korea
SonoVue has a phospholipid shell and a sulfur hexafluoride gas core and is available for liver studies in several countries.16 It has enabled real-time imaging using a nondestructive low MI, offering vascular-phase imaging (i.e., in the arterial, PV, and delayed phases) of the lesion for several minutes.18,19 Sonazoid is composed of perfluorobutane microbubbles with a phospholipid shell.16 It provides detailed perfusion features of the FLLs during the vascular phase, as well as late Kupffer phase images.20
Microbubbles are partly removed by metabolism in the liver (stabilizing shells) and partly eliminated from the lungs (with air or other gases) during the breathing process. This pharmacokinetics can be safely administrated without risk of nephrotoxicity.10 These features mean that regular laboratory tests are not required before administration.16
UCAs are very well tolerated and have a good safety profile.21 The very rare cause of serious adverse events associated with the use of SonoVue is an anaphylactoid reaction, but the incidence of this phenomenon has been lower than those when using other imaging contrast agents for X-ray imaging and CT.22 Also, UCAs can be used in patients with iodine allergy or renal dysfunction.23 However, there are scarce data on situations involving pregnancy, breastfeeding, and young children.24
UCAs are generally safe in clinical practice, but clinicians should pay careful attention to patients with severe heart problems, and its use should be avoided 1 day prior to extracorporeal shockwave therapy.16
CEUS imaging protocols and devices
Mechanical Index (MI)
The MI of an ultrasound system is an estimate of the maximum amplitude of the pressure pulse in tissue, which reflects the power of the system. The MI is related to the amount of mechanical work that can be performed on a bubble during a single negative half cycle of the ultrasound waveform,11 and is thought to reflect the probability of inducing cavitation in the medium. In very simple terms, a higher MI tends to correspond to the emission of a higher acoustic pressure and consequently to more rapid disruption of microbubbles. In physical terms, the MI is defined as

where PNP is the peak negative pressure of the ultrasound wave and Fc is the center frequency of the ultrasound signal (in MHz). A low-MI is usually chosen for continuous real-time imaging in order to minimize microbubble destruction. MI of ≤0.3 is considered to be low, but most systems work optimally with MI far below 0.3. For example, 0.06 is selected as an optimal MI for SonoVue according to manufacturer's recommendations when using the iU22 ultrasound system, and 0.2 is recommended for Sonazoid when using the Logiq 7 device (Table 2). However, the MI can be optimized according to contrast agents, ultrasound systems, and the characteristics of the liver in a given patient.
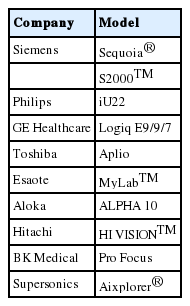
Ultrasound devices available in 2012 that provide contrast-specific imaging
Nonlinear echoes, harmonic imaging, and pulse-inversion imaging
Because it is difficult to trace microbubbles when they are present at a low concentration in tissues using conventional B-mode ultrasound, many investigators have attempted to use the physical characteristics of microbubbles to enhance the ultrasound signal. Harmonic imaging is a good representative example.
The excitation of the bubbles by ultrasound waves will result in their radii changing in sympathy with the oscillation of the incident sound.25 That is, a bubble compressed by an ultrasound pressure wave will become stiffer and hence resist a further reduction in its radius. Conversely, the bubble becomes less stiff in the rarefaction phase of the ultrasound pulse and the bubble becomes less stiff, therefore enlarging more. These radial oscillations have a natural frequency at which they will both absorb and scatter ultrasound with a particularly high efficiency. If resonant bubbles are driven by an ultrasound signal with a sufficiently high acoustic pressure, the oscillatory excursions of each bubble reach a point where the alternative expansions and contractions of the bubble's size are not equal. The consequence of such nonlinear motion is that the sound emitted by the bubble and detected by the transducer contains harmonics. Key factors in the harmonic response of an agent are the incidence pressure of the ultrasound field, the ultrasound frequency, the size distribution of the bubbles, and the mechanical properties of the bubbles' shells (e.g., a stiff shell will dampen the oscillations and attenuate its nonlinear response). A Doppler-based imaging method based on this phenomenon, called harmonic imaging,26 is widely available in modern ultrasound scanners. Such systems operating in harmonic mode are configured to receive echoes preferentially at double the transmitted frequency, which is where the echoes from the bubbles will be maximal.
However, there were at least two problems with the early methods of harmonic imaging: (1) the splitting of the band width of the transducer had the effect of decreasing the imaging resolution, and (2) when the received echo is weak, the overlapping region between the transmit and receive frequencies becomes a larger portion of the entire received signal, and so that the contrast in the harmonic image varies with the echo strength from the bubbles. Pulse inversion (also known as phase inversion) imaging overcomes these limitations of harmonic imaging and provides greater sensitivity, thus allowing a lower incident power and nondestructive, continuous imaging of microbubbles in organs such as the liver. This has led to pulse-inversion imaging becoming the most common technique. The basic principle of pulse-inversion imaging is the summation of two echoes: (1) a pulse of sound is transmitted into the body and echoes are received from the contrast agent and the tissue, and (2) a second pulse that is an inverted copy of the first one is then transmitted in the same direction. Linear tissue echoes will nullify each other, while nonlinear microbubble echoes produce a detectable signal. The microbubble echoes are distorted copies of each other, so that the even nonlinear components of these echoes will reinforce each other when summed, producing a strong harmonic signal.27 This method can produce detectable signals even when using a low-MI, which means that bubbles are not destroyed, allowing continuous real-time US with high spatial resolution and sensitivity.
Practical imaging technique
In general, any US imaging investigation should start with conventional B-mode and Doppler techniques. After the target lesion has been identified, the transducer is held motionless while the scanner is switched to low-MI contrast-specific imaging. A dual-screen format showing a low-MI B-mode image alongside the contrast-only display provides improved anatomic guidance, which is especially useful for small lesions to ensure that the target is kept within the field of view during the examination.
Contrast agent is administered as a bolus injection within 2 seconds, followed by flushing with 10 mL of normal saline. Ideally, the diameter of the venous line should not be smaller than 20 gauge to avoid destruction of microbubbles during their injection. However, central line and port systems can be used as long as there is no filter present, but the contrast agent will arrive sooner. A stop clock should be started at the time when contrast agent is injected. Because of the dynamic nature of real-time CEUS, video sequences should be recorded of each vascular phase, with the arterial and PV phases being assessed without interruption. After injection, the arterial phase is started within 10-20 seconds and ended within 25-35 seconds, the PV phase is begun within 30-45 seconds and finished within 120 seconds, and the late phase is initiated after 120 seconds and ends with the disappearance of the bubbles, which typically occurs about 5 minutes after injection. For the late phase, intermittent scanning may be used until the contrast agent disappears from the hepatic microvasculature.16 Sonazoid, which is stable for at least 60 minutes postinjection, can be employed in Kupffer phase imaging after the end of the late phase because Sonazoid microbubbles are phagocytosed by Kupffer cells.
Devices
Recent advancements in CEUS technology have resulted in new devices for contrast-specific imaging emerging on the market. The ultrasound devices that provide contrast-specific imaging are listed in Table 2.
Detection and characterization of FLLs
The late phase is the most important of all three vascular phases. It is because benign and malignant lesions can be differentiated in the late phase, with malignancy manifesting as hypovascularity in this phase.1 This is the most specific finding of malignancy, since benign liver lesions exhibit isoechogenicity or even hyperechogenicity relative to the surrounding liver parenchyma.10,28,29 In this section we briefly describe the characteristics and differentiation points of several representative benign and malignant FLLs.
Benign FFLs
Hemangioma
Hemangioma of the liver is the most common benign liver tumor.30 It is considered to be a developmental malformation that is usually of no clinical significance.
In B-mode images the appearance of these lesions can be categorized based on their size: lesions smaller than 2 cm tend to be universally echogenic, those size of 2-5 cm are mainly echogenic, while those larger than 5 cm exhibit a pattern of mixed echogenicity.31 Color-Doppler ultrasound imaging has no specific finding for hemangioma and hence has no significant utility in its diagnosis.32
CEUS is very useful in the diagnosis of hepatic hemangioma, since perfusion through lesion can be observed in real time and is very similar to the perfusion pattern found on CT scans. The typical CEUS findings of liver hemangiomas are peripheral nodular enhancement (74%) in the arterial phase and complete (78%) or incomplete (22%) centripetal filling in the PV and late phases.30 This process usually takes approximately 1 minute, but can take 3-5 minutes, so it may be useful to stop scanning after 1 minute in order to avoid microbubble destruction, and then return every 30 seconds to observe this slow filling. Eventually, in the late phase, the lesion fills and retains contrast agent, which makes it disappear into the liver background. Often there is incomplete late filling, especially with larger hemangiomas, which has been attributed to focal scarring or hemorrhagic regions in the mass. The combination of an enhancement pattern comprising "peripheral nodular arterial enhancement" and "complete PV fill-in" yielded a sensitivity of 98% for histologically proven hemangiomas (Fig. 1).30 In the DEGUM multicenter trial33 the specific diagnostic rate for 242 hemangiomas was 82.2% on the basis of these "classic" CEUS findings. Atypical features can be found in both small (15-40 mm) and large (>4 cm) hemangiomas, and high-flow hemangiomas show rapid enhancement in the arterial phase, though still with the peripheral nodular pattern (observations in slow motion may be needed to confirm this) and they appear to be markedly hypervascular, sometimes demonstrating abundant arterioportovenous shunts.30 If the nodular pattern and the centripetal flow direction are not recognized, high-flow hemangiomas can be mistaken for hepatocellular carcinomas (HCCs) or focal nodular hyperplasia (FNH). CEUS is useful in identifying most liver hemangiomas, but MRI can be complementary to CEUS in uncertain cases, especially in patients with suspected metastatic disease. Nevertheless, biopsy and histological examinations are still mandatory for determining the appropriate therapy in these patients.34

Contrast-enhanced ultrasonography (CEUS) (A) and dynamic liver computed tomography (CT) (B) findings of hemangioma according to the vascular enhancement phase. The enhancement patterns are similar in CEUS and CT, with peripheral nodular enhancement in the arterial phase and gradual filling of the entire mass with contrast agent as time passes.
Focal Nodular Hyperplasia (FNH)
FNH is the next most common benign liver tumor after hemangioma.35 It is considered to be a congenital vascular malformation and in most cases it is a single lesion, but it can also present with multiple liver lesions. FNH can be divided into two groups according to the vascular patterns: classical and telangiectatic FNH.36 Classical FNH is considered as a hyperplastic or regenerative response to hyperperfusion through anomalous arteries located in the center of these lesions.37 Typical histological findings of classical FNH are a central stellate scar containing a large artery with multiple vessel branches radiating through the fibrous septae toward the lesion periphery.38 Non-classical variants often do not show these typical signs on US or histology-the central scar is mostly missing and they lack nodular architectures. Telangiectatic FNH seems to have a higher risk of bleeding, like an adenoma.39
FNH normally appears hyperechogenic in B-mode images, and color- and power Doppler images show the spoke-wheel sign pathognomonic of classical FNH, with often a feeding vessel being evident.40 Most cases of classical FNH can be diagnosed using only a combination of B-mode and color-Doppler ultrasound. However, even these classical signs can sometimes be lacking for anatomic or technical reasons, and moreover malignant tumors can present with the spoke-wheel sign.
Typical CEUS findings of FNH include strong hyperperfusion from a large, tortuous feeding artery in the arterial phase, from the center to outwards, producing a spoke-wheel appearance (Fig. 2).41 This finding is much more convincingly demonstrated in CEUS than in color-Doppler imaging. The centrifugal filling may be rapid and hence easily missed unless the early filling phases are reviewed carefully in slow motion. After a few seconds the lesion is filled with contrast agent and is usually more enhanced than the surrounding liver (the "lightbulb" sign). The perfusion pattern in the late phase is mostly hyper-or isoechoic. A washout phenomenon can sometimes be observed in the late phase due to bubble destruction (caused by a prolonged examination) or degenerative metamorphosis, especially in patients older than 35 years, and it can confuse the differential diagnosis with malignant liver lesions.
CEUS (A) and magnetic resonance imaging (MRI) with Primovist® enhancement (B) findings for focal nodular hyperplasia (FNH) according to the vascular enhancement phase. CEUS shows that the feeding vessel presents with a spoke-wheel appearance with rapid centrifugal filling by the contrast agent as time passes. In MRI images the same lesion shows slightly low signal intensity at pre and T1, is isointense to slightly hyperintense at T2, and exhibits normal Primovist uptake in the 20-minute delayed image.
Hepatic adenoma
The hepatic adenoma is a rare benign liver tumor whose diagnosis is important due to the possibility of severe complications, including bleeding of the liver tumor with rupture into the peritoneum.42 Most (70-80%) hepatic adenomas are solitary lesions,43 and can occur in thin-walled capillaries perfused by the arterial pressure. Adenomas lack a PV supply and are fed solely by arterial vessels. The tumor capsule is usually missing or incomplete. Moreover, adenomas show peliotic sinusoids and no scar tissue, which predisposes them to intralesional hemorrhage.43
The characteristic B-mode finding of hepatic adenoma is hyperechoic, hypoechoic, or isoechoic heterogeneity.43,44 Intralesional hemorrhage initially shows hypoechoic and then later echogenic signals from affected regions inside the liver adenoma. Color-Doppler ultrasound is usually not very helpful to the diagnosis because there is no typical pattern in this imaging modality.
In CEUS, hepatic adenoma shows a rapid large enhancement in the arterial phase. The enhancement pattern is centripetal, filling from the periphery toward the center. This large enhancement in the arterial phase is caused by the multiple thin arteries, and the vessel density appears to be higher in the periphery of the adenoma. This pattern in the arterial phase can appear very rapidly, and so the analysis of slow-motion video sequences or an additional computer-based perfusion analysis of the liver adenoma might be helpful in some cases. In the late phase an adenoma shows a gradual washout phenomenon due to missing portal veins, but in some cases sinusoids can also cause a prolonged bubble signal.44 The hemorrhagic regions are avascular and do not show enhancement in any phase.
The enhancement patterns of an adenoma can be variable and confused to malignancy. A basic rule is that its diagnosis should be considered whenever a vascular FLL with atypical late-phase enhancement is found, especially in young women.
Hepatic cystic lesions
Hepatic cystic lesions such as simple, hemorrhagic, or hydatid cysts have a characteristic appearance of clearly defined perfusion defects in CEUS throughout the vascular phases.45,46 In cases of neoplastic cysts such as cystic metastasis or biliary cystic neoplasm, CEUS is suitable for clear differentiation by the demonstration of vascular flow within the septa or solid component.47
Fat disposition and sparing
Fat disposition and sparing in the liver can be easily recognized by the morphology and typical location of these processes, which is adjacent to the falciform ligament, portal vein, and gallbladder. In CEUS, fat disposition and sparing present a characteristic finding of isoenhancement throughout the vascular phases, and the lack of a mass effect is useful for differentiation from hypervascular tumors.46
The typical morphology includes a geographic margin with no mass effect or undisturbed vessels traversing through the lesion.47 However, this lesion can be atypical in location, with occasionally an aberrant vein into the lesion being directly observable.48
Abscess
The appearance of a liver abscess in conventional ultrasound varies from anechoic to hyperechoic, which can result in abscesses appearing completely solid. Liver abscesses show variable degrees of liquefaction. These necrotic cavities have sharply defined regions with no uptake of contrast agent in the contrast phase. The periphery of the abscesses shows arterial rim enhancement with rapid washout and hypoechogenicity against the surrounding liver during the late phase.49
Malignant FLLs
HCC
A diagnosis of HCC is based on histologic examination or on clinico-radiologic criteria of early enhancement followed by late washout on dynamic liver imaging modalities such as CT or MRI in conjunction with elevated serum alpha-fetoprotein according to the guidelines of the Korean Liver Cancer Study Group.50 CEUS has been included in important guidelines and recommendations, such as those from the American Association for the Study of Liver Diseases (AASLD) in 2005,51 the APASL (Asian Pacific Association for the Study of the Liver),52 the Japanese Society of Hepatology,53 and the EFSUMB (European Federation of Societies for Ultrasound in Medicine and Biology) guidelines in 200454 and 2008.55 However, CEUS no longer appears in the diagnostic flow chart of nodules in cirrhosis in the AASLD guidelines updated in 2011,56 for two quoted reasons: (1)"CEUS may offer false-positive HCC diagnosis in patients with cholangiocarcinoma, and thus has been dropped from the diagnostic techniques"and (2)"CEUS is not available in the USA, so these results are not entirely applicable to a North American population." This removal was controversial and was not well received in Europe and Asia.57
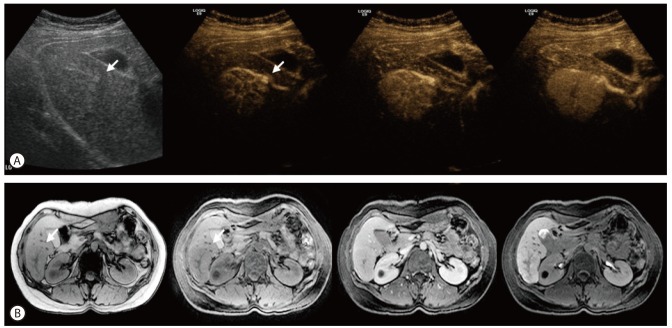
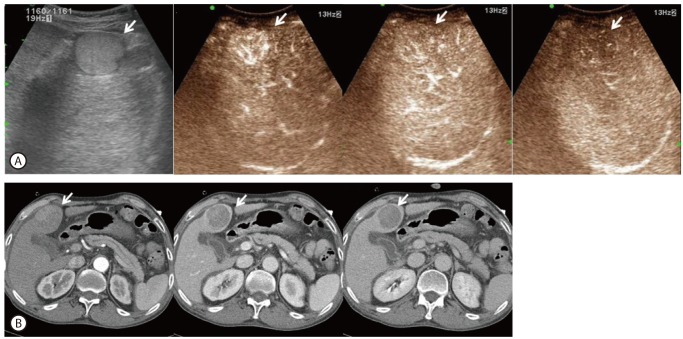
The sonographic appearance of HCC varies depending on the differentiation of the tumor and the presence of intra-tumoral fatty change, necrosis, and fibrosis. CEUS allows the reliable detection of arterial neo-angiogenesis associated with HCC. Typical HCCs are supplied by abnormal arteries alone and show positive enhancement (hypervascularity) during the arterial phase and negative enhancement (washout) during the PV phase (Fig. 3).29,58-60 Detection of arterial-phase hypervascularity is the most reliable characteristic of HCC.61 The typical vascular pattern in HCC is a high and rapid enhancement in the arterial phase.62,63 The detection of a peritumoral signal in the early arterial phase, and chaotic and centripetal intra-tumoral contrast enhancement in the arterial phase followed by rapid washout with a hypoechoic appearance in the PV and late phases are characteristics of HCC.64 However, a small subset of atypical HCC cases shows no arterial-phase hypervascularity.60 The enhancement of HCC is related to the degree of cellular differentiation. Early HCC or well-differentiated HCC have variable degrees of arterial and PV supply, which make the diagnosis difficult. Well-differentiated tumors are less likely to show arterial enhancement and also more likely to be isoenhancing in the late phase,60 while moderately or poorly differentiated tumors have fast contrast-agent washout and appear hypoechoic in the PV or the late phase.65 Negative enhancement or washout during the PV phase is also an important typical characteristic of HCC, which is due to a decreased PV supply. However, washout of HCC in the PV phase is generally slower and smaller than that of metastases.66,67 Therefore, performing an extended evaluation for 4-5 minutes is important to characterizing HCC by demonstrating eventual washout. Sustained enhancement (no washout) in the extended PV phase should not be considered diagnostic of a benign lesion, especially in patients at risk of HCC, since it may occur especially in HCC with well-differentiated histologic differentiation. The advantage of CEUS in the diagnosis of FLLs is the ability to observe changes in the enhancement pattern in real time. Some HCCs do not show an enhancement pattern in CT, but this is made possible by the real-time detection ability of CEUS (Fig. 4).
Typical enhancement patterns of hepatocellular carcinoma (HCC) in CEUS (A) and CT (B). Grayscale US scan showing a well-demarcated round mass with a heterogeneous hypoechoic density. CEUS scan in which the mass shows a hyperechoic density in the arterial phase. The mass shows wash out in the portal venous (PV) phase and a hypoechoic density in the late phase. The mass shows heterogeneous enhancement in the arterial phase on CT. The mass shows a slightly hypoechoic density in the PV phase and a delayed washout pattern. The arrow in each panel indicates the mass.

Small HCC in real-time CEUS (A) and CT (B). The mass shows an early enhancement pattern in the arterial phase on CEUS. The mass shows an early washout pattern in the PV phase and a delayed washout in the late phase. The small HCC does not show enhancement in arterial phase on CT. The mass shows an early washout pattern in PV phase and a continued washout pattern in delayed phase. The arrow in each panel indicates the mass.
Sonazoid has an additional post-vascular (or Kupffer) phase that begins 10 minutes after injection and lasts for 1 hour or more. Kupper phase enhancements provide important information regarding the lesion, since HCCs are hypoenhancing while most benign lesions are iso- or hyperenhancing.55,68-71
Regenerative nodules (RN) and dysplastic nodules (DN) usually contain normal hepatic arteries and portal veins within the lesion, but usually do not show any early contrast-agent uptake, and show the enhancement pattern of normal liver parenchyma. Most RNs and DNs are isoechoic during all phases in CEUS, although they may show transient hypovascularity in the arterial phase. The characteristics of RNs, DNs, and HCCs are summarized in Tables 3 and 4.

Characteristics of benign lesions in contrast-enhanced ultrasonography (CEUS)
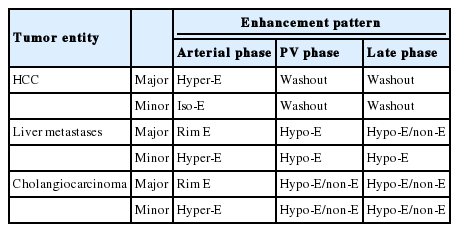
Characteristics of malignant lesions of the liver in CEUS
CEUS allows accurate differentiation between malignant and nonmalignant portal-vein thrombosis. Malignant thrombosis of the portal vein shows the typical features of HCC with rapid enhancement and linear, irregular feeding vessels in the arterial phase, due to the presence of hypervascular tumor tissue, whereas benign thrombosis demonstrates no enhancement.72,73
The algorithm used to diagnose a liver mass is summarized in Fig. 5.

Algorithm used to diagnose a liver mass.
Cholangiocarcinoma
Peripheral cholangiocarcinoma arises from intrahepatic ducts beyond the secondary confluence. The appearance of intrahepatic cholangiocarcinoma on grayscale ultrasound is nonspecific. Small lesions are usually hypo- or isoechoic relative to the surrounding parenchyma, but larger lesions can be heterogeneous. Because most cholangiocarcinomas are hypovascular tumors, the enhancement pattern is similar to that of a metastatic liver cancer on CEUS, so an absence of enhancement is the most common finding in the arterial phase.74 However, approximately 30% of cholangiocarcinomas are hypervascular and show enhancement in the arterial phase. Recent studies have typically found 70% to 90% of cholangiocarcinomas to be hypervascular in arterial-phase CEUS; furthermore, 50% of these showed diffuse enhancement in the arterial phase.75,76 A tumor size of smaller than 3 cm was an important factor for these enhancement patterns, and this was also found in a study applying dynamic CT scans for cholangiocarcinomas in the cirrhotic liver.77 Rim enhancement is usually detected during the arterial and PV phases.78 The most frequent feature in the late phase is the presence of intratumoral hypoechogenicity. However, CT and CEUS observations differ substantially in terms of the behavior of cholangiocarcinomas in the late phase: delayed-phase CT can observe a prolonged enhancement due to the presence of fibrous stroma, while hypoechogenicity appears in late-phase CEUS.74,76
Metastatic liver cancer
Most metastatic liver cancer is hypovascular and is characterized by hypervascularity in the tumor periphery, where tumor cells are abundant. Only 10% to 15% of metastases are hypervascular.74 The appearance of metastatic liver cancer in grayscale ultrasound varies. On CEUS, metastases typically exhibit peripheral enhancement beginning in the arterial and late phases. However, metastatic liver cancer shows various contrast enhancement patterns during the arterial phase, ranging from absence to rim-like or diffuse enhancement. A study using low-MI imaging with second-generation contrast agents observed rim-like peripheral enhancement in 47 of 89 metastases, with 53% of these 47 lesions preceded by diffuse contrast enhancement.29 The diffusely enhancing metastases appeared hyperechoic 20-30 seconds after the injection, with peripheral hyperechoic rim-enhancement at 30-60 seconds after the injection in most cases. In contrast to hypovascular metastases, an early strong enhancement is detected in cases of hypervascular metastases. Depending on the vascularity of the lesion, the rim may be thin or thick, or the entire lesion may show intense enhancement during the arterial phase. This rim-like peripheral enhancement must be distinguished from nodular enhancement, which is typical of liver hemangiomas.
Rim enhancement during the arterial and PV phases is a valuable finding for the characterization of metastases, but the most characteristic feature of metastases is the presence of hypoechogenicity in the late vascular and parenchymal phases relative to the surrounding liver. This enhancement pattern is comparable to that seen in dynamic CT scanning, and helps in the differentiation from other benign hypervascular-like FNHs and some small hemangiomas.79 All of the metastases appear as large "enhancement defects" without a peripheral rim due to the rapid washout of contrast agent.12,80,81
Clinical applications in HCC treatment
In addition to the diagnosis of FLLs, CEUS can be used in the primary guidance and assessment of treatment responses in US-guided interventions such as liver biopsy or percutaneous local ablative treatment of both HCCs and metastases.82 CEUS is exceptionally useful due to its ability to visualize the target lesion when it is poorly delineated in B-mode grayscale US and CT guidance is not available.83 Pretreatment CEUS also helps planning the placement of the needle into the target lesion and ablation coverage by showing the exact boundary and the clear relationship with surrounding vascular structures.84 CEUS can be used to detect any viable tumors in immediate postablation assessments,85 and for the assessment of viable HCC treated with transarterial chemoembolization (TACE) by visualization of early enhancement in the arterial phase.86
Technical considerations
Contrast agent is usually administered within 2 seconds through a 20-gauge intravenous catheter and a three-way stopcock followed by flushing with 10 mL of saline. Due to the specific blood supply to the liver, three contrast phases can be differentiated. The arterial phase starts 10-20 seconds after injection and lasts for 25-35 seconds. This is followed by the PV phase, which extends from 30-45 seconds postinjection to 120 seconds. The subsequent last phase then ends with the disappearance of the bubble, which typically occurs about 5 minutes after injection.
As for conventional ultrasound, the sensitivity of CEUS is marked reduced in patients with severe steatosis and deep lesions. It is also impossible to investigate the whole liver with the same degree of sensitivity with CEUS. Furthermore, the arterial and PV phases cannot be simultaneously investigated for multiple lesions.87
In small lesions, the early arterial phase has to be studied carefully in order to detect rapid contrast-agent uptake and fast fill-in, with these being pathognomic for hemangiomas, and to differentiate them from FNHs, adenomas, HCCs, and metastases.88 Very small cysts not detected on conventional ultrasound and appearing hypoechoic in the late phase can be misinterpreted as small metastases; they must be confirmed with the aid of conventional ultrasound.88
Artifacts can lead to misinterpretation. Hypoechogenicity posterior to strongly enhanced lesions and structures can be observed. All vascular phases should be investigated. The application of this careful procedure improves the sensitivity from 78% to 98% in detection and characterization of FLLs relative to the evaluation of the late phase alone.89
Limitations
The factors that limit CEUS are similar to those of basic ultrasound techniques: patients with a poor acoustic window, obese patients, movement artifacts, and uncooperative patients.70 Focal lesions located deep within the liver were usually difficult to evaluate with CEUS, especially those that are deep-seated in a fatty liver more than 12 cm below the skin surface.70 Several problems are encountered when using CEUS to screen the whole liver in terms of convenience and cost-effective, because repeated injections of the contrast agent are needed to examine all of the level segments.90 However, the main limitations are the skill of the operator and the experience of the physician performing CEUS markedly influencing the diagnosis accuracy. Standardized and adequate training is needed to obtain optimal and reproducible results from CEUS. The capturing of video sequences for subsequent accurate evaluation of all the enhancement phases can help to resolve this problem, but this removes the advantages of a real-time capability.91 CEUS is no longer included as a method for the differentiation of nodules in the cirrhotic liver in the AASLD guidelines updated in 2011, but there is only one report supporting this decision, which is based on the possibility of CEUS producing false-positive HCC diagnoses in patients with cholangiocarcinoma.92 Hypervascular cholangiocarcinoma can show an enhancement pattern similar to that of HCC in the arterial phase. However, this usually manifests as early washout (before 60 seconds) in CEUS, and the median time of the onset of washout was reported to be 2 minutes in HCC.57,93 The value of CEUS in characterizing FLLs has been established by many studies.68,70,94 CEUS is now included in several Europe and Asian guidelines, but it has not obtained FDA approval in the United States.
Summary
CEUS can be used routinely for FLLs found incidentally on conventional US and to clarify obscure lesions detected on CT or MRI.
Benign and malignant lesions can be differentiated in the late phase. Malignancy manifests as hypovascularity in this phase, which is the most specific finding, while benign liver lesions show isoechogenicity or even hyperechogenicity relative to the surrounding liver parenchyma.
The typical CEUS finding of liver hemangiomas is peripheral nodular enhancement in the arterial phase and complete or incomplete centripetal filling in the PV and late phases.
Typical CEUS findings of FNH include strong hyperperfusion from a large tortuous feeding artery in the arterial phase, from the center to outwards, producing a spoke-wheel appearance. The perfusion pattern in the late phase is mostly hyper or isoechoic.
The enhancement patterns of an adenoma can be confusingly variable and suggest malignancy. A basic rule is that its diagnosis should be considered whenever a vascular FLL with late-phase enhancement is found.
Arterial-phase hypervascularity is the most reliable characteristic for detecting HCC. The typical vascular pattern in HCC is a high and rapid enhancement in the arterial phase, followed by rapid washout with a hypoechoic appearance in the PV and late phases. However, in a small subset of HCC cases the enhancement pattern differs with the degree of cellular differentiation.
Metastatic liver cancer and cholangiocarcinoma usually show characteristic enhancement patterns during the arterial phase, and this rim enhancement can be used to differentiate FLLs. Hypervascular liver metastases and hypervascular cholangiocarcinoma often appear with the same enhancement features as HCC during the arterial phase; however, very early washout is a critical consideration in the diagnosis of metastases or cholangiocarcinoma.
In addition to the diagnosis of FLLs, CEUS can be used in the primary guidance and assessment of treatment responses for HCC biopsies, radiofrequency ablation, and TACE.
Definitive CEUS enhancement patterns are usually difficult to obtain from FLLs that are not clearly demarcated in conventional ultrasound.
Operators need appropriate training and discussion with other examiners in order to ensure that the various enhancement patterns seen during CEUS of these lesions will result in the same correct diagnosis.
Future prospects
While CT or MRI findings are needed for a definitive final diagnosis in some cases, CEUS is a very useful diagnostic tool for the detection of FLLs. The evolution of imaging methods usually progresses in parallel with developments in other aspects of medical practice, and UCAs are improving alongside innovations in medical instrumentation. The resulting improvements in CEUS techniques have made it a very useful tool for satisfying future medical requirements; such are more accurate and faster diagnoses. In the era of targeted agent therapies for advanced-stage HCC, CEUS could play a key role in monitoring antiangiogenic treatments of HCC.68 Future studies should investigate the clinical applications of CEUS in detecting and quantifying posttherapy changes in tumor perfusion.95 Additionally, CEUS screening for HCC in patients with liver cirrhosis, drug delivery systems using contrast agents for the treatment of FLLs, analysis programs of hemodynamic states, and new novel contrast agents are also possible future directions.
Conclusions
The introduction of second generation UCAs microbubbles has allowed real-time imaging of FLLs in every phase of enhancement, which has dramatically improved the accuracy of US-based detection and characterization, as well as providing guidance to therapeutic procedures and evaluation of responses to treatment. CEUS can provide an accurate differentiation between benign and malignant liver nodules at the bedside, which is critical for the appropriate management of these patients. Moreover, recent development of improved strategies, which is currently investigating the individual kinetic responses to various contrast agents, can help maximizing the diagnostic efficacy of CEUS in near future.
Notes
All authors are member of KASCU (Korean Association for the Study of Contrast Enhanced Ultrasonography).
The authors have no conflicts to disclose.
Abbreviations
AASLD
American Association for the Study of Liver Diseases
APASL
Asian Pacific Association for the Study of the Liver
CEUS
contrast enhanced ultrasonography
CT
computed tomography
DN
dysplastic nodule
EFSUMB
European Federation of Societies for Ultrasound in Medicine and Biology
FNH
focal nodular hyperplasia
FLL
focal liver lesion
HCC
hepatocellular carcinoma
KASCU
Korean Association for the Study of Contrast Enhanced Ultrasonography
MRI
magnetic resonance imaging
MI
mechanical index
PV
portal venous
RN
regenerative nodule
US
ultrasonography