The usefulness of transient elastography, acoustic-radiation-force impulse elastography, and real-time elastography for the evaluation of liver fibrosis
Article information
Abstract
Background/Aims
Several noninvasive methods have recently been developed for the evaluation of liver fibrosis. The accuracy of transient elastography (TE), acoustic-radiation-force impulse (ARFI) elastography, and real-time elastography (RTE) in predicting liver fibrosis were evaluated.
Methods
Seventy-four patients who had undergone a liver biopsy within the previous 6 months were submitted to evaluation with TE, ARFI, and RTE on the same day.
Results
There were significant correlations between fibrosis stage and liver stiffness measurement (LSM) using the three tested methods: TE, r2=0.272, P=0.0002; ARFI, r2=0.225, P=0.0017; and RTE, r2=0.228, P=0.0015. The areas under the receiver operating characteristic curves (AUROC) for the diagnosis of significant fibrosis (≥F2, Metavir stage) by TE, ARFI, RTE, TE/platelet count (PLT), velocity of shear wave (Vs)/PLT, and elasticity score (Es)/PLT were 0.727, 0.715, 0.507, 0.876, 0.874, and 0.811, respectively. The AUROC for the diagnosis of cirrhosis by TE, ARFI, RTE, TE/PLT, Vs/PLT, and Es/PLT were 0.786, 0.807, 0.767, 0.836, 0.819, and 0.838, respectively. Comparisons of AUROC between all LSMs for predicting significant fibrosis (≥F2) produced the following results: TE vs. RTE, P=0.0069; ARFI vs. RTE, P=0.0277; and TE vs. ARFI, P=0.8836. Applying PLT, the ability of each LSM to predict fibrosis stage significantly increased: TE/PLT vs. TE, P=0.0004; Vs/PLT vs. ARFI, P=0.0022; and Es/PLT vs. RTE, P<0.0001. However, the ability to predict cirrhosis was not enhanced, combining LSM and PLT.
Conclusions
TE and ARFI may be better methods for predicting significant liver fibrosis than RTE. This predictive ability increased significantly when accounting for platelet count. However, all of the measures had comparable efficacies for predicting cirrhosis.
INTRODUCTION
Liver fibrosis is a product of liver cell injury and healing. The measurement of liver fibrosis is generally used for therapeutic decision or the prognosis of patients with chronic liver diseases.1,2 Therefore, the accurate staging of liver fibrosis is critical for both patients and physicians.
Although there have been many efforts for the direct or indirect measurement of liver fibrosis, liver biopsy is still considered as a gold standard method for the assessment of liver fibrosis.3 However, it has some disadvantages such as its invasiveness, serious complications, intra- and interobserver variability, and sampling errors.3-9 Therefore, non-invasive diagnostic tools such as direct fibrosis markers, biomolecular markers or liver stiffness measurement (LSM) have been developed as a substitute of liver biopsy. There are several ultrasound based elastography for the evaluation of liver fibrosis such as transient elastography (TE),10-12 acoustic radiation force impulse (ARFI)13-16 and real time elastography (RTE).17-21 TE is a method that concerns acquisition of pulse-echo ultrasound signals to measure liver stiffness. ARFI technology involves the mechanical excitation of tissue with the use of short duration acoustic pulses producing shear wave propagation away from the region of interest. RTE compares and analyze echo signals before and under slight compression to show the physical property of tissue with conventional ultrasound probes. However, the clinical usefulness of these utilities was not fully documented.
The aim of this study was to compare the accuracy of TE, ARFI and RTE, for the assessment of liver fibrosis in patients with chronic liver diseases. We also attempted to find out any clinical factor to improve the ability to estimate fibrosis.
PATIENTS AND METHODS
We consecutively enrolled 74 patients with various chronic liver diseases who underwent liver biopsy from October 2010 to March 2011 in Soon Chun Hyang University Bucheon Hospital.
Blood biochemistry was carried out at enrollment including aspartate aminotransferase (AST), alanine aminotransferase (ALT), albumin, total bilirubin, platelet count (PLT), prothrombin time (INR, international normalized ratio).
TE, ARFI and RTE were performed in each patient at the same day by an experienced physician. Within six months after liver biopsy, liver stiffness was also measured on the right lobe of the liver where liver biopsy had been performed. The staging of fibrosis from all biopsy specimens was interpreted by an experienced pathologist. Platelet count is known to predict liver fibrosis more accurately when it is combined with LSM.22 We defined TE/PLT as [kilopasckal (kPa)/PLT (×109/L)]×102 in TE, Vs/PLT as [velocity of shear wave (m/s)/PLT (×109/L)]×102 in ARFI, and Es/PLT as Es/PLT (×109/L)×102 in RTE. Informed written consent for enrolling the study of LSM was obtained from all patients. The study was approved by the ethics committee of our hospital.
Transient elastography
TE was carried out in all patients with a FibroScan® (ECHOSEN FIBROSCAN 502, Paris, France). Ten valid measurements were performed, and median of liver stiffness was calculated as described before with results expressed in kilopascals (kPa) in each patient.23 Only patients who had a success rate > 60%, with an interquartile range (IQR) < 30% were included in this study.
Acoustic radiation force impulse
ARFI was carried out in all patients with SIEMENS ACUSON S2000 ultrasound system. Liver stiffness was measured on right lobe of liver through intercostal space in left lateral decubitus position with the right arm in maximum abduction. The ultrasound probe automatically generates shear-waves which propagate into the liver. The propagation speed increases with fibrosis. The operator can select the depth at which the liver elasticity is evaluated by placing a "measuring box" (10 mm long and 5 mm wide) in the desired place. Its speed, being expressed in meters/second (m/s), is displayed on the screen. Ten valid measurements were performed in each patient, and median values were calculated. A measurement depth of 5 cm below the liver capsule was chosen to standardize the examination. Success of ARFI was judged by the same criteria as TE.
Real time elastography
RTE was carried out in all patients with HITACHI HI VISION-Preirus and EUP-L52 linear probe (3-7 MHz). Liver stiffness was measured in supine position with the right arm elevated above the head. After examination in B-mode, the mode was switched to elastography. The probe was placed on the right intercostal space, and scanned vertically from the epigastrium to observe a sagittal section of the right hepatic lobe. An identical area where the liver tissue was at least 6 cm thick and was free of large blood vessels was set as the region of interest (ROI) for all subjects. The colors in the ROI include the following: red (soft), blue (hard) and green (intermediate, normal). The degree of the hardness can be gained on the monitor in color by analyzing the relative hardness. The elasticity score was determined on a scale of 0 to 5. Ten valid measurements were performed in each patient, and median values were calculated.
Liver histology
Liver biopsy was performed in all 74 patients with sonographic guidance. Only liver specimens at least 2 cm in size were considered adequate for pathological interpretation. They were stained with hematoxylin and eosin, and reviewed blindly by an experienced pathologist.
Fibrosis staging was scored on an F0-F4 using the METAVIR scoring system: F0, no fibrosis; F1, portal fibrosis without septa; F2, portal fibrosis with few septa; F3, numerous septa without cirrhosis; and F4, cirrhosis.24
Statistical analysis
Statistical analysis was performed using Statistical Package for the Social Sciences version 14.0 (SPSS Inc., Chicago, IL, USA). We investigated clinical parameters to find out significant predictor for liver fibrosis. Significant factors remained in univariate analysis were entered into a multivariate analysis. Spearman's correlation analysis was used to assess relationships between LSM and liver fibrosis stage. The diagnostic performance of the non-invasive methods was assessed by area under the receiver operating characteristic (AUROC) curves. AUROC were built for the detection of significant fibrosis (F≥2) and cirrhosis (F4), respectively. An AUROC over 0.8 indicates an excellent diagnostic test, and an AUROC between 0.7 and 0.8 should be considered clinically useful. Optimal cut-off value used for the detection of significant fibrosis and cirrhosis were selected based on the sensitivity (Se), specificity (Sp), positive predictive value (PPV) and negative predictive value (NPV). Statistical analysis of the differences between AUROC curves was performed using MedCalc version 11.4 (MedCalc Software bvba, Mariakerke, Belgium) based on the theory of generalized U-statistics. The cut-off for statistical significance was set at P<0.05.
RESULTS
Characteristics of patients
Patient characteristics are summarized in Table 1. Our group included 74 patients (35 males and 39 females, mean age 47.3 years). The etiologies of chronic liver diseases were classified as follows: chronic viral hepatitis (n=49, 66%), alcoholic liver disease (n=3, 4%), nonalcoholic fatty liver disease (n=13, 18%), autoimmune hepatitis (n=2, 3%), toxic hepatitis (n=6, 8%), and unknown (n=1, 1%). The stage of fibrosis was as follows; 2 (2.7%) in F0, 15 (20.3%) in F1, 21 (28.4%) in F2, 15 (20.3%) in F3, 21 (28.4%) in F4. The patients having significant fibrosis (≥F2) was 57/74 (77%). The mean elapsed time from the liver biopsy to the onset of LSM was 3.1±1.8 months.

Baseline characteristics of the patients
Clinical parameters to predict liver fibrosis stage
All clinical factors were investigated to identify the relation with significant fibrosis stage (≥F2).
In univariate analysis, PLT and INR were closely associated with significant fibrosis. Adjusting with INR, PLT was only significant predictor for liver fibrosis (F2 or more) in this data (OR; 1.027, 95% confidence interval; 1.014 to 1.046, P-value <0.001) (Table 2).

Clinical parameters associated with significant liver fibrosis (≥F2, Metavir stage)
Correlation between liver stiffness measurements by TE, ARFI, RTE, TE/PLT, Vs/PLT and Es/PLT and fibrotic stage
Fig. 1 and 2 shows plots of TE values (Fig. 1A), ARFI (Fig. 1B), RTE (Fig. 1C), TE/PLT (Fig. 2A), Vs/PLT (Fig. 2B) and Es/PLT (Fig. 2C) according to METAVIR fibrosis stage. Strong correlations between LSM and fibrosis stage were found in TE (r2=0.272; P=0.0002), in ARFI (r2=0.225; P=0.0017), in RTE (r2=0.228; P=0.0015), in TE/PLT (r2=0.268; P=0.0003), in Vs/PLT (r2=0.336; P<0.0001), in Es/PLT (r2=0.336; P<0.0001). Although there was a significant correlation between all LSMs and fibrosis stage, especially TE and ARFI can better predict the fibrosis stage as compared to RTE. This predictive ability was enhanced when accounting for platelet count. The values of R2 to explain regression were increased when PLT was incorporated into LSM.
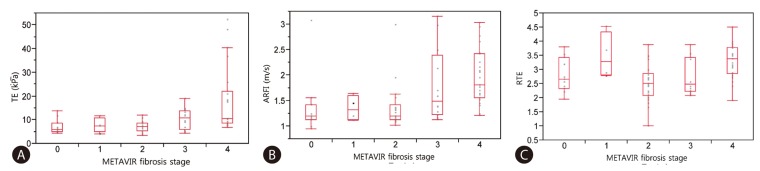
Correlation between LSMs and Metavir fibrosis stage (F0-F4), spearman correlation. (A) Transient elastography. (B) Acoustic radiation force impulse elastography. (C) Real time elastography.
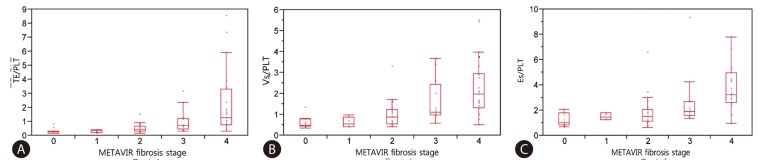
Correlation between LSMs/PLT and Metavir fibrosis stage (F0-F4), spearman correlation. (A) Transient lastography/Platelet count (TE/PLT). (B) Acoustic radiation force impulse elastography/Platelet count (Vs/PLT). (C) Real time elastography/Platelet count (Es/PLT).
AUROC analysis to predict significant fibrosis and cirrhosis
The diagnostic accuracy to predict significant fibrosis (≥F2) and cirrhosis (F4) was evaluated using ROC curve analysis. The cut-off values for the diagnosis of significant fibrosis (≥F2) were as follows; TE, 7.50 kPa (AUROC of 0.727, with a Se of 64.9%, Sp of 70.6%); ARFI, 1.19 m/s (AUROC of 0.715, with a Se of 78.9%, Sp of 58.8%); RTE, 2.54 (AUROC of 0.507, with a Se of 64.9%, Sp of 35.3%) (Table 3). Comparing with AUROC of each LSM for predicting significant fibrosis (≥F2), TE is superior to RTE (P=0.0069), ARFI to RTE (P=0.0277). However, TE is not significantly different with ARFI (P=0.8836) (Table 4). When incorporating PLT, the results of LSM/PLT were as follows; TE/PLT, 4.19 (AUROC of 0.876, with a Se of 77.2%, Sp of 88.2%); Vs/PLT, 0.80 (AUROC of 0.874, with a Se of 80.7%, Sp of 88.2%); Es/PLT, 1.42 (AUROC of 0.811, with a Se of 79.0%, Sp of 64.7%). LSM/PLT showed a better prediction for significant fibrosis than LSM alone; TE/PLT to TE (P=0.0004), Vs/PLT to ARFI (P=0.0022) and Es/PLT to RTE (P<0.0001) (Fig. 3A) (Table 4).

Comparisons of diagnostic performance for the prediction of significant fibrosis and cirrhosis between TE, ARFI, RTE, TE/PLT, Vs/PLT, and Es/PLT

Comparison of the AUROC predicting <F2 vs. ≥F2 and <F4 vs. ≥F4 between LSMs
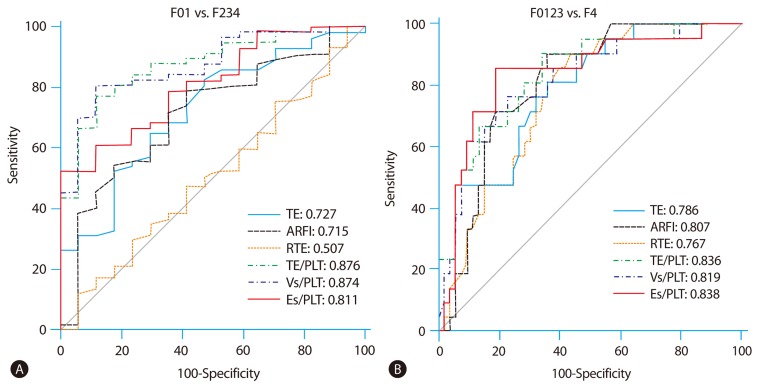
(A) AUROC for the prediction of significant fibrosis (≥F2). (B) AUROC for the prediction of cirrhosis, c-statistics.
The cut-off values of TE, ARFI and RTE for the diagnosis of cirrhosis were 8.60 kPa (AUROC of 0.786, with a Se of 81.0%, Sp of 64.2%)), 1.39 m/s (AUROC of 0.807, with a Se of 90.5%, Sp of 66.0%), 2.79 (AUROC of 0.767, with a Se of 81.0%, Sp of 64.2%) respectively. Comparing with AUROC of each LSM for predicting cirrhosis, all methods are not significantly different (Table 4). When divided by PLT, the cut-off values of LSM/PLT for the diagnosis of cirrhosis were as follows; TE/PLT, 6.02 (AUROC of 0.836, with a Se of 90.5%, Sp of 66.0%); Vs/PLT, 1.28 (AUROC of 0.819, with a Se of 76.2%, Sp of 77.4%); Es/PLT, 2.20 (AUROC of 0.838, with a Se of 85.7%, Sp of 81.1%). The ability to predict cirrhosis was not significantly different between LSM alone and LSM/PLT (Fig. 3B) (Table 4).
DISCUSSION
Recently, several noninvasive methods for replacing liver biopsy have been actively studied. Among them, TE, ARFI and RTE measure liver stiffness using velocity of wave produced by ultrasound.
TE is one of extensively applied non-invasive methods using the FibroScan® device, and its usefulness has been widely reported.25,26 Two meta-analyses11,27 showed it is satisfactory for the diagnosis of advanced fibrosis and cirrhosis. However, it was difficult to measure liver stiffness in patients with a morbid obesity, severe hepatic atrophy and ascites.28
ARFI is a relatively new technology that has been recently introduced for evaluation of liver fibrosis. There is no need to get a special equipment to assess liver stiffness since the function to generate a wave is integrated in the probe that an ultrasound machine provides. One of great advantage of ARFI is that it is available even in patients with ascites or severe obesity.29 Though several studies have evaluated the application of ARFI in the assessment of liver fibrosis in chronic diffuse liver diseases, its usefulness is not well established yet.14-16,30-40 In a preliminary study performed by Friedrich-Rust et al,13 in which ARFI was compared to liver biopsy in 86 patients with chronic viral hepatitis, the Spearman correlation coefficient between the histological fibrosis stage and ARFI, TE were statistically significant. The AUROC and cut-off values for the diagnosis of significant fibrosis of ARFI, TE were 0.82, 0.84, respectively and 1.37 m/s (Se 68.5%, Sp 92.6%), 6.3 kPa (Se 83.3%, Sp 74.1%), respectively.
RTE is also a recently developed utility for the assessment of liver fibrosis.17,41,42 It does not require special technique. It is easy to verify the position because the images are juxtaposed with B-mode reference images. RTE also can evaluate liver fibrosis patients with ascites or severe obesity just as ARFI. According to Friedrich-Rust et al,41 the AUROC for the diagnosis of significant fibrosis and cirrhosis of TE, RTE were 0.84, 0.69, and 0.97, 0.65, respectively. It means that RTE was less accurate for the prediction of liver fibrosis than TE.
In our study, TE, ARFI and RTE showed good correlations with histologic fibrotic stages. The optimal cut-off values for significant fibrosis (≥F2) were 7.5 kPa for TE (AUROC=0.727), 1.19 m/s for ARFI (AUROC=0.715) and 2.54 for RTE (AUROC=0.507). TE and ARFI had a better predictive value than RTE for predicting significant fibrosis (≥F2) (p=0.0069, P=0.0277). This result also demonstrated that TE and ARFI had a better performance to predict significant fibrosis than RTE. That's because LSM by RTE is based upon the propagation wave from patient's heartbeat which can vary depending on individuals. When we combined LSM and platelet count to enhance the ability of prediction for significant fibrosis (≥F2), LSM/PLT showed a more accurate prediction than LSM alone. Liver stiffness measured by 3 kinds of utilities predicts cirrhosis relatively well. The optimal cut-off values for cirrhosis were 8.6 kPa for TE (AUROC=0.786), 1.39 m/s for ARFI (AUROC=0.807) and 2.79 for RTE (AUROC=0.767). TE, ARFI and RTE for predicting cirrhosis did not show statistically significant difference from each other. Additionally, we assessed the performance of TE/PLT, Vs/PLT and Es/PLT using platelet count for predicting cirrhosis as platelet count is expected helpful in diagnosing cirrhosis. However, a mathematic combination of LSM and platelet count did not show better performance than LSM alone. Our study illustrates that LSM itself has a good diagnostic accuracy to predict cirrhosis (F4) rather than significant fibrosis (≥F2).
There are several limitations in this study. First, our study is a retrospective study which can be biased in terms of selection, information, time-interval from biopsy and LSM. And also we had a small study population which might be responsible for type II error. The failure to enhance the ability to predict cirrhosis in spite of accounting for PLT might be attributed to small sample size. The other limitation is that our study population consisted of patients who had a various etiology of liver disease. Considering the optimal cut-off value of AUROC for fibrosis stage is quite different between viral hepatitis and fatty liver disease, putting various kinds of liver diseases together would lead to unintended or undesirable results. Lastly, internal validity for the interpretation of fibrosis stage and LSM was not performed. Since a pathologist and a physician were involved in this study, we had no chance to compare the agreement between observers. However, we applied TE, ARFI and RTE to estimate liver fibrosis in 74 patients with various liver diseases at the same time and evaluated how well they predict the fibrosis stage accurately. We also suggested that PLT would be useful to increase the ability of LSM. To our knowledge, this is the first article to compare TE, ARFI and RTE for the evaluation of liver fibrosis.
In conclusion, our study demonstrates that TE and ARFI rather than RTE are useful as modalities for the assessment of liver fibrosis noninvasively. When platelet count was accounted, TE/PLT, Vs/PLT and Es/PLT were more helpful for predicting significant fibrosis (≥F2) than LSM alone. More studies with LSM for estimation of liver fibrosis stage are needed for enhancing diagnostic performance.
Acknowledgements
This research was supported partly by The GlaxoSmithKline Research Fund of the Korean Association for the study of the Liver.
Notes
The authors have no conflicts to disclose.
Abbreviations
ARFI
acoustic-radiation-force impulse
Es
elasticity score
LSM
liver stiffness measurement
PLT
platelet count
RTE
real-time elastography
TE
transient elastography
Vs
velocity of shear wave