Clin Mol Hepatol > Volume 19(3); 2013 > Article
Kim, Kim, Cho, Kim, Sohn, Jeon, Kim, Park, Park, Joo, Kim, Kim, Heo, and Choi: Elevated red cell distribution width is associated with advanced fibrosis in NAFLD

ABSTRACT

Background/Aims

The red-blood-cell distribution width (RDW) is a newly recognized risk marker in patients with cardiovascular disease, but its role in nonalcoholic fatty liver disease (NAFLD) has not been well defined. The aim of the present study was to determine the association between RDW values and the level of fibrosis in NAFLD according to BARD and FIB-4 scores.

Methods

This study included 24,547 subjects who had been diagnosed with NAFLD based on abdominal ultrasonography and questionnaires about alcohol consumption. The degree of liver fibrosis was determined according to BARD and FIB-4 scores. The association between RDW values and the degree of fibrosis in NAFLD was analyzed retrospectively.

Results

After adjusting for age, hemoglobin level, mean corpuscular volume, history of hypertension, history of diabetes, and high-sensitivity C-reactive protein, the RDW values were 12.61±0.41% (mean±SD), 12.70±0.70%, 12.77±0.62%, 12.87±0.82%, and 13.25±0.90% for those with BARD scores of 0, 1, 2, 3, and 4, respectively, and 12.71±0.72%, 12.79±0.66%, and 13.23±1.52% for those with FIB-4 scores of <1.30, 1.31-2.66, and ≥2.67, respectively (P<0.05). The prevalence of advanced fibrosis (BARD score of 24 and FIB-4 score of ≥1.3) increased with the RDW [BARD score: 51.1% in quartile 1 (Q1) vs. 63.6% in Q4; FIB-4 score: 6.9% in Q1 vs. 10.5% in Q4; P<0.001]. After adjustments, the odds ratio of having advanced fibrosis for those in Q4 compared to Q1 were 1.76 (95%CI=1.55-2.00, P<0.001) relative to BARD score and 1.69 (95%CI=1.52-1.98, P<0.001) relative to FIB-4 score.

Conclusions

Elevated RDW is independently associated with advanced fibrosis in NAFLD.

INTRODUCTION

The red cell distribution width (RDW), which a measure of anisocytosis, has traditionally been used in the differential diagnosis of anemia.1 Recent studies, however, have reported that RDW is associated with increased mortality in many clinical conditions2 and found that high RDW is associated with an increase in allcause mortality. The most plausible explanations for those associations are chronic inflammation and oxidative stress, which leads to an elevation in RDW.3-5
Nonalcoholic fatty liver disease (NAFLD) includes a wide spectrum of liver damage ranging from simple steatosis to non-alcoholic steatohepatitis (NASH), advanced fibrosis, and hepatocellular carcinoma.6,7 Likewise, the association with chronic inflammation and oxidative stress though to be proximate mediating mechanisms of more advanced fibrosis in NAFLD.6 We hypothesized that a common interaction of the aforementioned pathophysiological processes might be link RDW with degree of fibrosis in NAFLD.
We used two simple noninvasive fibrosis scores for evaluating advanced fibrosis of NAFLD. One is the BARD score, which is used to rule out hepatic fibrosis in patients with NAFLD, is composed of three variables (BMI ≥25 is 1 point, AST/ALT ratio (AAR) ≥0.8 is 2 points, and type 2 diabetes mellitus is 1 point) is usually readily available and very easy to estimate.8 And another one is FIB-4 score was calculated according to the following formula: age (years)×AST [IU/L]/platelet count [expressed as platelets×109/L]×(ALT [IU/L]).1,2,9
The goal of the present study is to investigate whether RDW values differ between the lower BARD and FIB-4 score group and the higher BARD and FIB-4 score group, and to consider the role of RDW as a predictive marker for the advanced fibrosis in NAFLD.

METHODS

Study population

A total of 110,978 subjects (63,729 men and 47,249 women) who presented for a routine health maintenance exam at Kangbuk Samsung Hospital (Sungkyunkwan University School of Medicine) between January 1 and December 30, 2010 were included in this study. In addition to obtaining a complete medical history and physical examination, which included waist circumference, all 110,978 subjects underwent an abdominal ultrasound and had blood drawn to determine serum levels of viral markers. The exclusion criteria were based on potential other causes for hepatic injury, steatosis, and/or fibrosis that might confound the data. Thus, subjects were excluded from this study based on: (a) no evidence of hepatic steatosis on ultrasonography (n=77,684); (b) consumption of alcohol ≥20 g per day (n=6,435); (c) antibody to hepatitis C (anti-HCV) positivity (n=67) or hepatitis B surface antigen (HBsAg) positivity (n=1,808); and (d) a history of past or current malignancy (n=93). Additionally, 343 individuals with abnormal abdominal ultrasonography results (evidence of malignancy or cirrhosis) were excluded. Cirrhosis really whether caused by NAFLD is difficult to prove consequently, were excluded. Thus, the final number of subjects available for study was 24,547, which was comprised of 20,008 men and 4,539 women.

Laboratory measurements

All subjects had fasted overnight before they were seen by physicians in clinic. Their height and weight were determined, and their body mass index (BMI) was expressed as weight (kg) divided by the square of the height (m2). Blood samples were collected and a complete blood count was measured by an automated laser-based hematology analyzer (Advia 2120; Siemens Healthcare Diagnostics, Deerfield, Ill). White blood cell count, platelet count, hemoglobin, mean corpuscular volume (MCV), and RDW were all recorded. The fasting glucose level was measured using the hexokinase method. HBsAg and antibody to hepatitis B surface antigen (anti-HBs) were measured by a chemiluminescent microparticle immunoassay (CMIA) (Architect i2000 SR, Abbott, IL, USA). HCV Ab was measured by polymerase chain reaction (PCR) (COBAS AMPLICOR, Roche, Basel, Switzerland). An enzymatic calorimetric test was used to measure the total cholesterol (TC) and triglyceride (TG) concentrations. The selective inhibition method was used to measure the level of high-density lipoprotein cholesterol (HDL-C) and a homogeneous enzymatic calorimetric test was used to measure the level of low-density lipoprotein cholesterol (LDL-C) (Advia 1650 Autoanalyzer, Byer Diagnostics Leverkusen Germany). High sensitivity C-reactive protein (hs-CRP) was analyzed by performing particle-enhanced immunonephelometry with using the BNTM System (Dade Behring, Marburg, Germany). This result was presented in mg/L, and the minimum detectable hsCRP level was 0.175 mg/L after performing a 1:20 sample dilution.

Abdominal ultrasonography

Abdominal ultrasonography (ASPEN; Acuson, PA, USA) was performed by experienced radiologists who were blinded to clinical presentation and laboratory findings. The diagnosis of fatty liver was made using the following criteria: a diffuse hyper-echoic echotexture, hepatorenal echo contrast in reference to the cortex of the right kidney, vascular blurring, and deep-echo attenuation.10,11

Degree of liver fibrosis assessment by the BARD score and FIB-4 score

The BARD score is composed of 3 variables: an AST/ALT ratio ≥0.8 is 2 points, a BMI ≥25 is 1 point, and the presence of diabetes mellitus is 1 point. Thus, the possible score ranges from 0 to 4 points.12 According to the results by Harrison et al, a score values of 0 or 1 has a high negative predictive value (NPV) for severe hepatic fibrosis and a score of 2-4 was associated with an OR for advanced fibrosis of 17 (confidence interval 9.2 to 31.9).12
The FIB-4 score was calculated according to the following formula: age×AST (IU/l)/platelet count (×109/L)×√ALT (IU/L). And the FIB-4 score can reliably exclude advanced fibrosis and lead to the avoidance of liver biopsy in more than 60% of patients with NAFLD and normal or elevated ALT levels, it might be an appropriate score to triage patients with NAFLD into those who have a low probability of advanced fibrosis and those who need further investigation.13

Statistical analysis

Statistical analysis of the data was performed by Statistical Package for Social Sciences (SPSS) version 18 software (SPSS Inc., Chicago, IL, USA). The Shapiro-Wilk test was used to determine whether the continuous variables were normally distributed. Descriptive statistics are displayed as means±standard deviation for normally distributed variables and as medians with interquartile ranges for non-normally distributed variables. RDW quartiles were generated for the overall population based on its distribution. Baseline characteristics were then compared across these quartiles using One-way analysis of variance (ANOVA) or Kruskal-Wallis tests were used for continuous variables, whereas a Fisher's exact test was used to test differences among the RDW quartiles. RDW values in the BARD score and FIB-4 score groups were compared using a one-way analysis of covariance (ANCOVA) test. Differences in subgroups were tested using a Tu key HSD test. Pearson correlation coefficients were used to test univariate correlations for BARD and FIB-4 score with some inflammatory markers. A P-value of less than 0.05 was considered to be statistically significant in this study.
To estimate overall odds for higher BARD score (2-4) and higher FIB-4 score (>1.3), multivariate adjusted logistic regression analysis was performed adjusting for age, sex, hemoglobin level, MCV, hsCRP, history of smoking, history of diabetes and history of hypertension.

Ethics statement

The analysis of data was approved by the Institutional Review Board of Kangbuk Samsung Hospital, which confirmed that the study was in accordance with the ethical guidelines of the Helsinki Declaration. All participants provide their written informed consent to participate in this study. and our ethics committees approve this consent procedure.

RESULTS

Table 1 shows patient baseline characteristics distribution across the quartiles of RDW. Most of the demographic, anthropometric, and biochemical characteristics were comparable between the groups. FIB-4 score and high BARD score (2,3 and 4 respectively) increased in relation to increasing RDW (p for trend <0.001) whereas, low BARD score (0-1) decreased with increasing RDW. Age, BMI, HbA1c, Diabetes and hypertension increased with increasing RDW. Mean FIB-4 score was 0.80±0.34 in Q1, 0.83±0.35 in Q2, 0.85±0.36 in Q3 and 0.86±0.46 in Q4 (P<0.001).
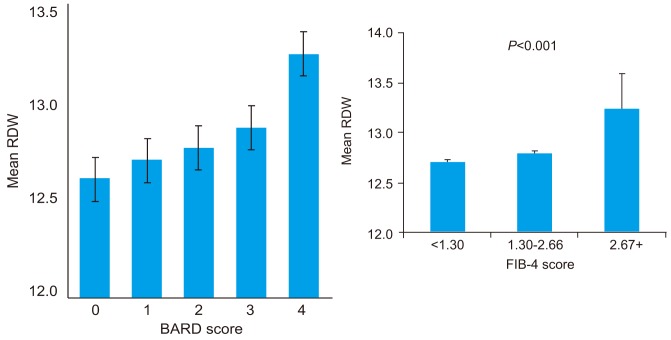
Higher RDW values indicate greater variation in size. In the case of folate and vitamin B12 deficiency anemia, iron deficiency anemia, old age and various cardiovascular disease, causing the RDW to be elevated.14,15 After adjusting for age, sex, hemoglobin level, MCV, hsCRP, history of smoking, history of diabetes and history of hypertension, mean RDW values were 12.61±0.41, 12.70±0.70, 12.77±0.62, 12.87±0.82 and 13.25±0.90 in BARD score 0, 1, 2, 3, and 4 groups, respectively and 12.71±0.72, 12.79±0.66 and 13.23±1.52 in FIB-4 score <1.30, 1.31-2.66 and ≥2.67 groups, respectively (P<0.05 ANCOVA) and (Fig. 1).
Table 2 shows the correlation coefficients between several inflammatory markers and BARD and FIB-4 score. RDW and ferritin were found to be significantly correlated with BARD and FIB-4 score.
Table 3 and Table 4 shows some metabolic components and inflammatory markers distributed according to low and high BARD score and FIB-4 score. High BARD score group was older, had lower body mass index and diabetes, hypertension increased. High FIB-4 score was older but diabetes and hypertension was decreased.
As shown in Table 5, a graded increase in proportion of having advanced fibrosis (BARD score 2-4 and FIB-4≥1.3) with increasing quartiles of RDW(51.1% in Q1 vs. 63.6% in Q4 on BARD score and 6.9% in Q1 vs. 10.5% in Q4 on FIB-4 score, P<0.001) was observed. RDW as a categorical variable (adjusted OR: 1.76, 95% CI: 1.55-2.00 in BARD score and 1.69, 95% CI: 1.52-1.98 in FIB-4 score, P<0.001) remained a statistically significant predictor of advanced fibrosis (BARD score 2-4 and FIB-4≥1.3) in model 3 and 4.

DISCUSSION

In this retrospective study we demonstrated that an increased RDW, which is a simple morphologic marker of red blood cell size heterogeneity, was associated with advanced fibrosis in NAFLD patients. This association remained significant even after adjusting for patient demographics and laboratory parameters.
The mechanism by which elevated RDW values are associated with increased NAFLD fibrosis is unknown. An elevation in the RDW may occur during conditions of ineffective red blood cell production (iron deficiency, B12 or folate deficiency, and hemoglobinopathies), increased red blood cell destruction (hemolysis), or after blood transfusions.16,17 Additionally, proinflammatory cytokines have been shown to inhibit erythropoietin-induced erythrocyte maturation. Thus, inflammation could lead to anisocytosis via release of immature red blood cells into the peripheral circulation.18-20
Several non-invasive methods have been used to identify advanced fibrosis in patients with NAFLD.21 All of them show a greater utility in suggesting the absence of advanced fibrosis rather than predicting the presence of it. Considering the similarity of results between the scoring systems, we used the BARD score and FIB-4 score, which is easier to apply in clinical practice, to identify patients without severe liver fibrosis in this study.8 In the study by Harrison et al a low BARD score (0 or 1 point) had a very compelling negative predictive value (96%) in identifying patients without advanced fibrosis,12 while the positive predictive value of a high score was not as high (43%)
Fibroscan is also a noninvasive test, it can be performed at the point of care, there is no pain, and sedation is not required. Also, the test takes only 5-7 minutes to perform, it is significantly less expensive than liver biopsy, and it has not been associated with any side effects. But technical limitations of the test preclude its use in patients who have ascites, individuals who are morbidly obese, and/or patients who have large amounts of chest wall fat. In these groups, either the test cannot be performed or the results are not reliable.22 Several other noninvasive methods can be used to measure liver stiffness. One radiologic method for measuring liver fibrosis is magnetic resonance (MR) elastography. The advantage of MR elastography is that it is very accurate for measuring liver stiffness; however, this test requires patients to undergo an MR imaging scan, and therefore it cannot be performed at the point of care. Acoustic resonance force impulse testing is another radiologic method for measuring liver fibrosis, but this method is still undergoing evaluation and has not yet been broadly adopted for clinical use.22
Oxidative stress increases the fragility of red blood cells. Oxidative stress also decreases the rate of erythroid maturation and decreases erythrocyte lifespan.23 Previous studies have reported that higher RDW is correlated with hypertension,24 inflammatory bowel disease,15 microalbuminuria,14 and cardiovascular diseases. These conditions which are associated with low antioxidant nutrients. The primary source of plasma glutathione peroxidase is the kidney and plasma selenium, plasma glutathione peroxidase, and glutathione peroxidase activity in erythrocytes have been strongly correlated with stages of chronic renal failure.25 Inflammatory bowel disease is associated with lower circulating carotenoids and increased oxidative stress.26
To the best of our knowledge this is first study that has attempted to analyze the association between RDW and NAFLD fibrosis. In this study we showed that higher levels of RDW and ferritin were associated with a higher BARD score and FIB-4 score. Ferritin has previously been shown to predict advanced fibrosis in NAFLD in several studies.27 An elevated hsCRP level, however, was not associated with advanced fibrosis in NAFLD in this study. It is tempting to speculate that higher RDW may will be an earlier marker of chronic subclinical inflammation might be responsible for the association between RDW and advanced fibrosis in NAFLD at normal hsCRP levels.5,28
Among biomarkers of inflammation, hsCRP has proved to be the most robust, as it is an excellent analyte with a standardized assay. a strong, graded association of RDW with hsCRP and ESR independent of numerous confounding factors.5
RDW is also found to be elevated in conditions associated with higher oxidative stress28,29 and has been shown to be associated with markers of oxidative stress,4 which in turn might explain the association with elevated RDW values.30
Our study findings indicate a graded association between high RDW and advanced fibrosis. Although the precise pathophysiologic link between this interaction was not examined in the present study, common interactions between inflammation, oxidative stress may explain the observed association and the emerging utility of these biomarkers in the prediction of advanced fibrosis in NAFLD.
Our study is a cross-sectional analysis with inherent limitations and thus it is unable to definitively comment on causality or temporal association. Our study was confined to a relatively racially homogenous group of individuals of Korean descent who were recruited at a single medical institution. This study did not incorporate liver biopsies, which is the gold standard in diagnosing the level of fibrosis in NAFLD. However, our group and others have previously published studies using BARD score and FIB-4 score to establish the degree of fibrosis. Finally, a different number of subjects in each study group is another potential limitation.
In conclusion, in a very large cohort, our observations revealed a graded positive relationship between RDW and the level of fibrosis in NAFLD independent of multiple confounders, including hsCRP. Further studies with larger sample sizes and prospective approaches are needed to elucidate the mechanism underlying this association.

FOOTNOTES

The authors have no conflicts to disclose.

Abbreviations

BARD score
BMI, AST/ALT Ratio, Diabetes score
FIB-4 score
fibrosis 4 score
NAFLD
nonalcoholic fatty liver disease
RDW
red cell distribution width

REFERENCES

1. Aslan D, Gümrük F, Gürgey A, Altay C. Importance of RDW value in differential diagnosis of hypochrome anemias. Am J Hematol 2002;69:31-33. 11835328.
crossref pmid
2. Perlstein TS, Weuve J, Pfeffer MA, Beckman JA. Red blood cell distribution width and mortality risk in a community-based prospective cohort. Arch Intern Med 2009;169:588-594. 19307522.
crossref pmid pmc
3. Förhécz Z, Gombos T, Borgulya G, Pozsonyi Z, Prohászka Z, Jánoskuti L. Red cell distribution width: a powerful prognostic marker in heart failure. Eur J Heart Fail 2010;12:415. 20167580.
crossref pmid
4. Semba RD, Patel KV, Ferrucci L, Sun K, Roy CN, Guralnik JM, et al. Serum antioxidants and inflammation predict red cell distribution width in older women: the Women's Health and Aging Study I. Clin Nutr 2010;29:600-604. 20334961.
crossref pmid pmc
5. Lippi G, Targher G, Montagnana M, Salvagno GL, Zoppini G, Guidi GC. Relation between red blood cell distribution width and inflammatory biomarkers in a large cohort of unselected outpatients. Arch Pathol Lab Med 2009;133:628-632. 19391664.
crossref pmid pdf
6. Angulo P. Nonalcoholic fatty liver disease. N Engl J Med 2002;346:1221-1231. 11961152.
crossref pmid
7. Clark JM, Brancati FL, Diehl AM. Nonalcoholic fatty liver disease. Gastroenterology 2002;122:1649-1657. 12016429.
crossref pmid
8. Ruffillo G, Fassio E, Alvarez E, Landeira G, Longo C, Domínguez N, et al. Comparison of NAFLD fibrosis score and BARD score in predicting fibrosis in nonalcoholic fatty liver disease. J Hepatol 2011;54:160-163. 20934232.
crossref pmid
9. Vallet-Pichard A, Mallet V, Nalpas B, Verkarre V, Nalpas A, Dhalluin-Venier V, et al. FIB-4: an inexpensive and accurate marker of fibrosis in HCV infection. comparison with liver biopsy and fibrotest. Hepatology 2007;46:32-36. 17567829.
crossref pmid
10. Sung KC, Ryan MC, Kim BS, Cho YK, Kim BI, Reaven GM. Relationships between estimates of adiposity, insulin resistance, and nonalcoholic fatty liver disease in a large group of nondiabetic Korean adults. Diabetes Care 2007;30:2113-2118. 17475935.
crossref pmid
11. Baumeister SE, Völzke H, Marschall P, John U, Schmidt CO, Flessa S, et al. Impact of fatty liver disease on health care utilization and costs in a general population: a 5-year observation. Gastroenterology 2008;134:85-94. 18005961.
crossref pmid
12. Harrison SA, Oliver D, Arnold HL, Gogia S, Neuschwander-Tetri BA. Development and validation of a simple NAFLD clinical scoring system for identifying patients without advanced disease. Gut 2008;57:1441-1447. 18390575.
crossref pmid
13. McPherson S, Anstee QM, Henderson E, Day CP, Burt AD. Are simple noninvasive scoring systems for fibrosis reliable in patients with NAFLD and normal ALT levels. Eur J Gastroenterol Hepatol 2013;25:652-658. 23325287.
crossref pmid
14. Afonso L, Zalawadiya SK, Veeranna V, Panaich SS, Niraj A, Jacob S. Relationship between red cell distribution width and microalbuminuria: a population-based study of multiethnic representative US adults. Nephron Clin Pract 2011;119:c277-c282. 21921640.
crossref pmid
15. Cakal B, Akoz AG, Ustundag Y, Yalinkilic M, Ulker A, Ankarali H. Red cell distribution width for assessment of activity of inflammatory bowel disease. Dig Dis Sci 2009;54:842-847. 18716874.
crossref pmid
16. Felker GM, Allen LA, Pocock SJ, Shaw LK, McMurray JJ, Pfeffer MA, et al. Red cell distribution width as a novel prognostic marker in heart failure: data from the CHARM Program and the Duke Databank. J Am Coll Cardiol 2007;50:40-47. 17601544.
crossref pmid
17. Tonelli M, Sacks F, Arnold M, Moye L, Davis B, Pfeffer M. Relation Between Red Blood Cell Distribution Width and Cardiovascular Event Rate in People With Coronary Disease. Circulation 2008;117:163-168. 18172029.
crossref pmid
18. Weiss G, Goodnough LT. Anemia of chronic disease. N Engl J Med 2005;352:1011-1023. 15758012.
crossref pmid
19. Papadaki HA, Kritikos HD, Valatas V, Boumpas DT, Eliopoulos GD. Anemia of chronic disease in rheumatoid arthritis is associated with increased apoptosis of bone marrow erythroid cells: improvement following anti-tumor necrosis factor-alpha antibody therapy. Blood 2002;100:474-482. 12091338.
crossref pmid
20. Förhécz Z, Gombos T, Borgulya G, Pozsonyi Z, Prohászka Z, Jánoskuti L. Red cell distribution width in heart failure: prediction of clinical events and relationship with markers of ineffective erythropoiesis, inflammation, renal function, and nutritional state. Am Heart J 2009;158:659-666. 19781428.
crossref pmid
21. Musso G, Gambino R, Cassader M, Pagano G. Meta-analysis: natural history of non-alcoholic fatty liver disease (NAFLD) and diagnostic accuracy of non-invasive tests for liver disease severity. Ann Med 2011;43:617-649. 21039302.
crossref pmid
22. Afdhal NH. Fibroscan (transient elastography) for the measurement of liver fibrosis. Gastroenterol Hepatol (N Y) 2012;8:605-607. 23483859.
pmid pmc
23. Tozzi-Ciancarelli MG, Di Giulio A, Troiani-Sevi E, D'Alfonso A, Amicosante G, Oratore A. Human erythrocyte damage at the initial stages of oxidative stress. Cell Biophys 1989;15:225-234. 2480182.
crossref pmid
24. Tanindi A, Topal FE, Topal F, Celik B. Red cell distribution width in patients with prehypertension and hypertension. Blood Press 2012;21:177-181. 22243409.
crossref pmid
25. Avissar N, Ornt DB, Yagil Y, Horowitz S, Watkins RH, Kerl EA, et al. Human kidney proximal tubules are the main source of plasma glutathione peroxidase. Am J Physiol 1994;266:C367-C375. 8141250.
crossref pmid
26. D'Odorico A, Bortolan S, Cardin R, D'Inca' R, Martines D, Ferronato A, et al. Reduced plasma antioxidant concentrations and increased oxidative DNA damage in inflammatory bowel disease. Scand J Gastroenterol 2001;36:1289-1294. 11761019.
crossref pmid
27. Kowdley KV, Belt P, Wilson LA, Yeh MM, Neuschwander-Tetri BA, Chalasani N, et al. Serum ferritin is an independent predictor of histologic severity and advanced fibrosis in patients with nonalcoholic fatty liver disease. Hepatology 2012;55:77-85. 21953442.
crossref pmid pmc
28. Garcez ME, Peres W, Salvador M. Oxidative stress and hematologic and biochemical parameters in individuals with Down syndrome. Mayo Clin Proc 2005;80:1607-1611. 16342654.
crossref pmid
29. Kiefer CR, Snyder LM. Oxidation and erythrocyte senescence. Curr Opin Hematol 2000;7:113-116. 10698298.
crossref pmid
30. Park SH. Nonalcoholic steatohepatitis: pathogenesis and treatment. Korean J Hepatol 2008;14:12-27. 18367854.
crossref pmid
Figure 1
Mean red cell distribution width (RDW) values adjusted for age, sex, Hb, MCV, hsCRP, history of smoking, history of diabetes, and history of hypertension.

cmh-19-258-g001.jpg
Table 1.
Baseline characteristics of the study population across the quartiles of RDW values
Group Q1 (≤12.3) Q2 (12.31-12.60) Q3 (12.61-13.00) Q4 (≥13.01) P-value
Number of subjects 6917 6071 6290 5269
Age 41±6 42±6 43±8 44±8 <0.001
Sex (%, male/female) 84.5/15.5 84.1/15.9 83.8/16.2 71.8/28.2 <0.001
Height (cm) 171.53±6.59 172.01±7.01 168.76±8.11 170.00±8.83 <0.001
Weight (kg) 72.44±7.57 73.01±9.94 72.34±9.14 74.61±10.52 <0.001
BMI (kg/m2) 25.86±1.68 25.90±2.31 26.00±2.01 26.20±2.31 <0.001
SBP (mmHg) 118.61±11.46 123.81±12.09 117.45±12.16 122.46±13.16 <0.001
DBP (mmHg) 76.10±8.44 79.73±9.24 75.16±8.89 78.47±9.61 <0.001
Hb (g/dL) 15.72±1.08 15.80±1.15 14.98±1.58 15.04±1.45 <0.001
MCV (fl) 89.68±3.54 89.38±3.66 90.04±4.36 89.62±4.85 <0.001
LDL (mg/dL) 134.01±31.36 135.37±32.88 127.82±30.45 128.55±31.42 <0.001
TG (mg/dL) 178.67±17.05 185.12±16.18 172.06±19.42 174.24±10.50 <0.001
HDL (mg/dL) 46.48±9.50 45.11±9.01 50.42±11.47 48.21±10.29 <0.001
HbA1c (%) 5.79±0.70 5.81±0.75 5.84±0.61 5.89±0.72 <0.001
hsCRP (mg/L) 0.12 (0.01-7.56) 0.14 (0.01-8.36) 0.15 (0.01-11.19) 0.16 (0.01-7.34) <0.001
ferritin 108.59±14.05 142.42±15.21 172.47±13.94 166.24±15.11 <0.001
Platelet (×109/L) 254±50 252±50 252±51 262±60 <0.001
FIB-4 0.80±0.34 0.83±0.35 0.85±0.36 0.86±0.46 <0.001
BARD score [n (%)]
 0 2,416 (34.9) 1,973 (32.5) 1,910 (30.4) 1,269 (24.1) <0.001
 1 963 (13.9) 784 (12.9) 782 (12.4) 646 (12.3) <0.001
 2 3042 (44.0) 2819 (46.4) 2984 (47.4) 2644 (50.2) <0.001
 3 488 (7.1) 486 (8.0) 591 (9.4) 679 (12.9) <0.001
 4 8 (0.1) 9 (0.1) 23 (0.4) 31 (0.6) <0.001
Smoker (%) 30.8 30.4 31.8 29.3 0.09
Diabetes (%) 1.8 1.9 2.1 2.1 <0.001
Hypertension (%) 6.2 6.2 6.4 6.6 <0.001

Data are expressed as mean±SD or median [IQR].

BMI, body mass index; SBP, systolic blood pressure; DBP, diastolic blood pressure; Hb, hemoglobin; MCV, mean corpuscular volume; LDL, low-density lipoprotein; HDL, high-density lipoprotein; TG, triglyceride; HbA1c, hemoglobin A1c; hsCRP, high-sensitivity C-reactive protein; RDW, Red blood cell distribution width.

Table 2.
Correlation coefficients for the relationship between BARD and FIB-4 score and inflammatory markers
BARD score
FIB-4 score
Correlation coefficients P-value Correlation coefficients P-value
hsCRP 0.015 0.022 0.043 0.013
Ferritin 0.104 <0.001 0.110 <0.001
RDW 0.148 <0.001 0.134 <0.001

Pearson correlation coefficients.

hsCRP, high-sensitive C-reactive protein; RDW, red cell distribution width.

Table 3.
Baseline characteristics of the study population, stratified according to low and high BARD and FIB-4 scores
BARD score (0,1) BARD score (2-4) P-value
Number of subjects 10743 13804
Sex (%, male/female) 92.0/8.0 73.3/26.7 <0.001
Age 41.28±6.78 44.33±8.43 <0.001
BMI (kg/m2) 26.67±2.88 25.45±2.77 <0.001
Diabetes (%) 1.2 6.0 <0.001
Hypertension (%) 6.7 11 <0.001
hsCRP 0.151 (0.01-7.86) 0.139 (0.01-6.43) <0.001
Ferritin 136.50±12.06 152.78±12.35 <0.001
RDW 12.59±0.62 12.99±0.85 <0.001

Data are expressed as mean±SD or median (IQR).

hsCRP, high-sensitive C-reactive protein; RDW, red cell distribution width.

Table 4.
Baseline characteristics of the study population, stratified according low and high FIB-4 scores
FIB-4 score (<1.3) FIB-4 score (≥1.3) P-value
Number of subjects 22,450 2,097
Sex (%, male/female) 81.7/18.3 79.3/20.7 <0.001
Age 42.03±6.99 50.29±9.54 <0.001
BMI (kg/m2) 25.99±2.88 25.92±2.88 <0.001
Diabetes (%) 2.0 1.7 <0.001
Hypertension (%) 6.4 5.9 <0.001
hsCRP 0.14 (0.01-0.29) 0.16 (0.01-6.41) <0.001
Ferritin 145.35±11.06 150.78±12.45 <0.001
RDW 12.61±0.77 12.89±0.71 <0.001

Data are expressed as mean±SD or median (IQR).

hsCRP, high-sensitive C-reactive protein; RDW, red cell distribution width.

Table 5.
RDW and overall odds ratio of having advanced fibrosis (BARD score of 2.4 and FIB-4 score of ≥1.3)
Q1 (n=6917) Q2 (n=6071) Q3 (n=6290) Q4 (n=5269)
Cases 1 3,538 (51.1%) 3,314 (54.6%) 3,589 (57.2%) 3,354 (63.7%)
Cases 2 478 (6.9%) 521 (8.5%) 545 (8.7%) 553 (10.5%)

OR 95% CI P-value OR 95% CI P-value OR 95% CI P-value

Model 1 Reference 1.14 1.07-1.23 <0.001 1.27 1.19-1.36 <0.001 1.67 1.55-1.80 <0.001
Model 2 Reference 1.12 0.98-1.29 <0.001 1.34 1.18-1.53 <0.001 1.76 1.55-2.00 <0.001
Model 3 Reference 1.33 1.16-1.52 <0.001 1.53 1.35-1.74 <0.001 1.79 1.57-2.04 <0.001
Model 4 Reference 1.31 1.11-1.49 <0.001 1.48 1.17-1.59 <0.001 1.69 1.52-1.98 <0.001

Q1: RDW quartile 1 (≤12.30), Q2: RDW quartile 2 (12.31-12.60), Q3: RDW quartile 3 (12.61-13.00), Q4: RDW quartile 4 (≥13.01), Cases 1: cases of BARD score 2-4, Cases2: cases of FIB-4≥1.3, Model 1: odds of having advanced fibrosis (BARD score 2-4) and RDW, not adjusted. Model 2: odds of having advanced fibrosis (BARD score 2-4) and RDW, adjusted for age, sex, Hb, MCV, hsCRP, history of smoking, history of diabetes, and history of hypertension. Model 3: odds of having advanced fibrosis (FIB-4 score ≥1.3) and RDW, not adjusted. Model 4: odds of having advanced fibrosis (FIB-4 score ≥1.3) and RDW, adjusted for age, sex, Hb, MCV, hsCRP, history of smoking, history of diabetes, and history of hypertension.

TOOLS
METRICS Graph View
  • 35 Crossref
  • 38 Scopus
  • 10,496 View
  • 107 Download
Related articles

Editorial Office
The Korean Association for the Study of the Liver
Room A1210, 53 Mapo-daero(MapoTrapalace, Dowha-dong), Mapo-gu, Seoul, 04158, Korea
TEL: +82-2-703-0051   FAX: +82-2-703-0071    E-mail: cmh_journal@ijpnc.com
Copyright © The Korean Association for the Study of the Liver.         
COUNTER
TODAY : 616
TOTAL : 2237495
Close layer