Liver stiffness measurement: Is it a non-invasive substitution for HVPG?
Article information
See Article on Page [Related article:] 370
Cirrhosis, the end stage of any chronic liver disease, can lead to portal hypertension (PHT), which can lead to fatal complications. Therefore, the prognosis and management of chronic liver diseases strongly depend on the severity of PHT. The best method to diagnose PHT is the direct measurement of portal pressure, and hepatic venous pressure gradient (HVPG) has been suggested as a reliable gold standard for the assessment of PHT. HVPG measures a hemodynamic change of portal blood flow derived from the fibrotic transformation of liver tissue and reflects the disease progression in chronic liver disease without sampling error as in the case of liver biopsy. Clinically significant portal hypertension (CSPH) is defined as HVPG ≥10 mmHg and severe PHT is defined as HVPG ≥12 mmHg. Esophageal varices (EVs), ascites, and all other complications of PHT may develop when the HVPG increases above 10 mmHg. However, HVPG measurement is invasive, relatively expensive, and available only in specialized centers with well trained operators, it needs reliable, non-invasive, and widely available methods.1 Transient elastography is a rapid and non-invasive technique that allows the measurement of liver stiffness.2 Liver stiffness measurement (LSM) has been shown to be correlated to fibrosis stage in various chronic liver diseases with a high sensitivity and specificity for the diagnosis of cirrhosis.3-5
Recently, several studies demonstrated the correlation between LSM and HVPG (Table 1).6-9
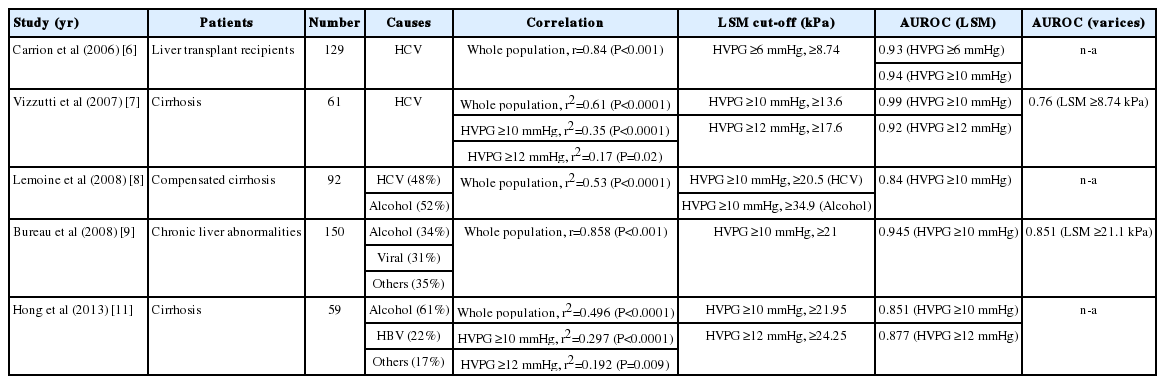
Studies about correlation between liver stiffness and HVPG
Although the characteristics of patients and the causes of chronic liver disease were heterogenous, there was a good correlation between LSM and HVPG in whole patient population.
However, the level of correlation differed between LSM and HVPG according to the value of the HVPG. The liver stiffness was very well correlated with HVPG up to values of 10-12 mmHg, whereas it hardly reaches statistical significance for HVPG values ≥12 mmHg. This suggests that beyond a certain degree of portal pressure gradiet (≥10 to 12 mmHg), PHT develops partially independent from the tissue fibrosis responsible for liver tissue stiffness.7 Also, several extrahepatic factors including the hyperdynamic circulation, the splanchnic vasodilatation, and the resistance opposed to portal blood flow by the portosystemic collaterals become the cause of rise in portal pressure.10 These factors make structural variables that have an independent impact on portal pressure in individual patients. LSM cut-off values for HVPG ≥10 mmHg were also variable, ranging from 13.6 kPa to 34.9 kPa. These differences may be due to the heterogeneity of studied population and different causes of disease. Optimal LSM cut-off values for HVPG ≥10 mmHg were different between alcohol and hepatitis C virus (HCV) cohorts, where the higher values in the alcoholic group (alcoholic group, 34.9 kPa vs. HCV infected group, 20.5 kPa) suggest that LSM values must be closely interpreted according to the causes of the liver disease.8 These differences suggest that the extent of liver fibrosis and the degree of PHT are more important in the alcoholic patients.
In the current issue of Clinical and Molecular Hepatology, Hong et al11 have conducted a study to evaluate the relationship between LSM and HVPG, and also investigated the predictive value of LSM for CSPH and severe PHT in liver cirrhosis. This study showed a strong positive correlation between LSM and HVPG in the whole patient population.
The area under the receiver operating characteristic curve (AUROC) for the prediction of CSPH was 0.851 at LSM cutoff value of 21.95 kPa, and that of severe PHT was 0.877 at LSM cutoff value of 24.25 kPa. In this study, LSM was strongly correlated with HVPG and accurately predicted the presence of CSPH in patients with cirrhosis in a Korean population. There are several issues to comment regarding this study. First, LSM was well correlated with HVPG up to values of 10-12 mmHg, but the correlation decreased above these values, showing that a PTH beyond over HVPG ≥10 to 12 mmHg develops independently from tissue fibrosis. To improve the correlation of LSM and HVPG over 10 to 12 mmHg, the combination of different methods that would enhance the accuracy of single test by assessing different pathophysiological components of PHT. Recently, combined spleen size and platelet count on LSM has been reported as a mean to identify patients with compensated cirrhosis most likely to have CSPH and EVs.12 In this study, AUROC value increased when LSM was combined with platelet count and spleen size. Regarding varices, it is well established that if the HVPG can be reduced to less than 12 mm Hg, the risk of bleeding will fall significantly, whereas LSM alone has not discriminated it adequately.13 Combination with different tests will improve the non-invasive substitution of LSM in predicting CSPH and EVs of PHT. Second, the cutoff of LSM for the diagnosis of CSPH in this study was higher than previous studies because most of this study population exhibited alcoholic cirrhosis. However, the number of study population was small and not homogenous. Further large numbered, homogenous classified population based on the cause of disease will get more accurate cutoff of LSM. In conclusion, Hong et al11 have conducted a valuable study to evaluate the association between LSM and HVPG, and demonstrated that LSM is strongly correlated with HVPG and accurately predicts the presence of CSPH in patients with cirrhosis in a Korean population. Future studies can be carried out to investigate the relationship between LSM and HVPG in larger population of patients with homogenous causes of liver disease applying the combined methods to improve the weak correlation between LSM and HVPG values over 10-12 mmHg. Additionally, the role of LSM for the prediction of EVs should be evaluated as a substitution of HVPG.
Notes
The author has no conflicts to disclose.
Abbreviations
AUROC
area under the receiver operating characteristic curve
CSPH
clinically significant portal hypertension
EVs
Esophageal varices
HVPG
hepatic venous pressure gradient
LSM
liver stiffness measurement
NPV
negative predictive value
PHT
portal hypertension
PPV
positive predictive value