Magnetic resonance imaging following treatment of advanced hepatocellular carcinoma with sorafenib
Article information
Abstract
Hepatocellular carcinomas are highly vascular tumors, showing progressive hypervascularity by the process of neoangiogenesis. Tumor angiogenesis is critical for tumor growth as well as metastatic spread therefore, imaging and quantification of tumor neo-angiogenesis is essential for monitoring response to targeted therapies and predicting disease progression. Sorafenib is a molecular targeting agent used for treating hypervascular tumors. This drug is now the standard of care in treatment of patients with advanced hepatocellular carcinoma. Due to its anti-angiogenic and anti-proliferative actions, imaging findings following treatment with Sorafenib are quite distinct when compared to conventional chemotherapeutic agents. Liver MRI is a widely adopted imaging modality for assessing treatment response in hepatocellular carcinoma and imaging features may reflect pathophysiological changes within the tumor. In this mini-review, we will discuss MRI findings after Sorafenib treatment in hepatocellular carcinoma and review the feasibility of MRI as an early biomarker in differentiating responders from non-responders after treatment with molecular targeting agents.
INTRODUCTION
Hepatocellular carcinoma (HCC) is one of the leading causes of cancer-related deaths worldwide. Sorafenib, a multikinase inhibitor, is currently the standard of care in treatment of patients with advanced HCC and is the first molecular targeted agent to show survival benefit in this subgroup of patients.1 Sorafenib, has strong anti-angiogenic effects, leading to unique imaging features after treatment compared to those seen with conventional, cytotoxic chemotherapeutic agents. Contrary to conventional chemotherapeutic agents, molecular targeted agents may not show dramatic tumor size shrinkage, even in cases with a good clinical outcome. Therefore, conventional evaluation methods for tumor response on the basis of tumor size change may not be applicable.
The assessment of treatment response is one of the basic building blocks in oncology; therefore, early differentiation of responders from non-responders is clinically relevant. Both radiologists and clinicians should be familiar with the imaging features of HCC following treatment with molecular targeting agents such as Sorafenib.
In this mini-review article, we discuss the magnetic resonance imaging (MRI) features of HCC after treatment with Sorafenib. The utility of MRI in delineating the changes that parallel the pathological course of the disease following treatment with molecular targeted agents is highlighted.
MRI FINDINGS AFTER TREATMENT WITH SORAFENIB
Pathophysiological changes of HCC after Sorafenib treatment
The imaging features of HCC following treatment with Sorafenib, parallel the pathophysiologic changes within the tumor. Sorafenib displays both anti-angiogenic and anti-proliferative properties and affects tumor cells at several levels in the molecular pathway. The predominant anti-angiogenic effect of Sorafenib is related to the inhibition of the vascular endothelial growth factor receptors which directly acts on proliferation of tumor cells, thereby reducing tumor perfusion and inducing necrosis. Internal tumoral hemorrhage may thus be observed due to ischemia. Decreased tumor cellularity is another pathological finding seen after Sorafenib due to its anti-proliferative properties.
Changes on T1WI and T2WI following treatment with Sorafenib
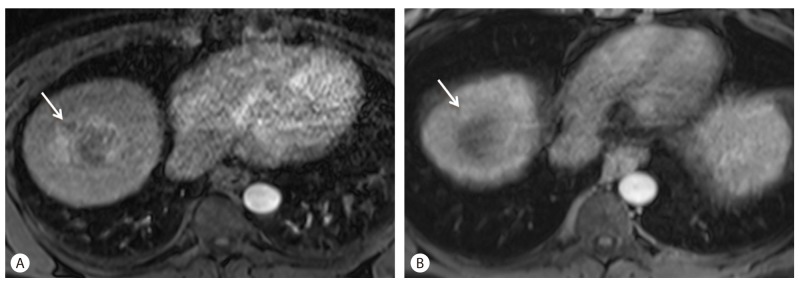
Signal abnormalities on T1 and T2 weighted imaging reflect morphologic changes in the tumor and can be seen as early as 2-4 weeks into therapy. The predominant tumor signal change in the majority of patients after Sorafenib therapy is a focal or diffuse increase in tumor signal compared to baseline on both T1WI (T1 weighted images) and T2WI (T2 weighted images). This finding reflects hemorrhage or protein-rich necrosis within the tumor.2 Signal changes in responders on T2WI were seen to lag behind the changes seen on T1WI, while non-responders typically did not show signal changes on early or follow up MRI (Fig. 1).

Tumor signal intensity on T1WI and T2WI after Sorafenib treatment for three months in a 64-year-old man with HCC. (A) T1WI after sorafenib treatment. Note hyperintensity of HCC mass (arrow). This signal intensity is believed to be the result of hemorrhagic necrosis. (B) On T2WI, mass shows hypointensity (arrow) after Sorafenib treatment.
In the early acute phase (< I week into therapy), transformation of intracellular deoxyglobin to methemoglobin leads to the high signal intensity on T1W1 and low signal on T2WI, while in the subacute phase (first few weeks into therapy), presence of extracellular methemoglobin results in high signal on both T1WI and T2WI. This phase with its inherent contrast between tumor and native liver, accurately demonstrates Sorafenib-induced intratumoral hemorrhage.2
Changes in tumor enhancement on MRI
HCCs demonstrate hypervascularity by the process of neo-angiogenesis. Tumor angiogenesis is critical for growth of this tumor as well as metastatic spread, therefore imaging and quantification of tumor neo-angiogenesis is essential for predicting disease progression and response to targeted therapy.
Tumor enhancement on arterial phase of MRI or computed tomography (CT) reflects the degree of neo-angiogenesis. Since Sorafenib has an anti-angiogenic effect, it can affect the degree of tumoral enhancement on imaging.
Following treatment with Sorafenib, HCC typically shows a decrease in arterial phase enhancement following treatment with declining enhancing fraction (Fig. 2). Decreased tumor enhancement following Sorafenib treatment on contrast enhanced CT has been previously reported.3 MRI has a distinct advantage over CT in assessing tumoral enhancement due fact that the enhancement effects of MRI contrast agents are more robust compared to CT contrast agents, and obscured enhancement by previously deposited iodized oil (lipiodol) is not confounding on MRI as it is on CT.
Decreasing tumor enhancement on arterial phase after Sorafenib treatment in a 67-year-old man with HCC. (A) Before Sorafenib treatment, HCC shows arterial enhancement (arrow). (B) Decreased of enhancement of the tumor (arrow) is noted on arterial phase without overall change of tumor size following 12 weeks of Sorafenib therapy.
Internal enhancement of the tumor assessed on noncontrast and post-gadolinium T1WI can therefore accurately assess response to therapy. In the majority of patients, tumor necrosis is apparent as non-enhancement of previously enhancing tumor with increased ratio of necrotic to viable tumor. However, in a small percentage of patients, there may be a relevant (> 20%) increase in tumor volume which can lead to misdiagnosis of tumor progression to the inexperienced.2
Novel oncologic therapies such as Sorafenib require a revision of existing response criteria to accurately assess tumor response. During treatment with anti-angiogenic therapy, intratumoral necrosis and devascularization are key changes. The traditional imaging criteria used internationally for measuring tumor response include the Response Evaluation Criteria In Solid Tumors (RECIST) and the World Health Organization (WHO) criteria. In targeted therapies like Sorafenib, these size dependent criteria are unreliable in assessing tumor response since they do not account for enhancement and necrosis characteristics. These criteria may actually underestimate or misrepresent response in HCC.
Revised evaluation criteria were developed for response evaluation of HCC treatments, including modified Response Evaluation Criteria In Solid Tumors (mRECIST).4 mRECIST considers only arterial enhancing areas in HCC as viable tumor components and nonenhancing portions as treated, necrotic areas. According to mRECIST, treatment response is analyzed by estimating the reduction in the enhancing viable portion. Several studies report the usefulness of mRECIST for the assessment of tumor response in patients with advanced HCC treated with Sorafenib.5,6
Changes on diffusion-weighted imaging
Diffusion-weighted imaging (DWI) and apparent diffusion coefficient (ADC) maps can be used as predictors of early response after Sorafenib and distinguishing early responders from non-responders. Necrosis and cystic degeneration following Sorafenib lead to decreased tumor cellularity and altered cell membrane integrity. This leads to less diffusion restriction on DWI and increased ADC values (Fig. 3). DWI is therefore of value in monitoring treatment response following this agent. HCCs show characteristic ADC changes during the course of Sorafenib therapy. Initially there is a decrease in ADC for a few weeks followed by a slow re-increase for months. The early ADC changes are likely secondary to hemorrhagic tumor necrosis, tumor cell swelling due to ischemia and decreased extracellular space induced by this therapy. The later re-increase may indicate decreasing tumor cellularity, cell collapse and enlargement of the extracellular space in follow-up imaging. The slow-going re-decrease of ADC in the long term follow-up examinations may indicate tumor reactivation and restored tumor cellularity. A word of caution; diffusion-weighted images should always be interpreted in conjunction with the T1WI, to avoid the confounding effects of hemorrhage on ADC.7,8
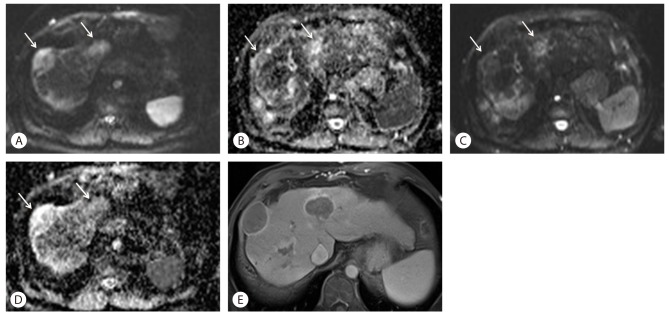
Changes of DWI and ADC values following Sorafenib treatment in a 57-year-old woman with HCC. (A) On DWI with high b-value of 1,000 before treatment, two high signal tumors are noted in S8 and S4 (arrows). (B) An ADC map before treatment shows low signal intensity lesions at the same area (arrows), which means low ADC values. (C) After 4-month treatment with Sorafenib, signal intensity of HCC (arrows) on DWI with b-value of 1,000 was markedly decreased compared to (A). (D) An ADC map after Sorafenib treatment also shows improved diffusion with higher signal (arrows). (E) Axial, enhanced, portal venous phase image after Sorafenib treatment shows marked necrosis of tumors, which is the cause of increased ADC values and lower signal intensity on DWI.
The role of DWI for the evaluation of HCC response to Sorafenib is gaining importance. Theoretically, ADC is affected by two factors: Fast moving "perfusion" fraction with low b-values and the slow moving "diffusion" fraction with high b-values. In a study by Lewin, et al., perfusion fraction was a significant marker for overall survival, but diffusion fraction and ADC did not significantly correlate with overall survival or time to progression.9 Therefore, the findings on DWI and ADC values should be interpreted with caution.
Changes on dynamic contrast enhancement MRI
Dynamic contrast enhanced MRI (DCE-MRI) is a non-invasive, imaging method for quantitative measuring changes of blood flow, blood volume in the interstitial and intravascular space and vessel permeability. DCE-MRI differs from a conventional multiphase, contrast enhanced study in that numerous sets of dynamic post contrast images are rapidly acquired for analyzing blood flow. A commonly used parameter of DCE MRI is Ktrans, which refers to the volume transfer constant reflecting changes in vascular permeability. On DCE-MRI in HCC treated with Sorafenib, changes in Ktrans can be seen as early as 2 weeks after therapy and Ktrans measured by DCE-MRI correlates well with tumor response and survival in these patients. Percentage of Ktrans change after treatment may therefore be an independent predictor of tumor response and overall survival.10
CONCLUSION
Imaging features on MRI following treatment of advanced HCC with Sorafenib may reflect and parallel pathophysiologic changes within these tumors. Since tumor response after treatment with molecular targeted agents may not correlate with a change in tumor size, classic, size based imaging criteria for assessment of tumor response may not be appropriate in these patients.
Liver MRI is advantageous for evaluating tumor response in this situation and early findings of liver MRI after Sorafenib treatment in HCC can be adopted as biomarkers for differentiating responders from non-responders following treatment with molecular targeting agents.
Acknowledgement
This work was supported in part by The GlaxoSmithKline Research Fund of the Korean Association for the study of the Liver.
Notes
The authors have no conflicts to disclose.
Abbreviations
ADC
apparent diffusion coefficient
CT
computed tomography
DCE-MRI
dynamic contrast enhanced MRI
DWI
diffusion-weighted imaging
HCC
hepatocellular carcinoma
mRECIST
modified Response Evaluation Criteria In Solid Tumors
MRI
magnetic resonance imaging
T1WI
T1 weighted images
T2WI
T2 weighted images
RECIST
response evaluation criteria in solid tumors