Hepatitis B surface antigen levels at 6 months after treatment can predict the efficacy of lamivudine-adefovir combination therapy in patients with lamivudine-resistant chronic hepatitis B
Article information
Abstract
Background/Aims
Quantitation of hepatitis B surface antigen (HBsAg) is an increasingly popular method to determine the treatment response in chronic hepatitis B (CHB) patients. The clinical value of HBsAg level measurement during rescue therapy for lamivudine (LMV)-resistant CHB patients have not been evaluated to date. Therefore, this study investigated the correlation between HBsAg level and treatment response in LMV-resistant CHB patients treated with adefovir (ADV) add-on therapy.
Methods
LMV-resistant CHB patients treated with LMV-ADV combination therapy for over 2 years were included. HBsAg levels were measured at 6 month intervals until 1 year, and annually thereafter. Treatment response was assessed by determining the virological response (VR, undetectable HBV DNA levels) during treatment.
Results
Fifty patients were included, of which 40 showed a VR. HBsAg levels were not different significantly at baseline (4.0 vs. 3.6 Log10 IU/mL, P=0.072). However, the HBsAg level decreased after 6 months of treatment in patients with a VR and became different significantly between the groups thereafter (3.9 vs. 3.3 at 6 months, P=0.002; 3.8 vs. 3.2 at 1 year, P=0.004; 3.9 vs. 3.2 at 2 years, P=0.008; 3.7 vs. 3.1 at 3 years, P =0.020).
Conclusions
The HBsAg level at 6 months after treatment can help predict treatment response.
INTRODUCTION
Quantitation of hepatitis B surface antigen (HBsAg) is an increasingly popular method to determine the treatment response in chronic hepatitis B (CHB) patients. Measurement of serum HBsAg levels during treatment may help identify sustained responders to pegylated interferon therapy more reliably than measurement of serum hepatitis B virus (HBV) DNA1. HBsAg kinetics is different during pegylated interferon and nucleoside analog therapy2. Although HBsAg levels remain unchanged during lamivudine (LMV) treatment, recent studies report an association between a reduction of serum HBsAg level and viral suppression after entecavir (ETV) treatment.3,4,5 However, these studies involved treatment-naïve patients with CHB. Moreover, the clinical value of HBsAg level measurement during rescue therapy for lamivudine (LMV)-resistant CHB patients have not been evaluated.
Therefore, this study investigated the correlation between the HBsAg level and treatment response in LMV-resistant CHB patients treated with adefovir (ADV) add-on therapy.
METHODS
Patients
LMV-resistant CHB patients who were treated with LMV-ADV combination therapy for over 2 years at Konkuk University Medical Center were included in this study. Their medical records were reviewed, and their HBsAg levels were measured at 6 month intervals until 1 year, and annually thereafter. Data were censored if patients had a change in treatment, died due to liver-related or other causes, were lost to follow up, or underwent liver transplantation. The final follow up visit was in August 2012. The clinical diagnosis of liver cirrhosis was performed based on imaging findings, using modalities such as abdominal ultrasonography, computed tomography or magnetic resonance imaging, together with clinical findings consistent with liver cirrhosis such as esophageal or gastric varices, ascites, hepatic encephalopahy and thrombocytopenia.
All patients provided written informed consent for CHB treatment and the storage of remnant serum samples. This study was approved by the Institutional Review Board of Konkuk University Medical Center.
HBsAg levels measurement and evaluation of treatment response
Serum samples were serially collected from each patient when rescue treatment with LMV-ADV combination was initiated and every 3 months thereafter; all samples were frozen and stored at -80℃.
HBsAg levels in the stored samples were measured at baseline, 6 months, and annually from 1 year to 5 years after treatment, using a chemiluminescent microparticle immunoassay (Architect HBsAg QT, Abbott Diagnostics, Chicago, IL, USA; Measurable range 0.05 - 250 IU/mL). HBsAg was quantified at a 1:500 dilution according to the manufacturer's instruction. To bring HBsAg levels within the measurable range, samples with above and below this range required a lower and higher dilution, respectively.
HBV DNA levels were also measured by using real-time polymerase chain reaction (PCR) (Cobas Amplicor PCR, Roche Molecular Systems, Inc., Branchburg, NJ, USA; lower detection limit, 20 IU/mL). Alanine aminotransferase (ALT), bilirubin, hepatitis B 'e' antigen (HBeAg) and antibody to HBeAg (anti-HBeAg) were measured.
Virological response (VR) was defined as undetectable HBV DNA by real-time PCR, and LMV-resistance was detected using restriction fragment mass polymorphism (RFMP) method, as described previously.6
Statistical analysis
Continuous and categorical variables are expressed as means ± standard deviations and numbers (percentiles) respectively. The correlation between HBsAg and HBV DNA titers at baseline was analyzed by calculating Pearson's correlation coefficient. Groups were divided according to VR and compared using the chi-square test or Fisher's exact test for categorical variables and the Student t-test for continuous variables. The area under the receiver operating characteristic (AUROC) curve of the HBsAg level at 6 months, 1 year, 2 years and 3 years was calculated for predicting VR; AUROC were compared using DeLong's test.7 The Youden index was calculated to choose the optimal cutoff value for VR. Kaplan-Meier analysis with the log-rank test was used to validate this cutoff value. The level of significance was set at P<0.05. SPSS version 17.0 (SPSS Inc., Chicago, IL, USA) and MedCalc 12.7.0 (Medcalc Software, Mariakerke, Belgium) were used for statistical analysis.
RESULTS
Baseline characteristics
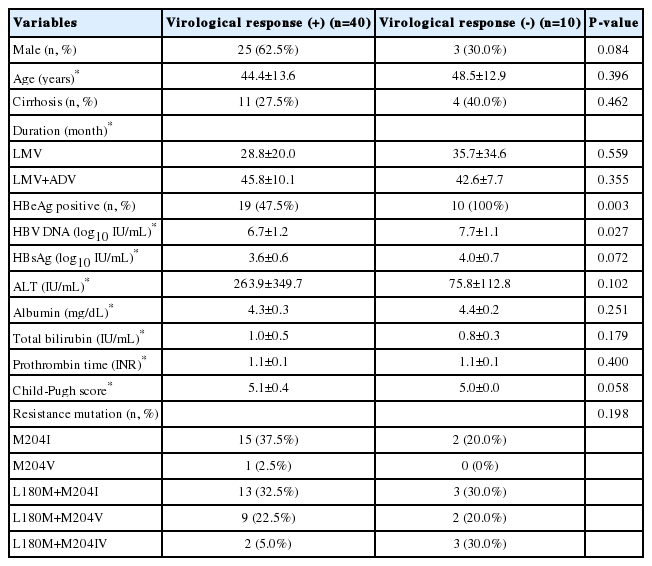
Fifty patients were included, of which 40 achieved virological response. All patients who did not achieve a VR were HBeAg positive (P =0.003) and had high HBV DNA levels at baseline (7.7 vs. 6.7 Log10 copies/mL, P=0.027) (Table 1).
The correlation between HBsAg and HBV DNA levels at baseline
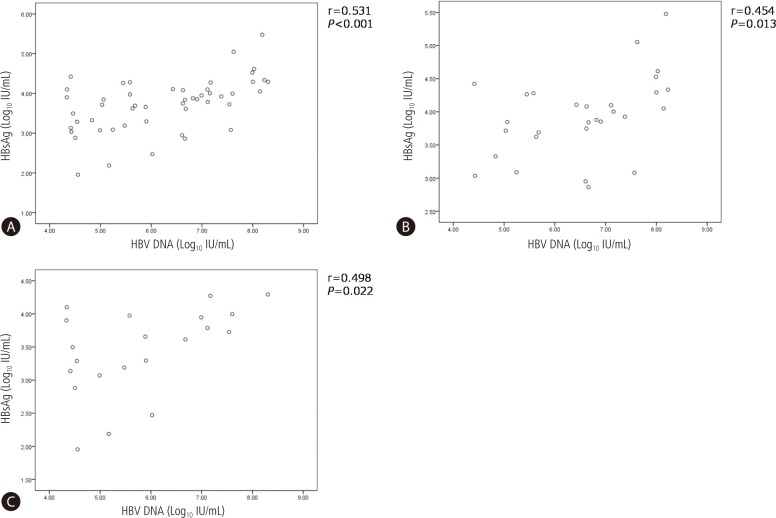
HBsAg and HBV DNA levels were well correlated (r=0.531, P<0.001), both in HBeAg positive patients (r=0.454, P=0.013) and HBeAg negative patients (r=0.498, P=P0.022) (Fig. 1).
On treatment HBsAg and HBV DNA levels
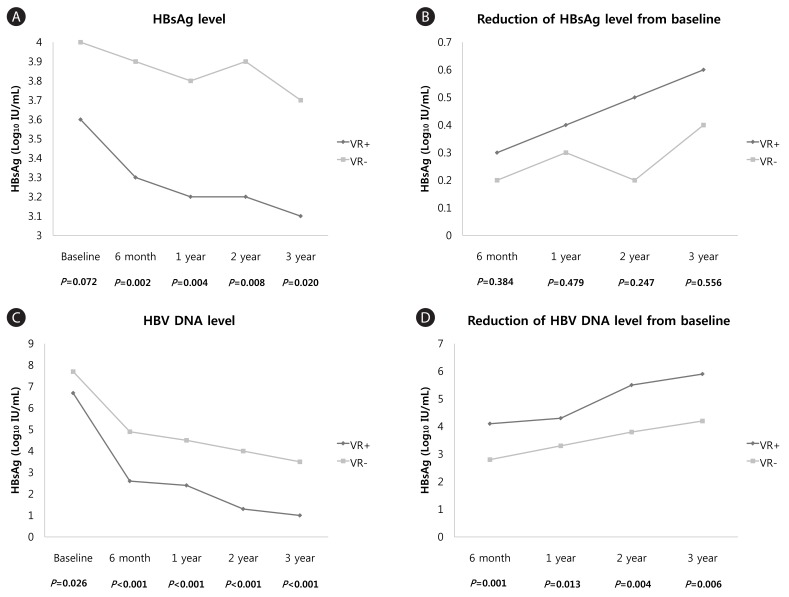
Baseline HBsAg levels were not different significantly between patients without a VR and those with a VR (4.0 vs. 3.6 Log10 IU/mL, P=0.072). However, HBsAg levels decreased after 6 months of treatment in patients who showed a VR and differed significantly between groups thereafter (3.9 vs. 3.3 at 6 months, P=0.002; 3.8 vs. 3.2 at 1 year, P=0.004; 3.9 vs. 3.2 at 2 years, P=0.008; and 3.7 vs. 3.1 at 3 years, P=0.020). The mean reduction in HBsAg levels from baseline was not different significantly between the two groups. The mean HBV DNA levels and reduction in HBV DNA levels from baseline were significantly different through entire time point (Table 2, Fig. 2).
Analysis according to VR within 1 year and 2 year, and HBeAg status
Thirty nine patients were HBeAg positive and 21 were negative. Twenty nine patients achieved VR within 1 year (eleven of HBeAg positive patients and eighteen patients of HBeAg negative patients). HBsAg level at baseline was not significantly different according to VR (3.6 vs. 3.9 Log10 copies/mL, P=0.106), but became lower in patients with VR at 6 months (3.3 vs. 3.6 Log10 copies/mL, P=0.044) and 1 year (3.2 vs. 3.6 Log10 copies/mL, P=0.006). HBV DNA level also showed significant differences at 6 months (2.3 vs. 4.2 Log10 IU/mL, P<0.001) and 1 year (2.1 vs. 3.9 Log10 IU/mL, P<0.001), but not at baseline (6.6 vs. 7.3 Log10 IU/mL, P=0.058). On subanalysis according to HBeAg status, HBsAg levels at baseline, 6 months and 1 year were not different according to VR or not, in both HBeAg positive and negative patients. HBV DNA levels have become significantly lower in patients with VR at 6 months (2.4 vs. 4.3 Log10 IU/mL, P<0.001) and at 1 year (2.2 vs. 3.9 Log10 IU/mL, P<0.001) in HBeAg positive, and at baseline (6.2 vs. 8.0 Log10 IU/mL, P=0.025) and at 1 year in HBeAg negative group (2.0 vs. 3.7 Log10 IU/mL, P=0.007).
Thirty six patients achieved VR within 2 years (fifteen of HBeAg positive patients and all of HBeAg negative patients). HBsAg level was significantly lower in patients with VR at 6 months (3.3 vs. 3.8 Log10 IU/mL, P=0.001), 1 year (3.2 vs. 3.7 Log10 IU/mL, P=0.005) and 2 years (3.2 vs. 3.8 Log10 IU/mL, P=0.008). HBV DNA level also significantly lower in patients with VR at 6 months (2.6 vs. 4.7 Log10 IU/mL, P<0.001), 1 year (2.4 vs. 4.3 Log10 IU/mL, P<0.001) and 2 year (1.2 vs. 3.7 Log10 IU/mL, P<0.001). Because all of HBeAg negative patients achieved VR, only subanalysis for HBeAg positive patients were performed. HBsAg level was significantly lower in HBeAg positive VR group at 6 months (3.4 vs. 3.8 Log10 IU/mL, P=0.026). HBV DNA levels were lower in HBeAg positive VR group at 6 months (3.0 vs. 4.7 Log10 IU/mL, P<0.001), 1 year (2.6 vs. 4.3 Log10 IU/mL, P<0.001) and 2 years (1.5 vs. 3.7 Log10 IU/mL, P<0.001). (Table 3)
AUROCs of HBsAg levels
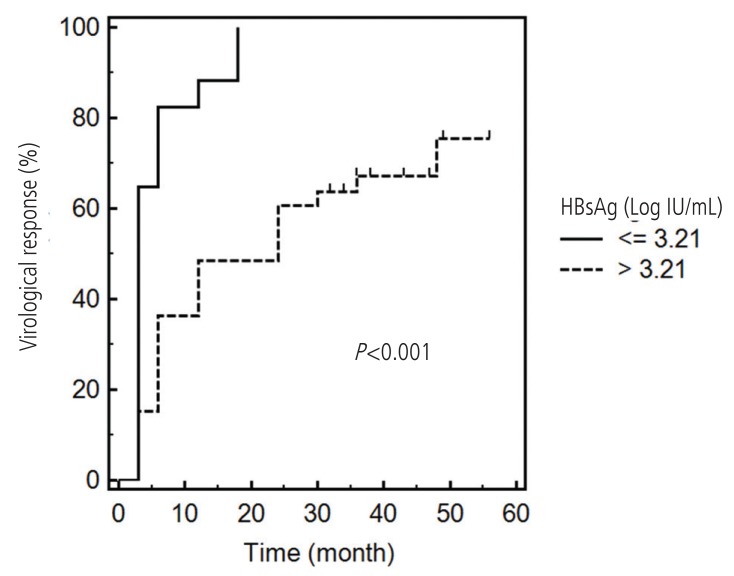
The AUROCs of HBsAg levels at 6 months, 1 year and 2 years were 0.770, 0.781, and 0.768, respectively (Fig. 3). These values did not significantly differ (Table 4). With a cutoff value of 3.21 Log10 IU/mL for HBsAg at 6 months, the sensitivity and specificity for predicting a VR were estimated to be 45.0% and 100%, respectively, and the Youden index was 0.45. Kaplan-Meier analysis with the log-rank test showed a significance of difference in the VR rate according to this cutoff value (P<0.001, Fig. 4).
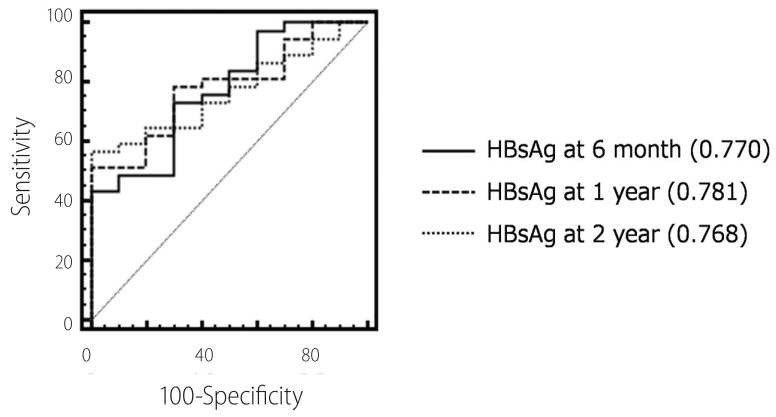
Areas under the receiver operating characteristics curve (AUROCs) of HBsAg levels at each time point for virological response.
DISCUSSION
CHB is an important cause of mortality and morbidity worldwide, accounting for up to 1 million deaths annually.8 HBV infection is also the one of the most common etiology of chronic liver disease in Korea.9 Although the prevalence of chronic HBV infection is decreasing, this plays a major role in the etiology of liver cirrhosis and hepatocellular carcinoma in Korea.10
HBsAg has been the hallmark of HBV infection since the 1960s.11 Several studies have shown a clear correlation between serum HBsAg level and covalently closed circular DNA (cccDNA)12,13,14 Studies using newly available automated quantitative assays have shown that serum levels of HBsAg are inversely proportional to the immune response against HBV, i.e., greater the immune response, lower the HBsAg level.15 Furthermore, several studies have shown that the decrease in serum HBsAg levels during pegylated interferon treatment mimics that in intrahepatic cccDNA, suggesting that a decrease in the serum HBsAg level is associated with the induction of an effective immune response.16,17,18 In contrast, treatment with nucleoside analogs may induce a marked decrease in HBV DNA levels; however, their effect on the serum level of HBsAg is limited, and the decrease in the HBsAg level during treatment is slower than the decrease in HBV DNA.3,19,20,21 Therefore, the clinical use of monitoring HBsAg levels in nucleoside analogs treatment for CHB patients is limited.15 Several studies show a correlation between the HBsAg level and treatment response during nucleoside analog treatment; however, these studies are limited by their small sample size.3,4,5 To our knowledge, the present study is the first to evaluate the possibility of a correlation between HBsAg levels and treatment response during rescue therapy for LMV-resistant CHB patients. In the present study, levels of HBsAg were significantly lower in patients with a VR and AUROCs were not different at the different time points. Therefore, the HBsAg level at 6 months after treatment was sufficient to predict a VR. The results of Kaplan-Meier analysis corroborate this finding. Lee et al. showed baseline HBsAg level is useful in predicting VR.5 Although baseline HBsAg level was not significant value in our study, there was the tendency of lower in patients with VR (3.6 vs. 4.0, P=0.072). This became more prominent at 6 months. Both studies are limited by a small number of cases, and response pattern in treatment experienced patients may differ with naïve patients. Further study is warranted for this point of view.
In the present study, HBeAg negative patients were all achieved VR within 2 years. Therefore, the value of HBsAg level is higher for HBeAg positive patients. In HBeAg positive patients, HBsAg level was not significantly different according to VR within 1 year, but HBsAg level at 6 months became significant in the analysis for VR within 2 years. We can assume that HBsAg level is more profit for prediction of long term treatment response in comparison with HBV DNA level.
Current treatment guidelines suggest ETV or tenofovir (TDF) as the first-line antiviral agent for the CHB treatment.22,23,24 ETV and TDF have been available in Korea since 2007 and 2011, respectively. Therefore, majority of patients who started treatment before this period received LMV as first-line treatment and subsequently developed resistance. The proportions of patients with observed resistance who were treated with LMV for >1 and >4 years are reported to be 24% and 70% respectively.25 If LMV resistance develops, current guidelines recommend a combination of nucleoside and nucleotide analogs as rescue therapy.22,23,24 LMV-ADV combination therapy is the current most commonly used strategy and is superior to both ETV monotherapy and ADV monotherapy.26,27,28,29,30,31,32 However, some patients fail to achieve a VR with this combination and require more potent treatment. HBsAg quantitation can be helpful in determining whether a drug change is warranted in such cases.
Many studies report a good correlation between HBsAg and HBV DNA levels in treatment-naïve CHB patients33,34,35,36 However, this correlation has not been evaluated in LMV-resistant patients. The HBV polymerase gene mutation can alter the amino acid codon sequences of the surface region and vice versa, because the polymerase gene has overlapping reading frames with the surface genes. Therefore, selection of a drug-resistant HBV polymerase gene mutation may have important implications37,38 The P120A mutation in the surface region results in a failure to detect HBsAg in LMV-treated patients.39 The rtV173L (sE164D), one of LMV-resistant polymerase mutation, is reported to reduce the antigenicity of HBsAg.40 The results of the present study demonstrate a good correlation between HBsAg and HBV DNA levels. Therefore, it can be assumed HBsAg kinetics is similar to that in treatment-naïve cases and that the clinical implications of LMV-resistant polymerase mutations on HBsAg levels are limited. However, HBsAg quantitation studies on other types of resistance mutations remain limited. The overlap of surface region mutations, such as sW172stop in patients carrying rtA181T, and sL173F in patients carrying rtA181V, has been reported in CHB patients treated with ADV. However, the clinical consequences of these mutations have not been determined.37,41 One study reported no significant difference in the levels of HBsAg in such patients, but the study had a small sample size; therefore, this point requires further evaluation.42
In conclusion, HBsAg levels at 6 months of LMV-ADV combination therapy can help predict treatment response. More potent treatments should be considered for cases positive for HBeAg, with high baseline HBV DNA and high HBsAg levels after 6 months treatment.
Notes
No potential conflict of interest relevant to this article was reported.
Abbreviations
HBsAg
hepatitis B surface antigen
CHB
chronic hepatitis B
LMV
lamivudine
ADV
adefovir
VR
virological response
ETV
entecavir
PCR
polymerase chain reaction
ALT
alanine aminotransferase
HBeAg
hepatitis B 'e' antigen
RFMP
restriction fragment mass polymorphism
