| Clin Mol Hepatol > Volume 27(2); 2021 > Article |
|
ABSTRACT
Background/Aims
Methods
Results
FOOTNOTES
SUPPLEMENTAL MATERIAL
Supplementary┬ĀTable┬Ā1.
Supplementary┬ĀTable┬Ā2.
Supplementary┬ĀTable┬Ā3.
Supplementary┬ĀFigure┬Ā1.
Supplementary┬ĀFigure┬Ā2.
Supplementary┬ĀFigure┬Ā3.
Supplementary┬ĀFigure┬Ā4.
Supplementary┬ĀFigure┬Ā5.
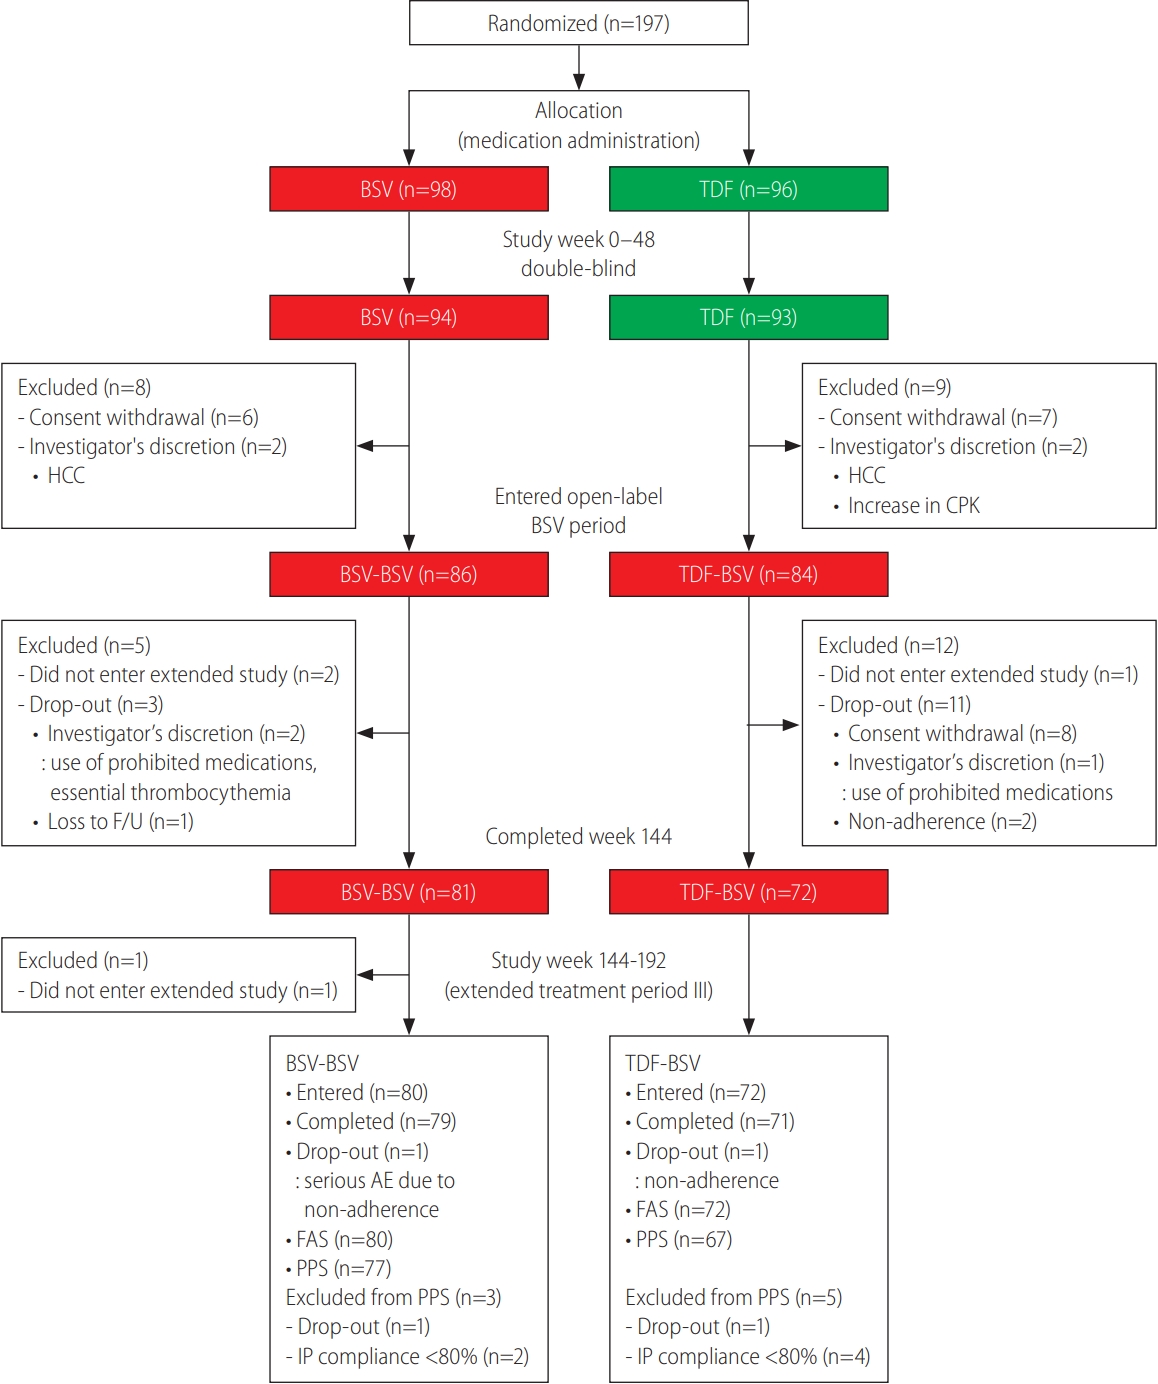
Figure┬Ā1.

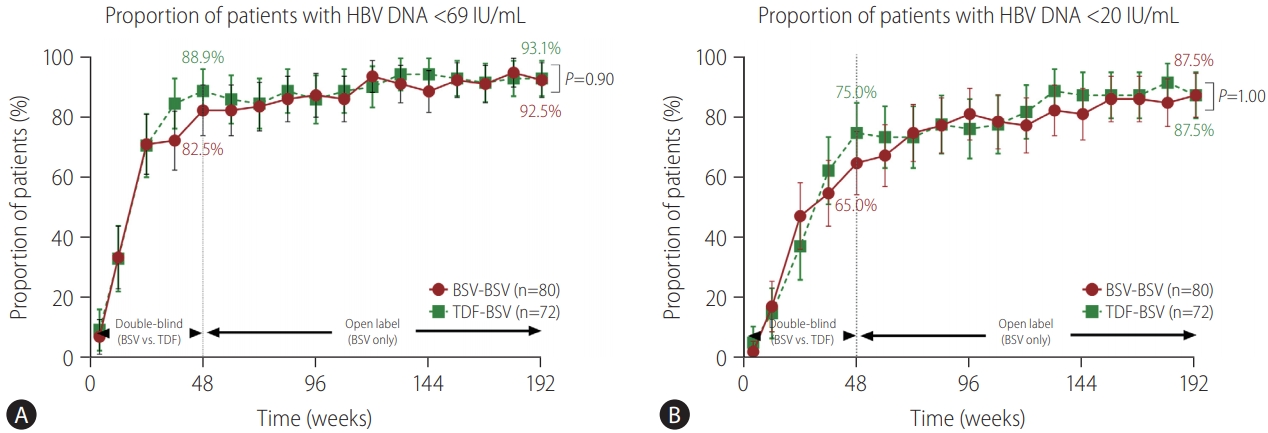
Figure┬Ā2.

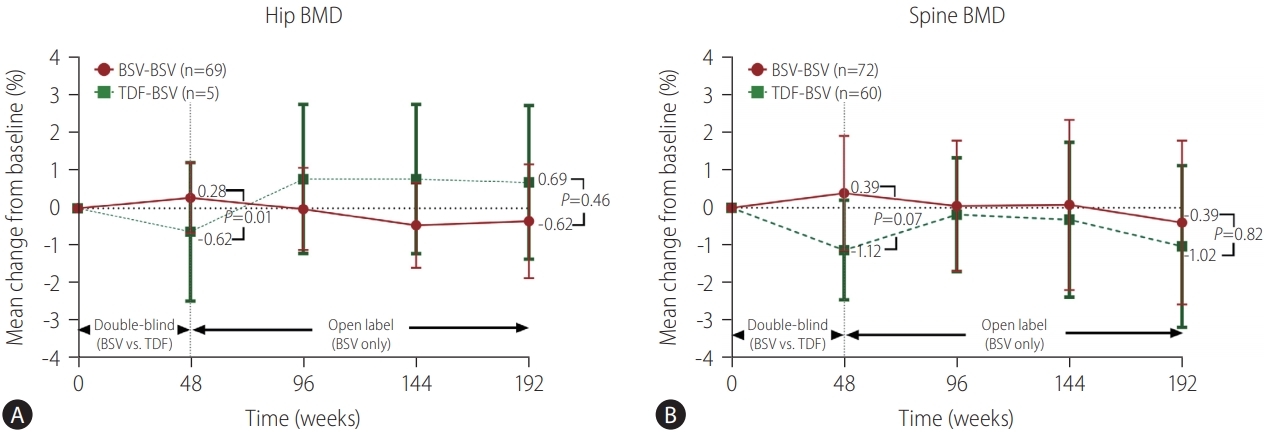
Figure┬Ā3.

Figure┬Ā4.

Table┬Ā1.
| BSV-BSV (n=80) | TDF-BSV (n=72) | P-value | |
|---|---|---|---|
| Male | 53 (66.3) | 46 (63.9) | 0.76 |
| Age (years) | 46.16 (10.8) | 44.04 (9.9) | 0.21 |
| HBeAg positive | 50 (62.5) | 40 (55.6) | 0.38 |
| HBV genotype | 0.86 | ||
| ŌĆāA | 1 (1.3) | 0 | |
| ŌĆāC | 78 (97.5) | 71 (98.6) | |
| ŌĆāD | 0 (0.0) | 1 (1.4) | |
| Not determined | 1 (1.3) | 0 (0.0) | |
| HBV DNA (log10 IU/mL) | 6.31 (1.7) | 6.55 (1.5) | 0.35 |
| ALT (U/L) | 105.6 (102.1) | 127.4 (143.7) | 0.38 |
| ALT normal* by central laboratory criteria | 4 (5.0) | 6 (8.3) | 0.52 |
| BMI (kg/m2) | 0.05 | ||
| ŌĆāNormal, <25 kg/m2 | 53 (66.3) | 49 (68.1) | |
| ŌĆāOverweight, Ōēź25 to Ōēź30 kg/m2 | 25 (31.3) | 15 (20.8) | |
| ŌĆāObese, >30 kg/m2 | 2 (2.5) | 8 (11.1) | |
| eGFR by MDRD (mL/min) | 89.5 (14.6) | 92.4 (13.9) | 0.22 |
| Creatinine (mg/dL) | 0.86 (0.2) | 0.83 (0.1) | 0.31 |
| Phosphate (mg/dL) | 3.53 (0.5) | 3.45 (0.6) | 0.56 |
| Fib-4 score | 2.14 (2.08) | 1.91 (1.14) | 0.98 |
| Total hip BMD clinical statusŌĆĀ | 0.88 | ||
| ŌĆāNormal, T-score Ōēź-1.0 | 57 (82.6) | 46 (83.6) | |
| ŌĆāOsteopenia, -2.5Ōēż T-score <-1.0 | 12 (17.4) | 9 (16.4) | |
| ŌĆāOsteoporosis, T-score <-2.5 | 0 (0.0) | 0 (0.0) | |
| ŌĆāData not collected | 11 | 17 | |
| Spine BMD clinical status | 0.71 | ||
| ŌĆāNormal, T-score Ōēź-1.0 | 49 (68.1) | 39 (65.0) | |
| ŌĆāOsteopenia, -2.5Ōēż T-score <-1.0 | 19 (26.4) | 19 (31.7) | |
| ŌĆāOsteoporosis, T-score <-2.5 | 4 (5.6) | 2 (3.3) | |
| ŌĆāData not collected | 8 | 12 | |
| Concurrent medical history | |||
| ŌĆāMild renal impairmentŌĆĪ | 44 (55.0) | 33 (45.8) | 0.26 |
| ŌĆāCirrhosis | 19 (23.8) | 13 (18.1) | 0.39 |
| ŌĆāDiabetes mellitus | 10 (12.5) | 3 (4.2) | 0.07 |
| ŌĆāHypertension | 10 (12.5) | 9 (12.5) | 1.00 |
| Prior antiviral therapy | 0 | 1 (1.4) | 0.47 |
Values are presented as number (%), n/N (%), or mean (standard deviation) unless otherwise stated.
P-value: two-sample t test or Wilcoxon rank-sum test for continuous variables, and chi-square test or FisherŌĆÖs exact test for categorical variables.
BSV, besifovir dipivoxil maleate; TDF, tenofovir disoproxil fumarate; HBeAg, hepatitis B e antigen; HBV, hepatitis B virus; ALT, alanine aminotransferase; BMI, body mass index; eGFR, estimated glomerular filtration rate; MDRD, modification of diet in renal disease; Fib-4, fibrosis-4; BMD, bone mineral density.
Table┬Ā2.
|
FAS |
PPS |
|||||
|---|---|---|---|---|---|---|
| BSV-BSV (n=80) | TDF-BSV (n=72) | P-value | BSV-BSV (n=77) | TDF-BSV (n=67) | P-value | |
| HBV DNA <69 IU/mL | 74 (92.5) | 67 (93.1) | 0.90 | 73 (94.8) | 63 (94.0) | 1.00 |
| HBV DNA <20 IU/mL | 70 (87.5) | 63 (87.5) | 1.00 | 69 (89.6) | 59 (88.1) | 0.77 |
| HBeAg loss*,ŌĆĀ | 16/49 (32.7) | 14/40 (35.0) | 0.82 | 14/47 (29.8) | 14/37 (37.8) | 0.44 |
| HBeAg seroconversion*,ŌĆĀ | 5/49 (10.2) | 5/40 (12.5) | 0.75 | 3/47 (6.4) | 5/37 (13.5) | 0.29 |
| HBsAg lossŌĆĀ,ŌĆĪ | 0/79 (0.0) | 1/72 (1.4) | 0.48 | 0/77 (0.0) | 1/67 (1.5) | 0.47 |
| HBsAg seroconversionŌĆĀ,ŌĆĪ | 0/79 (0.0) | 1/72 (1.4) | 0.48 | 0/77 (0.0) | 1/67 (1.5) | 0.47 |
| ALT normalization┬¦ | 71 (88.8) | 67 (93.1) | 0.36 | 69 (89.6) | 62 (92.5) | 0.54 |
Values are presented as n/N (%) or number (%).
P-value: PearsonŌĆÖs chi-squared test or FisherŌĆÖs exact test.
FAS, full analysis set; PPS, per protocol set; BSV, besifovir dipivoxil maleate; TDF, tenofovir disoproxil fumarate; HBV, hepatitis B virus; HBeAg, hepatitis B envelope antigen; HBsAg, hepatitis B surface antigen; ALT, alanine aminotransferase.
Table┬Ā3.
|
HBeAg-positive patients (n=90) |
HBeAg-negative patients (n=62) |
|||||
|---|---|---|---|---|---|---|
| BSV-BSV (n=50) | TDF-BSV (n=40) | P-value | BSV-BSV (n=30) | TDF-BSV (n=32) | P-value | |
| HBV DNA <69 IU/mL | 44 (88.0) | 35 (87.5) | 1.00 | 30 (100.0) | 32 (100.0) | ŌĆō |
| HBV DNA <20 IU/mL | 40 (80.0) | 32 (80.0) | 1.00 | 30 (100.0) | 31 (96.9) | 1.00 |
| HBeAg loss*,ŌĆĀ | 16/49 (32.7) | 14/40 (35.0) | 0.82 | ŌĆō | ŌĆō | ŌĆō |
| HBeAg seroconversion*,ŌĆĀ | 5/49 (10.2) | 5/40 (12.5) | 0.75 | ŌĆō | ŌĆō | ŌĆō |
| HBsAg lossŌĆĀ,ŌĆĪ | 0/49 (0) | 1/40 (2.5) | 0.45 | 0/30 (0) | 0/32 (0) | ŌĆō |
| HBsAg seroconversionŌĆĀ,ŌĆĪ | 0/49 (0) | 1/40 (2.5) | 0.45 | 0/30 (0) | 0/32 (0) | ŌĆō |
| ALT normalization┬¦ | 42 (84.0) | 37 (92.5) | 0.33 | 29 (96.7) | 30 (93.8) | 1.00 |
Values are presented as n/N (%) or number (%).
P-value: PearsonŌĆÖs chi-squared test or FisherŌĆÖs exact test.
HBeAg, hepatitis B envelope antigen; FAS, full analysis set; BSV, besifovir dipivoxil maleate; TDF, tenofovir disoproxil fumarate; HBV, hepatitis B virus; HBsAg, hepatitis B surface antigen; ALT, alanine aminotransferase.
Table┬Ā4.
| Variable |
0ŌĆō192 weeks |
||
|---|---|---|---|
| BSV-BSV (n=80) | TDF-BSV (n=72) | P-value | |
| Adverse events | 69 (86.3) | 57 (79.2) | 0.25 |
| Adverse drug reactions | 38 (47.5) | 35 (48.6) | 0.89 |
| Serious adverse events | 12 (15.0) | 9 (12.5) | 0.66 |
| Serious adverse drug reactions | 2 (2.5) | 2 (2.8) | 1.00 |
| Serious adverse events leading to drug discontinuation | 1 (1.3) | 0 (0.0) | 1.00 |
| Death | 0 (0.0) | 0 (0.0) | - |
| Adverse drug reaction recorded in Ōēź3% of all patients | |||
| ŌĆāNasopharyngitis | 2 (2.5) | 3 (4.2) | 0.67 |
| ŌĆāDyspepsia | 3 (3.8) | 6 (8.3) | 0.31 |
| ŌĆāOsteopenia | 1 (1.3) | 5 (6.9) | 0.10 |
| ŌĆāAlanine aminotransferase increased | 4 (5.0) | 3 (4.2) | 1.00 |
| ŌĆāHeadache | 4 (5.0) | 1 (1.4) | 0.37 |
| ŌĆāDizziness | 3 (3.8) | 0 (0.0) | 0.25 |
| ŌĆāSomnolence | 3 (3.8) | 1 (1.4) | 0.62 |
| ŌĆāFatigue | 2 (2.5) | 4 (5.6) | 0.42 |
| ŌĆāPruritus | 1 (1.3) | 4 (5.6) | 0.19 |
| ŌĆāBenign hepatic nodules | 3 (3.8) | 1 (1.4) | 0.62 |
| ŌĆāHypertension | 5 (6.3) | 0 (0.0) | 0.06 |
| Renal related adverse events | |||
| ŌĆāProteinuria | 0 (0.0) | 1 (1.4) | 0.47 |
| ŌĆāPhosphate <2.5 mg/dL | 10 (12.5) | 15 (20.8) | 0.17 |
| ŌĆāeGFR <50 mL/min | 1 (1.3) | 2 (2.8) | 0.60 |
| ŌĆāSerum creatinine increase Ōēź0.5 mg/dL above baseline | 0 (0.0) | 1 (1.4) | 0.47 |
| Bone-related adverse events | |||
| ŌĆāFracture | |||
| ŌĆāSpontaneous* | 1 (1.3) | 0 (0.0) | 1.00 |
| ŌĆāTraumatic | 4 (5.0) | 1 (1.4) | 0.37 |
| Dyslipidemia | |||
| ŌĆāTriglyceride, above 300 mg/dL | 0 (0.0) | 0 (0.0) | - |
| ŌĆāTotal cholesterol, above 300 mg/dL | 0 (0.0) | 0 (0.0) | - |
| Total carnitine level at week 192ŌĆĀ | |||
| ŌĆāLow | 2 (2.5) | 5 (6.9) | 0.26 |
| ŌĆāHigh | 10 (12.5) | 7 (9.7) | 0.59 |
Abbreviations
REFERENCES
- TOOLS
-
METRICS

- ORCID iDs
-
Soon Ho Um

https://orcid.org/0000-0002-6390-2218 - Related articles


 PDF Links
 PubReader
 ePub Link
 Full text via DOI
 Full text via PMC
 Download Citation
 Supplement1
 Print
Print


