| Clin Mol Hepatol > Volume 28(1); 2022 > Article |
|
ABSTRACT
Background/Aims
Methods
Results
ACKNOWLEDGMENTS
FOOTNOTES
SUPPLEMENTAL MATERIAL
Supplementary┬ĀTable┬Ā1.
Supplementary┬ĀTable┬Ā4.
Supplementary┬ĀTable┬Ā5.
Supplementary┬ĀTable┬Ā6.
Supplementary┬ĀFigure┬Ā1.
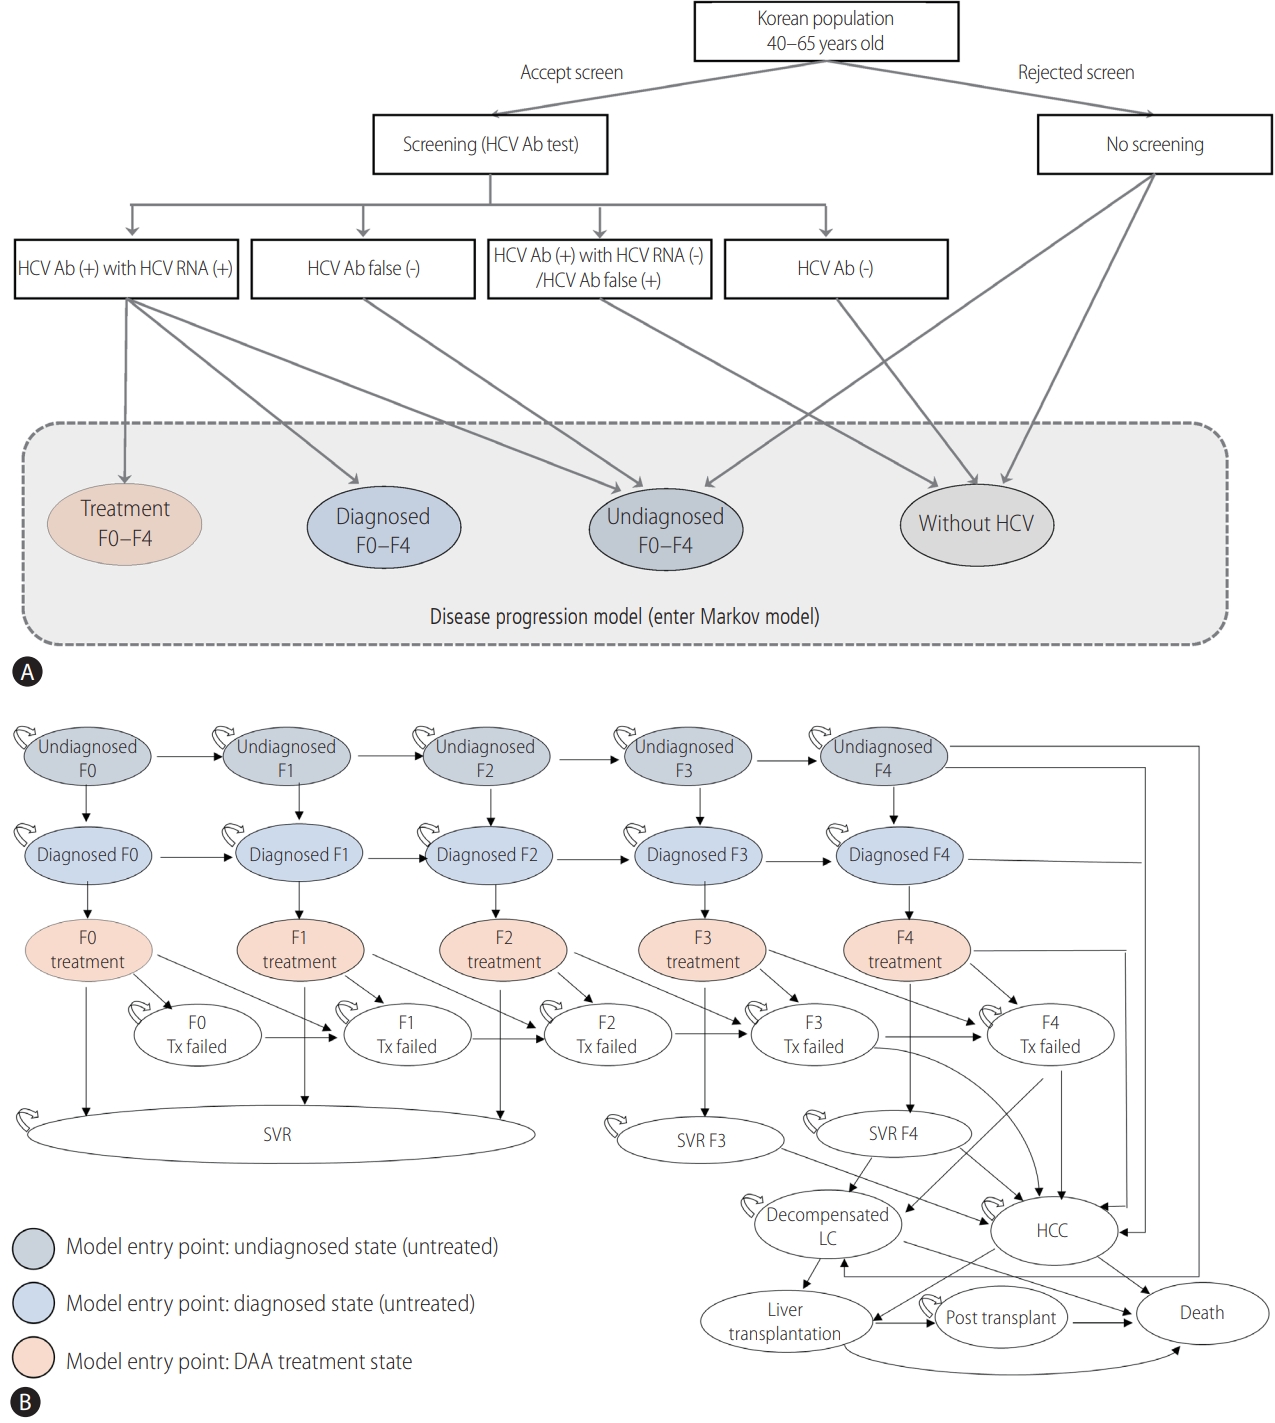
Figure┬Ā1.

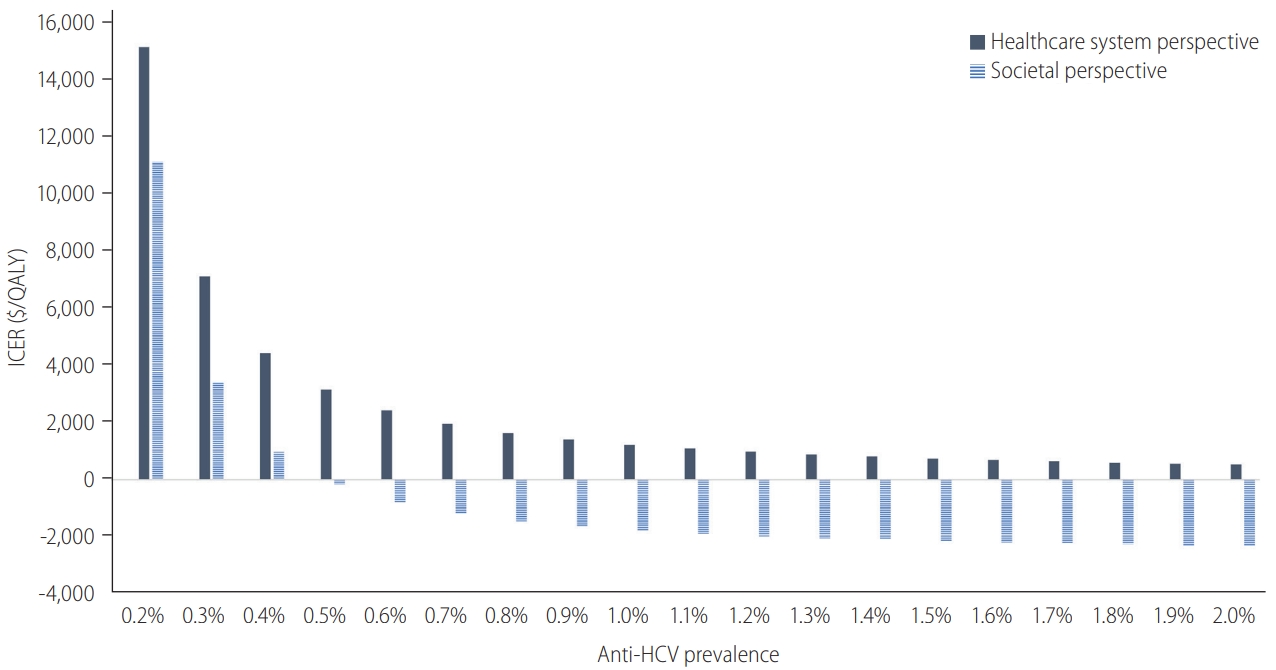
Figure┬Ā2.

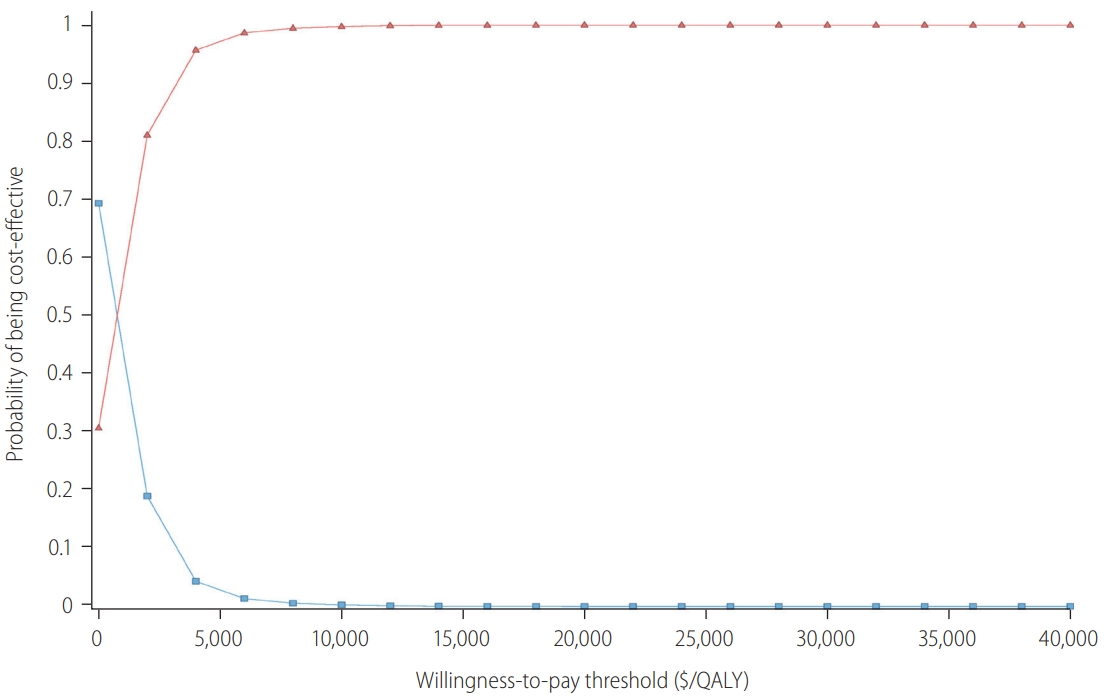
Figure┬Ā3.

Figure┬Ā4.

Table┬Ā1.
| Parameter | Value | Reference | ||
|---|---|---|---|---|
| Population characteristics & analysis conditions | ||||
| ŌĆā | Population structure by age | [16] | ||
| ŌĆā | Age 40ŌĆō49 years | 39.68% | ||
| Age 50ŌĆō59 years | 40.55% | |||
| Age 60ŌĆō65 years | 19.78% | |||
| Anti-HCV prevalence by age group | [6] | |||
| In 40s | 0.38% (0.28ŌĆō1.00%) | |||
| In 50s | 0.61% (0.60ŌĆō1.30%) | |||
| In 60s | 1.06% (0.88ŌĆō1.80%) | |||
| Acceptability of screening | 77.35% | KNHIS claim data | ||
| Referral rate | 70.0% (60.0ŌĆō80.0%) | Assumption | ||
| Acceptability of treatment | 72.8% | [6] | ||
| Treatment efficacy (SVR rate)* | 96.3% | [17,19-22] | ||
| Awareness of HCV infection | 20.0% | [43] | ||
| Detection rate without screeningŌĆĀ | [6,18] | |||
| In 40s | 5.26% | |||
| In 50s | 5.57% | |||
| In 60s | 3.77% | |||
| HCV screening test | [44] | |||
| Sensitivity | 98.1% (92.6ŌĆō99.7%) | |||
| Specificity | 99.8% (99.2ŌĆō99.9%) | |||
| HCV RNA positivity in people with anti-HCV | 46.5% (30.0ŌĆō50.0%) | [9,15] | ||
| Distribution of fibrosis stage by age | [45] | |||
| Age 40ŌĆō49 years | ||||
| ŌĆāStage F0 | 6.67% | |||
| ŌĆāStage F1 | 45.33% | |||
| ŌĆāStage F2 | 26.67% | |||
| ŌĆāStage F3 | 13.33% | |||
| ŌĆāStage F4 | 8.00% | |||
| Age 50ŌĆō59 years | ||||
| ŌĆāStage F0 | 10.28% | |||
| ŌĆāStage F1 | 27.10% | |||
| ŌĆāStage F2 | 38.32% | |||
| ŌĆāStage F3 | 14.95% | |||
| ŌĆāStage F4 | 9.35% | |||
| Age 60ŌĆō65 years | ||||
| ŌĆāStage F0 | 4.31% | |||
| ŌĆāStage F1 | 34.44% | |||
| ŌĆāStage F2 | 24.44% | |||
| ŌĆāStage F3 | 16.80% | |||
| ŌĆāStage F4 | 20.00% | |||
| Transition probability | ||||
| Annual probability of fibrosis progression | [25] | |||
| F0 to F1 | 0.107 (0.097ŌĆō0.118) | |||
| F1 to F2 | 0.082 (0.074ŌĆō0.091) | |||
| F2 to F3 | 0.117 (0.107ŌĆō0.129) | |||
| F3 to F4 | 0.116 (0.104ŌĆō0.131) | |||
| Annual probability of disease progression | ||||
| F3 to HCC | 0.0073 (0.0000ŌĆō0.0087) | [23,24] | ||
| F4 to DC | 0.048 (0.030ŌĆō0.067) | [24,26,27] | ||
| F4 to HCC | 0.053 (0.024ŌĆō0.077) | [24,27,30] | ||
| DC to HCC | 0.075 (0.014ŌĆō0.082) | [23,26,30] | ||
| DC to LT | 0.023 (0.010ŌĆō0.062) | [31] | ||
| DC to death | 0.118 (0.103ŌĆō0.216) | [23,26,30] | ||
| HCC to LT | 0.04 (0.00ŌĆō0.14) | [31] | ||
| HCC to death | 0.32 (0.19ŌĆō0.43) | [23,32,33] | ||
| LT to death | 0.21 (0.14ŌĆō0.21) | [28] | ||
| Post-LT to death | 0.014 (0.011ŌĆō0.034) | [28] | ||
| Annual probability of disease progression after SVR | ||||
| SVR(F3) ŌåÆ HCC | 0.00475 (0.00000ŌĆō0.00577) | [31] | ||
| SVR(F4) ŌåÆ DC | 0.0033 | [29] | ||
| SVR(F4) ŌåÆ HCC | 0.0034 | [29] | ||
Values are presented as number (range).
HCV, hepatitis C virus; KNHIS, Korean National Health Insurance Service; SVR, sustained virologic response; HCC, hepatocellular carcinoma; DC, decompensated cirrhosis; LT, liver transplantation.
* Weighted average value by the distribution of direct acting antiviral use (2019 data from Korean HCV cohort study).
ŌĆĀ Number of notification of hepatitis C infection/antibodies to HCV prevalence (data from the infectious disease portal [http://www.kdca.go.kr/npt/biz/npp/ist/bass/bassSexdstnAgeStatsMain.do]).
Table┬Ā2.
Table┬Ā3.
| Scenario (applied value at base-case) |
ICER ($/QALY) |
||
|---|---|---|---|
| Healthcare perspective | Societal perspective | ||
| Base-case | 2,666 | 431 | |
| Anti-HCV prevalence (40s: 0.23%, 50s: 0.38%, 60s: 1.06%) | |||
| ŌĆā | 0.4% | 4,429 | 962 |
| 0.6% | 2,422 | Dominant* | |
| 0.8% | 1,634 | Dominant* | |
| 1.0% | 1,223 | Dominant* | |
| 1.2% | 973 | Dominant* | |
| 1.4% | 806 | Dominant* | |
| Detection rate without HCV screening (40s: 5.26%, 50s: 5.57%, 60s: 3.77%) | |||
| 2% | 1,841 | Dominant* | |
| 12% | 5,174 | 3,731 | |
| Age group (40ŌĆō65 years) | |||
| 40s | 3,561 | Dominant* | |
| 50s | 2,808 | 1,446 | |
| 60s | 1,728 | 1,352 | |
| Acceptability of DAA treatment (72.8%) | |||
| 60% | 3,788 | 2143 | |
| 80% | 2,084 | Dominant* | |
| SVR rate (96.3%) | |||
| -5%: 91.5% | 3,186 | 1,025 | |
| +3%: 99.2% | 2,378 | 101 | |
| Cost | |||
| Excluding genotype test ($127.32): $0 | 2,313 | 254 | |
| Screening test ($3.91): D7026, $13.61 | 8,199 | 5,964 | |
| HCC state ($10,972.06): from other source8, $6,160 | 3,433 | 1,197 | |
| DC state ($8,487.37): from other source8, $6,258 | 3,019 | 783 | |
| Discount rate (4.5%) | |||
| 0% | Dominant* | Dominant* | |
| 3% | 992 | Dominant* | |
| Utility | |||
| SVR (0.894): lower value, 0.83 | 3,936 | 636 | |
| SVR (0.894): upper value, 0.92 | 2,357 | 381 | |
| F0ŌĆōF3 (0.854): lower value, 0.79 | 2,193 | 354 | |
| F0ŌĆōF3 (0.854): upper value, 0.88 | 2,922 | 472 | |
Abbreviations
REFERENCES
- TOOLS
-
METRICS

- ORCID iDs
-
Sook-Hyang Jeong

https://orcid.org/0000-0002-4916-7990 - Related articles
-
Current status of and strategies for hepatitis C control in South Korea2017 September;23(3)


 PDF Links
 PubReader
 ePub Link
 Full text via DOI
 Full text via PMC
 Download Citation
 Supplement1
 Print
Print


