Impacts of muscle mass dynamics on prognosis of outpatients with cirrhosis
Article information

Abstract
Background/Aims
Sarcopenia negatively affects the prognosis of cirrhotic patients, but clinical implications of changes in muscle mass remain unclear. We aimed to elucidate its role in the prognosis of outpatients with cirrhosis.
Methods
Patients with cirrhosis who underwent annual abdominal computed tomography (CT) for hepatocellular carcinoma surveillance were included in the prospective cohort. The L3 skeletal muscle index (SMI) was adopted as a proxy for the amount of skeletal muscle, and the rate of SMI change between inclusion and after 1 year (ΔSMI/yr%) was calculated.
Results
In total, 595 patients underwent a second CT after 1 year. Among them, 109 and 64 patients had sarcopenia and Child-Pugh class B/C decompensation at inclusion, which changed to 103 and 45 at the 1-year follow-up, respectively. During a median follow-up of 30.1 months after 1 year, 86 patients had at least one cirrhosis complication, and 18 died or received liver transplantation. In the development of cirrhosis complications, ΔSMI/yr% was independently associated, even after adjusting for the Child-Pugh and model for end stage liver disease (MELD)-Na scores. In addition, ΔSMI/yr% showed a good predictive performance for the development of cirrhosis complications within 6 months after 1-year follow-up in all subgroups, with a cut-off of -2.62 (sensitivity, 83.9%; specificity, 74.5%) in the overall population. SMI at 1-year and Child-Pugh score were independent factors associated with survival. In addition, changes in sarcopenia status significantly stratified survival.
Conclusions
ΔSMI/yr% was a good predictor of the development of cirrhosis complications in outpatients with cirrhosis, independent of Child-Pugh and MELD scores.
Graphical Abstract

INTRODUCTION
Sarcopenia is characterized by reduced skeletal muscle mass, strength, or physical performance [1]. It has been studied for its clinical relevance in a variety of diseases [2-4]. It not only worsens diseases, but also causes physical disability, which can result in depression and poor quality of life in patients.
In particular, sarcopenia is closely related to chronic liver disease; therefore, guidelines for sarcopenia were presented by liver societies in various countries [1,5,6]. Chronic liver disease could result in sarcopenia because of malnutrition, hypermetabolism, hormone deficiency, increased muscle proteolysis, and muscle growth impairment [7]. For these reasons, many cirrhosis patients have sarcopenia, and those are likely to have a poor prognosis.
A recent meta-analysis suggested that sarcopenia and skeletal muscle index (SMI) are independently associated with the prognosis of patients with cirrhosis. Sarcopenia and a 1 cm2/m2 decrease in the third lumbar vertebra (L3)-SMI were associated with a 2.30- and 1.03-fold higher mortality risk, respectively [8]. Thus, sarcopenia status and SMI were positioned as reliable prognostic factors, in addition to ChildPugh and the model for end-stage liver disease (MELD)-Na scores.
However, muscle mass can change, and there is a limit to predict muscle mass at one time point for the long-term prognosis of patients. Most of sarcopenia-related studies involved a majority of patients with severe liver dysfunction and a poor prognosis and, accordingly investigated shortterm prognoses [8]. Therefore, it is necessary to examine the clinical impact of sarcopenia in outpatients with cirrhosis who are expected to have a good prognosis. Since muscle mass can change significantly over time, changes in muscle mass (∆SMI) may be more important than muscle mass at baseline, just as ∆MELD was a more significant prognostic factor than the baseline MELD score [9-11]. However, there is limited data on the ∆SMI of relatively small cohorts [12-15].
Herein, we aimed to investigate the impact of changes in muscle mass, including ∆SMI over 1 year, on the survival and development of complications in outpatients with cirrhosis using a prospective cohort whose members with a Child-Pugh score of 5‒10 underwent regular computed tomography (CT) scans.
PATIENTS AND METHODS
Study population
We investigated a cohort of patients at the Korea University Ansan Hospital from a multicenter prospective study of hepatocellular carcinoma (HCC) surveillance using biomarkers (alpha-fetoprotein [AFP], AFP-L3, and PIVKA-II) and imaging tools in patients with cirrhosis. This prospective cohort enrolled outpatients with cirrhosis aged 19‒75 years from September 2016 to February 2020 at 15 tertiary medical centers in South Korea. Patients with serum creatinine >1.5 mg/dL or Child-Pugh scores >10 were excluded due to the nephrotoxicity of the contrast medium and the probability of early dropout. Patients with HCC, a history of liver or kidney transplantation, incurable malignancy, or any contraindication for enhanced CT scans were excluded. Additional details regarding this prospective study are described in the Supplementary Materials.
This prospective study conformed to the ethical guidelines of the 1975 Declaration of Helsinki and was approved by the Institutional Review Board at the Korea University Ansan Hospital (IRB No. 2016AS0064). Written informed consent was obtained from all patients. Among them, we recruited and reviewed patients who were enrolled between July 2016 and February 2020 and underwent a 1-year CT scan before March 2021. Thus, we set the date taking the 1-year CT scan to the 1 year in this study. All authors accessed the study data, and reviewed and approved the final manuscript.
Data collection
Following inclusion, patient’s demographic and clinical data, as well as the results of liver and kidney tests were collected, and the laboratory tests were repeated at least every 3 to 6 months, with ultrasound scans every 6 months and CT scans every year until HCC development. HCC was diagnosed according to the guidelines of the Korean Liver Cancer Association [16,17]. This prospective cohort study is ongoing; however, the present study included data up to March 2022.
At inclusion and after 1 year, we measured the cross-sectional area of the skeletal muscles (cm2) on a CT scan at the caudal end at the level of the L3. In this study, in-house software was used to identify subcutaneous fat, visceral fat, and muscle (i.e., the psoas, paraspinal muscles, transversus abdominis, rectus abdominis, and internal and external obliques) in CT images for body composition analysis based on MATLAB version R2010a (Mathworks Inc., Natick, MA, USA). This open-source software (BMI_CT) is available at the following URL: https://sourceforge.net/projects/muscle-fat-area-measurement [18]. Inter- and intra-observer reproducibility were reliable (intra-class correlation coefficient >0.80).
Definition
SMI (cm2/m2) was calculated by dividing the L3-skeletal muscle area (SMA) by the square of the height. Sarcopenia was defined as SMI <39 cm2/m2 in women and <50 cm2/m2 in men, according to the American Association for the Study of Liver Diseases guidelines [1].
We further defined the change in SMI within 1 year as “∆SMI/yr%” using the following formula: ∆SMI/yr% = (SMI after 1 year – SMI at inclusion) / SMI at inclusion × 100 (%).
The principal outcomes included death and liver transplantation (LT), and the development of cirrhosis complications, which included clinically apparent new-onset ascites, refractory ascites, spontaneous bacterial peritonitis (SBP), overt hepatic encephalopathy, or variceal bleeding [19,20]. In patients who already had these complications, the development of complications may correspond to the exacerbation of existing complications, such as refractory ascites, or the development of new complications (e.g., hepatic encephalopathy in patients with ascites or varix bleeding in patients with hepatic encephalopathy).
Refractory ascites was defined as ascites that was uncontrollable even with high-dose diuretics or intractable owing to diuretic-induced complications, mandating repeated paracentesis. SBP was diagnosed when the ascitic polymorphonuclear leukocyte count was ≥250 cells/mm3 without evident intra-abdominal infection [21]. Overt hepatic encephalopathy was diagnosed according to the West-Haven criteria [22]. The estimated glomerular filtration rate (eGFR) was calculated according to the modification of diet in renal disease formula [23].
Statistical analysis
Statistical analysis was performed using R software (version 4.1.2; http://cran.r-project.org/). Data are expressed as medians (Q1, Q3) or numbers (%). The Mann-Whitney U and Kruskal-Wallis tests were used to compare continuous variables, while the chi-squared test and Fisher’s exact test were used to compare categorical variables, as appropriate.
We calculated the minimal sample size with an alpha-error of 0.05 and power of 0.8. Based on a study by Jeong et al. [13], we applied the survival rate and approximately 3:1 prevalence of ∆SMA/y ≥-2.4% and <-2.4%. We found that the minimum sample size required was 180.
The probabilities of LT-free survival and the cumulative development of cirrhosis complications in 1 year were estimated using the Kaplan-Meier method, and the differences between the groups were assessed using the log-rank test. Patients who were lost to follow-up were censored based on the date of their last follow-up.
A Cox proportional hazard regression model was established to analyze the factors associated with the principal outcomes, and significant factors in the univariate analyses were subjected to multivariable analysis to determine the independent predictive factors. For the development of cirrhosis complications, we further performed the Fine and Gray regression with mortality and LT as competing events [24,25]. In addition, we performed binary logistic regression analysis for these events within 6 months after 1-year follow-up.
To evaluate predictive performance, receiver operating characteristic (ROC) curves were constructed, and the values of the area under the curve (AUC) were compared.
All tests were two-tailed, and P<0.05 was used to indicate statistically significant differences.
RESULTS
Patient’s characteristics
Among the 729 patients of the prospective cohort, 595 were included in this study (Fig. 1). Compared to the excluded patients, there was no significant difference in the included patients (Supplementary Table 1).
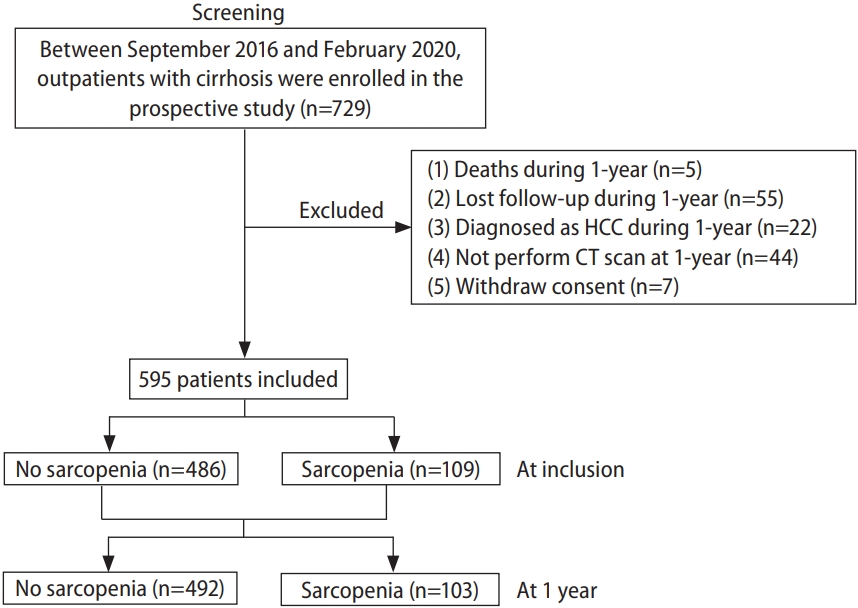
Flow diagram of patient inclusion. HCC, hepatocellular carcinoma; CT, computed tomography.
The clinical characteristics of the enrolled patients at inclusion are shown in Supplementary Table 2. The mean patient age was 55.4±7.9 years, and 381 patients (64.0%) were men. The distribution of ΔSMI/yr% are presented in Supplementary Figure 1. The prevalence of sarcopenia at inclusion is shown in Supplementary Figure 2. Chronic viral hepatitis was the most common underlying liver disease (400 patients, 67.2%), followed by alcoholic liver disease (117 patients, 19.7%). The majority (92.4%) of chronic hepatitis B patients received antiviral agents according to the guideline [26], and those who did not receive antiviral therapy had no detectable serum hepatitis B virus DNA levels. All patients with chronic hepatitis C received interferons or direct acting antivirals and achieved sustained virological responses [27].
The median duration from CT at the time of inclusion to the second CT was 12.1 months (11.7, 12.9). Sarcopenia was present in 109 patients at the time of inclusion, but it decreased to 103 patients after 1 year (Fig. 1). Fifteen patients without sarcopenia at inclusion progressed to sarcopenia after 1 year (non-sarcopenia to sarcopenia [NS]), whereas 21 patients with sarcopenia improved to non-sarcopenia (sarcopenia to non-sarcopenia [SN]). In addition, 88 and 471 patients remained with sarcopenia and without sarcopenia (sarcopenia to sarcopenia [SS] and non-sarcopenia to non-sarcopenia [NN]), respectively. There was no significant difference between these groups except for gender, body mass index, alcohol-related liver disease, serum alanine aminotransferase level, eGFR, SMI, and ∆SMI/yr% (Table 1).

Characteristics of patients based on sarcopenia at the 1-year follow-up
LT-free survival
During the median follow-up period of 30.1 months (19.6, 39.2), 10 patients died, and eight patients received LT. The causes of death were infection (50%), hepatorenal syndrome (20%), variceal bleeding (20%), and stroke (10%).
In the Cox regression analyses, SMI at 1 year was independently associated with LT-free survival even after adjusting for Child-Pugh and MELD-Na scores (Table 2). In addition, higher Child-Pugh scores independently increased the risk of mortality. However, ∆SMI/yr% showed no significant association with LT-free survival.
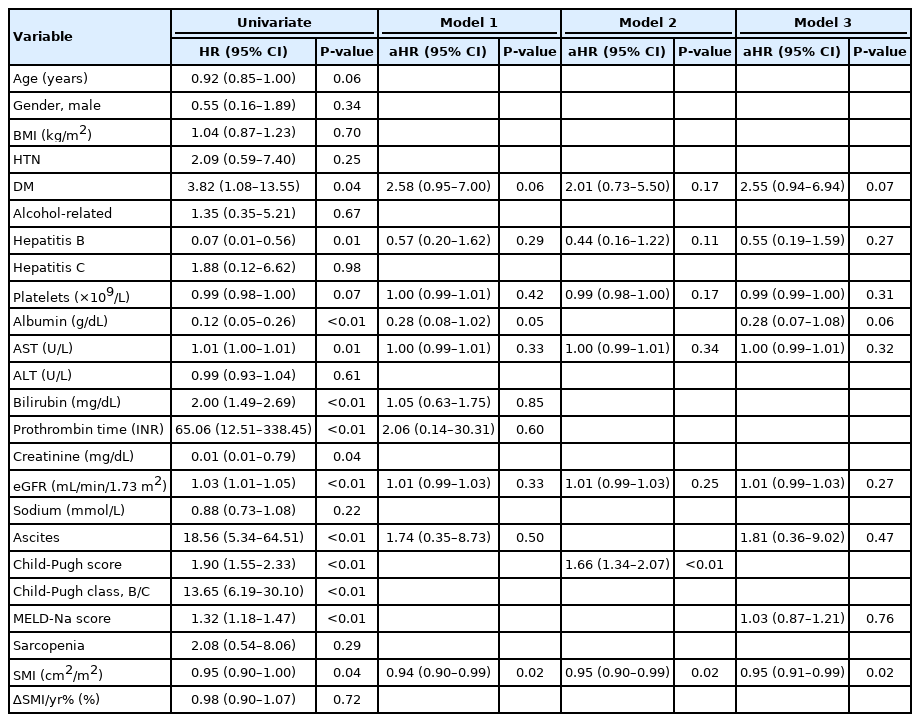
Univariate and multivariable Cox regression analyses for LT-free survival after 1-year CT
Sarcopenia at 1 year was not significantly associated with LT-free survival (Fig. 2A), and this was the case even after stratifying by sex. However, the four groups according to changes in sarcopenia status (NN, SN, NS, and SS) showed significantly different LT-free survival rates (P=0.04 overall; Fig. 2B), and the NS group had the worst prognosis. Based on these results, eight groups were classified by Child-Pugh class, and change in sarcopenia status also stratified LT-free survival well (Fig. 2C).
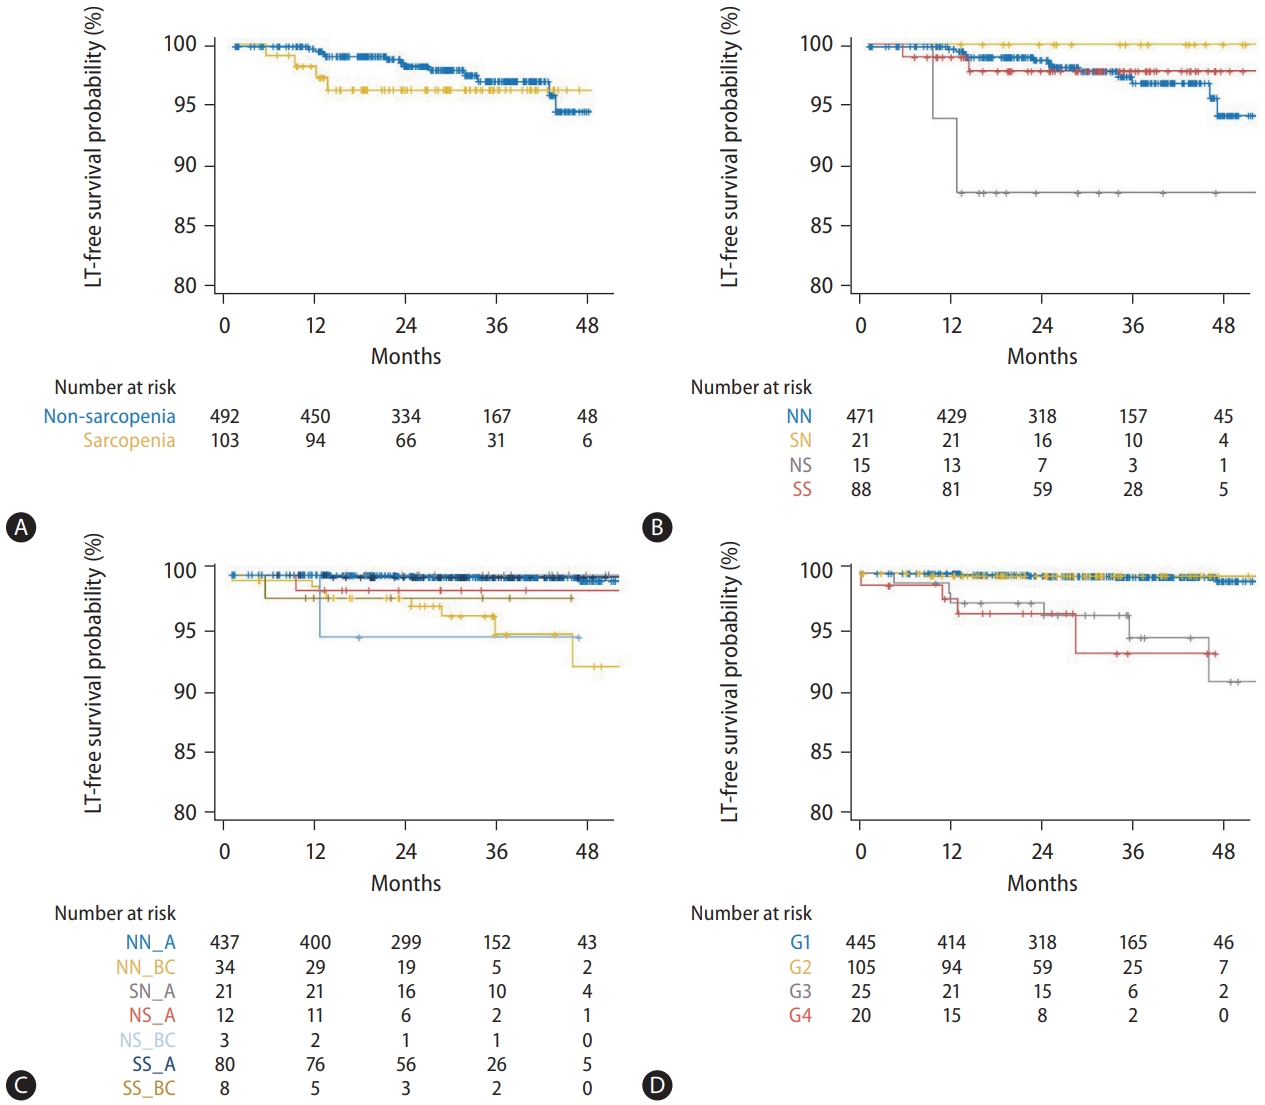
Kaplan-Meier plots for LT-free survival after 1-year CT. (A) LT-free survival was not significantly different between two groups with non-sarcopenia and sarcopenia at 1 year (P=0.48). The LT-free survival was significantly stratified by (B) four groups (NN, SN, NS, and SS; overall P=0.04) and (C) eight groups (NN_A, NN_BC, SN_A, SN_BC, NS_A, NS_BC, SS_A, and SS_BC; overall P<0.001). There was no patient belonging to SN_BC. (D) The survival was well-stratified by G1–4 and Child-Pugh class (P<0.001), but not by ΔSMI/yr%. LT, liver transplantation; NN, nonsarcopenia to non-sarcopenia; SN, sarcopenia to non-sarcopenia; NS, non-sarcopenia to sarcopenia; SS, sarcopenia to sarcopenia; NN_A, NN with Child-Pugh class A; NN_BC, NN with Child-Pugh class B/C; SN_A, SN with Child-Pugh class A; NS_A, NS with Child-Pugh class A; NS_BC, NS with Child-Pugh class B/C; SS_A, SS with Child-Pugh class A; SS_BC, SS with Child-Pugh class B/C; G1, Child-Pugh class A and ΔSMI/yr% ≥-3.66; G2, Child-Pugh class A and ΔSMI/yr% <-3.66; G3, Child-Pugh class B/C and ΔSMI/yr% ≥-2.62; G4, Child-Pugh class B/C and ΔSMI/yr% <-2.62; CT, computed tomography; ΔSMI/yr%, % change in skeletal muscle index after 1 year.
Cirrhosis complications
Cirrhosis complications occurred in 34 patients within 6 months prior to the 1-year CT. ∆SMI/yr% was not significantly different according to the presence of previous cirrhosis complications (median [interquartile range], -1.0 [-3.0, 2.5] vs. -0.35 [-8.87, 3.62] in patients without and with previous cirrhosis complications; Supplementary Fig. 3), and the change in sarcopenia status was not significantly different (proportion of NS, 2.50% vs. 2.94%).
After the 1-year CT, 86 patients experienced at least one cirrhosis complication. The first episode of complication was ascites (47.7%), including newly developed ascites (32.6%) and progression to refractory ascites (15.1%), varix bleeding (38.4%), and hepatic encephalopathy (13.9%). According to the presence of sarcopenia at 1 year and the change in sarcopenia status, the development of cirrhosis complications was not significantly different (Fig. 3A, B).
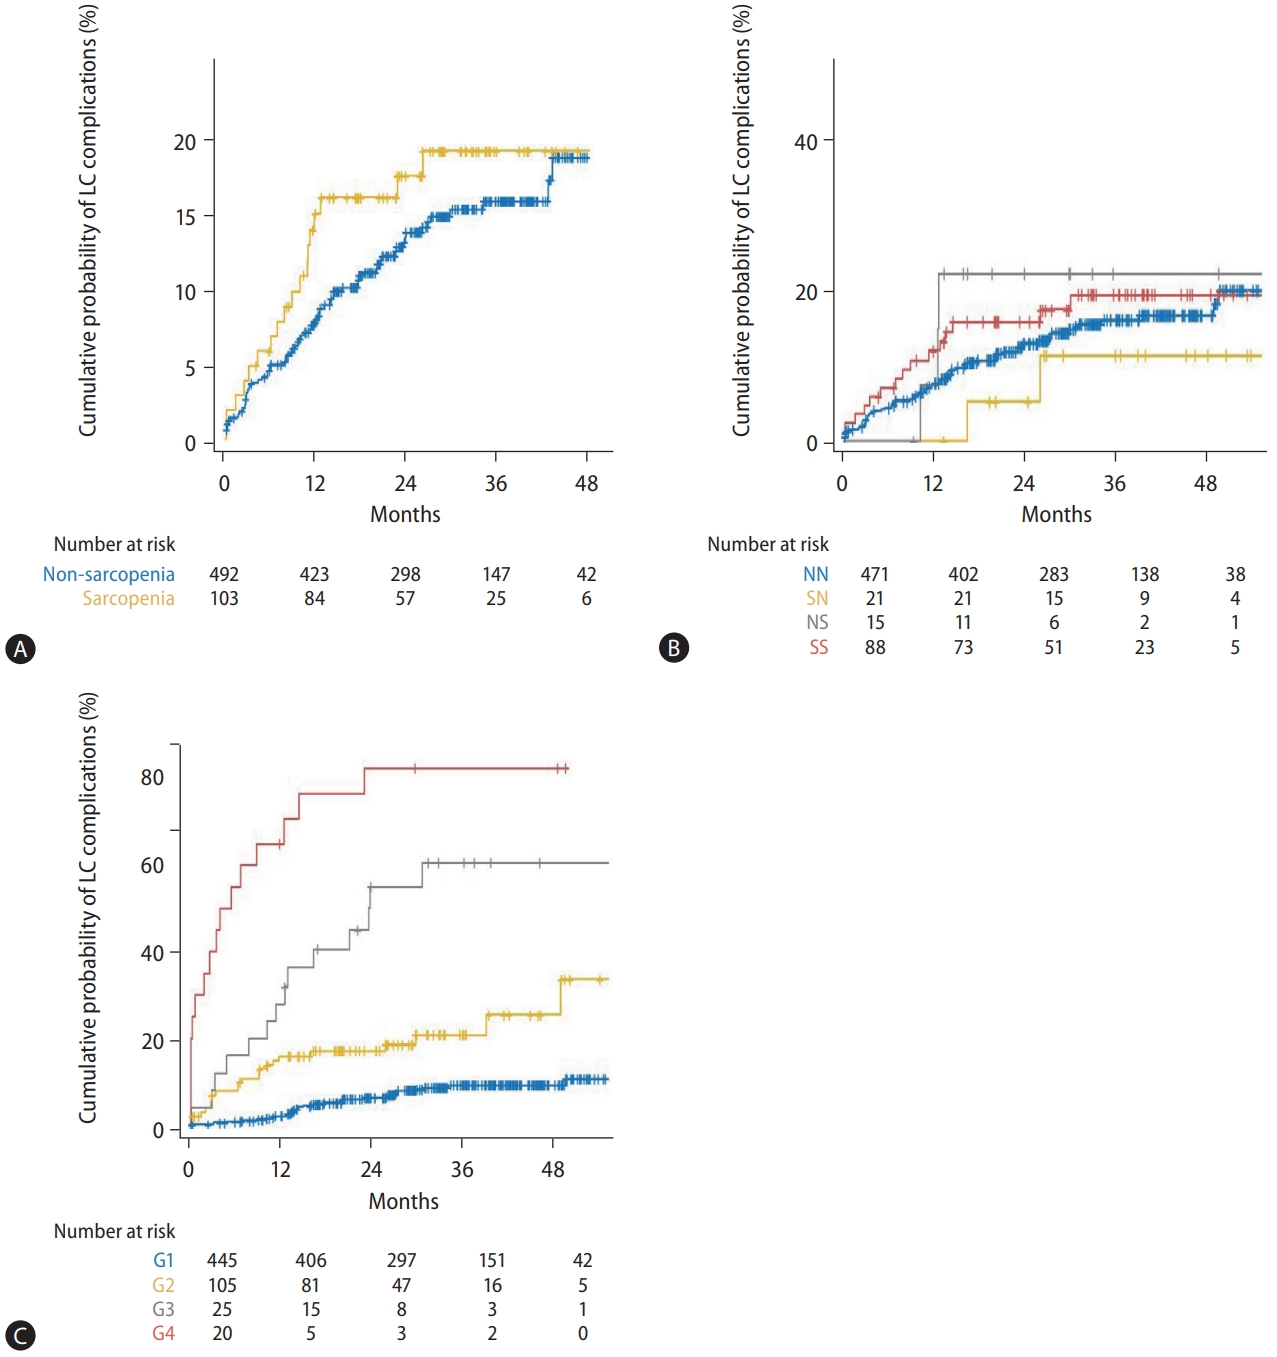
Kaplan-Meier plots for the development of cirrhosis complication after 1-year CT. The development of cirrhosis complication was not well-stratified by (A) the sarcopenia status and (B) sarcopenia status change (P=0.30 and 0.73, respectively). However, based on (C) the four groups (G1–4) classified by Child-Pugh class and ΔSMI/yr%, it was well distinguished (P<0.001). LC, liver cirrhosis; NN, non- sarcopenia to non-sarcopenia; SN, sarcopenia to non-sarcopenia; NS, non-sarcopenia to sarcopenia; SS, sarcopenia to sarcopenia; G1, Child-Pugh class A and ΔSMI/yr% ≥-3.66; G2, Child-Pugh class A and ΔSMI/yr% <-3.66; G3, Child-Pugh class B/C and ΔSMI/yr% ≥-2.62; G4, Child-Pugh class B/C and ΔSMI/yr% <-2.62; CT, computed tomography; ΔSMI/yr%, % change in skeletal muscle index after 1 year.
In contrast to LT-free survival, SMI at 1 year was not associated with the development of cirrhosis complications. In contrast, ∆SMI/yr% was an independent prognostic factor for the development of cirrhosis complications even after adjusting for the Child-Pugh and MELD-Na scores (Table 3). The results of the competing risk analysis to exclude the impact of mortality on the development of cirrhosis complications were similar (Supplementary Table 3). Even in the binary logistic regression analysis for the development of cirrhosis complications within 6 months, ∆SMI/yr% was independently associated (P<0.001).

Univariate and multivariable Cox regression analyses for the development of LC complication after 1-year CT
To investigate the predictive performance, ROC analysis was performed on the development of cirrhosis complications within 6 months after 1-year follow-up. Overall, the AUC of ∆SMI/yr% was 0.817 (95% confidence interval [CI], 0.729-0.905), and the optimal cut-off value was -2.62 with a sensitivity of 83.9% and specificity of 74.5% (Fig. 4A). Since Child-Pugh scores and the presence of complications at 1 year were independent factors, we performed subgroup analysis of AUC according to Child-Pugh class. AUCs of ∆SMI/yr% were 0.855 (95% CI, 0.756–0.953) and 0.754 (95% CI, 0.592–0.916), and optimal cut-off values were -3.66 (sensitivity, 80.8%; specificity, 82.8%) and -2.62 (sensitivity, 81.2%; specificity, 72.4%) in two subgroups of Child-Pugh class A and B/C (Fig. 4B, C), respectively. The AUCs of ∆SMI/yr% for the other subgroups are shown in Supplementary Figure 4.

Receiver operating characteristic curve of ΔSMI/yr% for development of cirrhosis complication within 6 months after 1-year CT. The AUCs of ΔSMI/yr% were (A) 0.817 in all, (B) 0.855 in patients with Child-Pugh class A, and (C) 0.754 in those with Child-Pugh classes B/C. ΔSMI/ yr%, % change in skeletal muscle index after 1 year; CT, computed tomography; AUC, area under curve.
Based on these results, we classified patients into four groups as follows: group 1: patients with Child-Pugh class A and ∆SMI/yr% ≥-3.66 (n=445); group 2: those with ChildPugh class A and ∆SMI/yr% <-3.66 (n=105); group 3: those with Child-Pugh class B/C and ∆SMI/yr% ≥-2.62 (n=25); and group 4: those with Child-Pugh class B/C and ∆SMI/yr% <-2.62 (n=20).
Clinical impact of Child-Pugh class and ∆SMI/yr% levels based on classification
The cumulative incidence of development of cirrhosis complications differed significantly among the four groups: the cumulative incidences of LC complications at 6, 12, 24, and 36 months were 0.7%, 2.6%, 6.8%, and 9.1%, respectively, in group 1; 9.8%, 15.9%, 18.6%, and 25.4%, respectively, in group 2; 16.0%, 36.3%, 55.1%, and 60.7%, respectively, in group 3; and 55.0%, 70.8%, 82.5%, and 82.5%, respectively, in group 4 (Fig. 3C). In the Cox regression analysis, the hazard ratios for the development of cirrhosis complications were 3.16 (95% CI, 1.84–5.44; P<0.001) in group 2, 9.85 (95% CI, 5.28–18.39; P<0.001) in group 3, and 26.47 (95% CI, 14.50–48.32; P<0.001) in group 4, respectively, when compared to the hazard ratios of group 1.
Groups 1 and 2 showed significantly better LT-free survival than did groups 3 and 4 (P<0.001). However, there were no significant differences in LT-free survival between groups 1 and 2 and between groups 3 and 4 (P=0.93 and 0.85, respectively) (Fig. 2D).
DISCUSSION
Many previous studies have shown that SMI and sarcopenia are independently associated with prognosis, including survival and the development of cirrhosis complications in patients with cirrhosis [28-31]. This study investigated the role of muscle mass change over 1 year in the clinical course of outpatients with cirrhosis using a prospective cohort with regular CT scans.
Previously, two studies by Hanai et al. [12] and Jeong et al. [13] investigated the change in skeletal muscle area (∆SMA) at L3 using CT scans as a prognostic factor in patients with cirrhosis. These studies showed that ∆SMA per year was an independent prognostic factor for mortality after adjusting for Child-Pugh and MELD scores and the hepatic venous pressure gradient. However, these two studies involved relatively small numbers of patients (149 and 131, respectively). Furthermore, in the Hanai et al. [12] study, the interval between CT scans was 2 weeks, which is a short period to observe changes in muscle mass, whereas in the Jeong et al. [13] study, the interval varied from 13 to 61 months. In addition, the baseline Child-Pugh and MELD scores were used in the multivariable analyses, rather than the last Child-Pugh and MELD scores.
This study showed that presence of sarcopenia and ∆SMI/ yr% did not significantly influence the survival of outpatients with cirrhosis (Fig. 3, Table 2). However, survival was significantly different according to changes in sarcopenia status. In particular, the best survival was found in SN, rather than NN (Fig. 3B). This finding emphasizes the importance of changes in muscle mass rather than the present sarcopenia status. However, ∆SMI/yr% was not associated with survival in the Cox regression model. Instead, SMI and Child-Pugh score were independent factors after adjusting for other factors, but MELD-Na scores were not. Thus, the importance of SMI was consistent with the findings of previous studies for survival in patients with cirrhosis [29-31], and a 1 cm2/m2 decrease was associated with a 1.05-fold higher mortality risk, which was similar to the 1.03 risk in a meta-analysis study [8]. The importance of MELD-Na seems to have decreased because patients with high serum creatinine level were excluded from this study.
In contrast, ∆SMI/yr% was independently associated with the development of cirrhosis complications, even after adjusting for Child-Pugh and MELD-Na scores. AUCs of ∆SMI/yr% for the development of cirrhosis complications within 6 months were >0.75 in overall and all subgroups analyses, suggesting the reliable predictive performance of ∆SMI/yr%. In addition, the optimal cut-off value of ∆SMI/yr% was -2.62 for the development of cirrhosis complications within 6 months, which is similar to -2.4%, the optimal cut-off value of ∆SMA/y for survival, as suggested by Jeong et al. [13]. However, in subgroup analyses, the optimal cut-off values were slightly different according to sex, sarcopenia status, and Child-Pugh class (Supplementary Fig. 4). In particular, the cut-off value of ∆SMI/yr% was higher in patients with Child-Pugh class B/C than in those with Child-Pugh class A, suggesting that the risk of complications is high in outpatients with impaired liver function, even if muscle loss is less than in those with preserved liver function.
Based on these findings, we created four new groups integrating ∆SMI/yr% and Child-Pugh class, which connote the presence of existing complications. The risk of complications was well stratified in the four new groups, and all comparisons between the groups showed a significant difference. Patients with Child-Pugh class B/C and severe muscle loss had a 26-fold higher risk of development of cirrhosis complications than those with Child-Pugh class A and less muscle loss. However, mortality was stratified entirely based on Child-Pugh class, not on ∆SMI/yr%.
It is not yet clear whether the change in muscle mass is a consequence of, or the cause of the development of cirrhosis complications. In this study, previously development of complications did not significantly affect ∆SMI/yr% (Supplementary Fig. 3). These results suggest that decline in quality of life due to loss of muscle mass trigger the development of complications, rather than complications causing loss of muscle mass. Alternatively, loss of muscle mass might reflect malnutrition and deterioration of liver function prior to the development of complications.
This study had some limitations. First, because ∆SMI/yr% was required, patients who died or received a LT within 1 year were excluded. This might bring about selection bias and weaken the clinical impact of SMI and ∆SMI/yr%. However, it was unavoidable to use a cohort with regular CT follow-up. At present, CT is the most accurate and accessible method for diagnosing sarcopenia in cirrhosis patients, and it is difficult to perform CT scans at short intervals owing to the radiation risk and cost. Recently, to overcome this limitation, a model for predicting sarcopenia using blood test results in cirrhosis patients has been developed; however, further validation is still needed [32,33]. Second, cirrhotic patients with Child-Pugh scores >10 and serum creatinine >1.5 mg/dL were excluded at inclusion. These limitations resulted in only 10.8% and 18.3% of patients with Child-Pugh class B/C and sarcopenia, respectively (Supplementary Table 2), as opposed to more than 50% and 30% in other studies [8]. Especially, the exclusion of patients with high serum creatinine might led to higher eGFR in patients with sarcopenia than those without (Table 1, Supplementary Table 2). This is thought to be because serum creatinine, an important factor in eGFR, was strongly influenced by muscle mass. These exclusions might have contributed to the differences between the results of this study and those of previous studies. However, results indicating the tendency for more prominent sarcopenia in men, patients with alcohol-related liver disease, and greater severity of cirrhosis (not significant) were consistent with the results of previous studies (Supplementary Fig. 2) [8]. Considering these points, our cohort was a special cohort composed of outpatient-based cirrhotic patients with good prognosis who survived for more than 1 year. Among them, it is possible to identify the high-risk patients who were most likely to experience cirrhosis complications with risks of up to 70% within 1 year using the results of this study. Third, we analyzed using SMI criteria from Asian cohort (data are not shown) as well as Western cohort but could not obtain meaningful results because of decreased number of patients with sarcopenia. In our opinion, it is recommended to apply more relaxed sarcopenia criteria for outpatients. Fourth, we did not assess muscle strength or performance. Sarcopenia is a combined concept of not only muscle mass but also muscle strength and function [1]. However, the protocols used in our cohort did not include these examinations. Further studies are required to address these limitations.
Applying our findings to clinical practice, patients who meet the group 4 requirement should be followed up for short-term observation and for prevention of aggravating factors. In addition, the results of Cox regression analysis in our cohort suggest that every 1-point increase in ∆SMI/yr% was associated with a 5.0% decrease in the risk of cirrhosis complications. Although further studies are needed, steady resistance training could increase muscle size and strength, even in patients with cirrhosis, as shown by Aamann et al. [34]. Thus, exercise therapy should be actively introduced to prevent the development of cirrhosis complications.
In conclusion, we demonstrated that changes in sarcopenia status and muscle mass are associated with greater mortality and the development of cirrhosis complications, respectively, in outpatients with cirrhosis. In particular, even after adjusting for the Child-Pugh and MELD-Na scores, change in muscle mass was an independent predictor of the development of complications. Simple classifications using these muscle mass changes could help stratify the prognosis of outpatients with cirrhosis. Additionally, this study warrants a prospective comparison in a study involving muscle mass change over a short period of time and with an exercise intervention.
Notes
Authors’ contributions
Conception: YKJ, HJY; Study design: YKJ; Participation in patient management and data collection: YKJ, HJY, YSS, JHK, JEY, KSB; Contribution to data acquisition and blind measurements: JWB, YSL; Statistical analysis: THK; Writing the original draft: THK, YKJ; Writing, review, and editing: YKJ, HJY; Guarantor: YKJ; All authors have reviewed the paper and approved the final version.
Conflicts of Interest
The authors have no conflicts to disclose.
Acknowledgements
This clinical trial was registered in the ClinicalTrials.gov (NCT04414956). This study was supported by a Korea University Grant (K1512701). We would like to thank Editage (www.editage.co.kr) for English language editing.
SUPPLEMENTAL MATERIAL
Supplementary material is available at Clinical and Molecular Hepatology website (http://www.e-cmh.org).
Comparison of included and excluded participants
Characteristics of patients based on sarcopenia status at inclusion
Univariate and multivariate competing risk analyses for the development of LC complication after 1-year CT
Calibration plot of CLIF-SOFA scores. Diagonal line is the line of perfect calibration. Dots represent the intersects of observed and expected values for the risk of mortality, and bars represent the 95% confidence interval of the observed probability. Blue line indicates the calibration trend; since this line is close to the diagonal line, it indicates that the CLIF-SOFA fits the data well. CLIF-SOFA, Chronic Liver Failure-Sequential Organ Failure Assessment; ΔSMI/yr%, % change in SMI after 1 year.
Prevalence of sarcopenia according to various conditions at inclusion. ALD, alcoholic liver disease.
Change of SMI according to the presence of cirrhosis complications between 6‒12 months. The ΔSMI/yr% was not significantly different between patients with and without previous liver cirrhosis complications within 6 months prior to the 1 year (P=0.46). ΔSMI/yr%, % change in skeletal muscle index after 1 year; SMI, skeletal muscle index.
Receiver operating characteristic curve of ΔSMI/yr% for development of cirrhosis complication within 6 months after the 1-year follow-up in eight subgroups. (A) In men, the AUROC of ΔSMI/yr% was 0.836, and the optimal cut-off was -5.74, with a sensitivity of 68.4% and specificity of 91.9%. (B) AUROCs, optimal cut-offs, sensitivities, and specificities were 0.783, -2.62, 83.3%, and 75.1% in women; (C) 0.807, -2.62, 83.3%, and 74.3% in non-sarcopenia at inclusion; (D) 0.856, -5.74, 85.7%, and 90.1% in sarcopenia at inclusion; (E) 0.767, -2.62, 80.0%, and 72.9% in non-alcoholic etiology; (F) 0.883, -2.82, 87.5%, and 83.2% in alcohol etiology; (G) 0.827, -2.74, 81.0%, and 77.8% in non-HBV etiology; and (H) 0.824, -2.62, 90.0%, and 73.6% in HBV etiology. ΔSMI/yr%, % change in skeletal muscle index after 1 year; AUROC, area under the receiver operating characteristic curve; HBV, hepatitis B virus.
Abbreviations
AFP
alpha-fetoprotein
AUC
area under the curve
CI
confidence interval
CT
computed tomography
eGFR
estimated glomerular filtration rate
HCC
hepatocellular carcinoma
LT
liver transplantation
MELD
model for end-stage liver disease
NN
non-sarcopenia to non-sarcopenia
NS
non-sarcopenia to sarcopenia
ROC
receiver operating characteristic
SBP
spontaneous bacterial peritonitis
SMA
skeletal muscle area
SMI
skeletal muscle index
SN
sarcopenia to non-sarcopenia
SS
sarcopenia to sarcopenia
References
Article information Continued
Notes
Study Highlights
• Reduced muscle mass in patients with cirrhosis reflects a poor prognosis. However, the impact of change in muscle mass on prognosis is unclear.
• SMI and Child-Pugh score were the independent factors for LT-free survival.
• In a prospective cohort which involved regular CT scans, the changes in muscle mass were associated with development of cirrhosis complications and it was independent even after adjusting Child-Pugh and MELD-Na scores.
• We could select the high-risk group among cirrhotic patients by merging the change in muscle mass into Child-Pugh class.