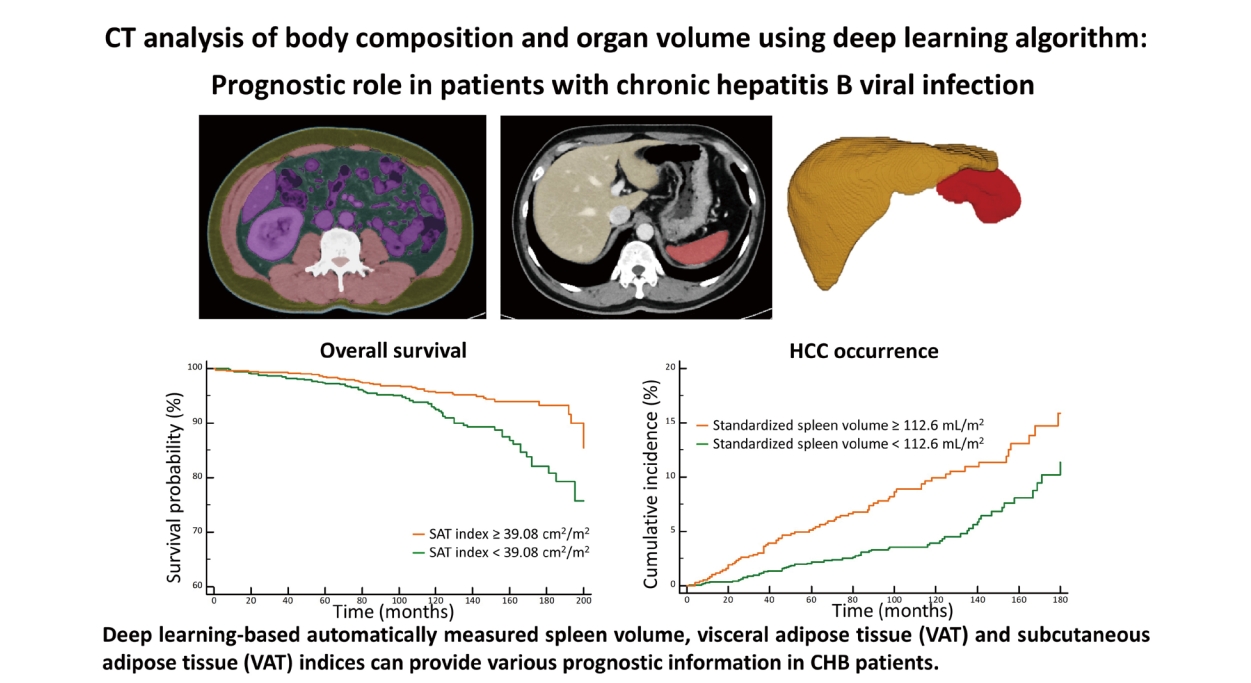
Clin Mol Hepatol > Volume 29(4); 2023 > Article
Yoo, Cho, Lee, Cho, Joo, and Jeon: Prognostic role of computed tomography analysis using deep learning algorithm in patients with chronic hepatitis B viral infection

ABSTRACT

Background/Aims

The prediction of clinical outcomes in patients with chronic hepatitis B (CHB) is paramount for effective management. This study aimed to evaluate the prognostic value of computed tomography (CT) analysis using deep learning algorithms in patients with CHB.

Methods

This retrospective study included 2,169 patients with CHB without hepatic decompensation who underwent contrast-enhanced abdominal CT for hepatocellular carcinoma (HCC) surveillance between January 2005 and June 2016. Liver and spleen volumes and body composition measurements including subcutaneous adipose tissue (SAT), visceral adipose tissue (VAT), and skeletal muscle indices were acquired from CT images using deep learning-based fully automated organ segmentation algorithms. We assessed the significant predictors of HCC, hepatic decompensation, diabetes mellitus (DM), and overall survival (OS) using Cox proportional hazard analyses.

Results

During a median follow-up period of 103.0 months, HCC (n=134, 6.2%), hepatic decompensation (n=103, 4.7%), DM (n=432, 19.9%), and death (n=120, 5.5%) occurred. According to the multivariate analysis, standardized spleen volume significantly predicted HCC development (hazard ratio [HR]=1.01, P=0.025), along with age, sex, albumin and platelet count. Standardized spleen volume (HR=1.01, P<0.001) and VAT index (HR=0.98, P=0.004) were significantly associated with hepatic decompensation along with age and albumin. Furthermore, VAT index (HR=1.01, P=0.001) and standardized spleen volume (HR=1.01, P=0.001) were significant predictors for DM, along with sex, age, and albumin. SAT index (HR=0.99, P=0.004) was significantly associated with OS, along with age, albumin, and MELD.

Conclusions

Deep learning-based automatically measured spleen volume, VAT, and SAT indices may provide various prognostic information in patients with CHB.

Graphical Abstract

INTRODUCTION

Chronic hepatitis B (CHB) remains an important global health problem with significant morbidity and mortality despite vaccination and effective antiviral treatment [1]. The risk of progression to cirrhosis and hepatocellular carcinoma (HCC) in patients with CHB is variable and is affected by the host’s immune response. The 5-year cumulative incidence of cirrhosis ranges from 8% to 20% in patients with untreated CHB and the 5-year cumulative risk of hepatic decompensation among those with cirrhosis is 20% [2]. The annual risk of HCC in patients with cirrhosis has been reported to be 2–5% [3]. The risk factors for CHB progressing to cirrhosis or HCC include not only host-related or viral factors, but also social-environmental factors (e.g., alcohol consumption, metabolic syndrome, diabetes mellitus [DM], obesity, and smoking) [4]. There have been efforts over decades to predict clinical outcomes in patients with CHB for proper and timely managements such as GAGHCC [5], CU-HCC [6], REACH-B [7], or PAGE-B [8] for predicting HCC development, hepatic decompensation [9] and overall survival (OS) [10] and model for end-stage liver disease, hepatic venous pressure gradient, and albumin for predicting hepatic decompensation [9] and OS [10] in previous literatures.
Deep learning-based computed tomography (CT) metric analysis provides three-dimensional organ volumetric parameters and body composition measurements [11,12]. Furthermore, previous investigations [13,14] showed that fully automated quantitative tissue composition analysis using CT scans may predict future serious adverse events and add opportunistic value to CT scans performed for other indications. Considering the promising results of previous studies, we surmised that body composition analysis and organ volume measurement using liver CT images may also provide prognostic information regarding the risk of HCC occurrence or development of hepatic decompensation in patients with compensated CHB.
Therefore, the purpose of this study was to evaluate the prognostic value of CT analysis using deep learning algorithm in patients with CHB.

MATERIALS AND METHODS

This study was approved by our institutional review board (IRB No.: 2108-143-1246) and the requirement for signed informed consent was waived owing to the retrospective design.

Patients

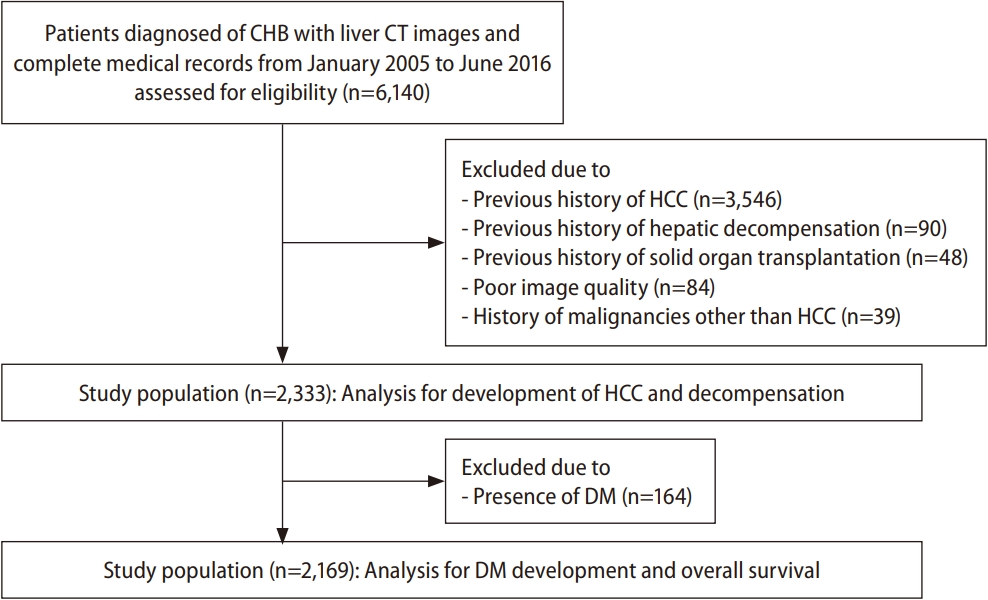
The inclusion criteria were: 1) patients aged between 19 and 85 years, 2) patients who were diagnosed with CHB, and 3) patients having both a contrast-enhanced abdominal CT scan and complete medical records, including liver function tests, between January 2006 and June 2016 (Fig. 1). According to the inclusion criteria, 6,140 consecutive patients were assessed for eligibility. The exclusion criteria were: 1) previous history of HCC (n=3,546), 2) previous history of hepatic decompensation (n=90), 3) previous history of solid organ transplantation (n=48), 4) poor image quality of abdominal CT scan, when reviewed by a radiologist (n=84), and 5) history of malignancies other than HCC (n=39). Finally, 2,333 patients constituted the study population.

CT image acquisition

All patients underwent abdominal CT scans, including the arterial and portal venous phase, using various types of CT scanners owing to the retrospective study design. CT scanning was performed using the following parameters: tube voltage, 90–120 kVp according to the scanner type; tube current-time products, 100–300 mAs; rotation time, 0.5 s; pitch, 0.6–1.2; and slice thickness, 3 mm. Iobitridol (Xenetix 350; Guerbet, Aulnay-sous-Bois, France) was intravenously injected at a dose of 520 mg/kg body weight using a power injector (Stellent; Bayer AG, Berlin, Germany) for 30 s at a rate of 2–5 mL/s according to body weight, followed by a 20–30-mL saline flush. Using the bolus tracking method, arterial phase scans were started 17–23 s after the enhancement threshold (100–150 HU) was reached in the descending thoracic aorta. For portal venous phase scans, a fixed delay of 60–75 s was used.

Body composition and organ volume analysis using CNN

CT images were processed in an automated analysis software program using convolutional neural network (CNN) (DeepCatch and MEDIP; MedicalIP Co. Ltd., Seoul, Korea; http://www.medicalip.com). After uploading portal venous phase CT images to commercially available segmentation software (MEDIP Deep Catch v1.0.0.0; MedicalIP Co. Ltd.), a three-dimensional U-Net automatically provided volumetric segmentation of body components into seven classes (skin, subcutaneous fat, muscle, visceral fat, bone, internal organs and vessels, and the central nervous system) (Fig. 2). The average dice scores for muscles, visceral fat, and for subcutaneous fat were 96.8–99.2%, 95.1–98.9%, and 97.1–99.7%, respectively, in the domestic validation sets [12]. After segmentation, the software also provided automatic segmentation and labeling of the body composition area at the L3-level cross-sectional image. An experienced radiologist, who was blinded to the patients’ clinicopathological information, confirmed the results of the segmentation. Subsequently, L3-level sectional area (cm2) of the skeletal muscle, subcutaneous adipose tissue (SAT), and visceral adipose tissue (VAT) were normalized to the height (m2) [15-17] and were labeled as skeletal muscle, SAT, and VAT indices, respectively. Additionally, three-dimensional segmentation of the liver and spleen was performed and the organ volumes were automatically calculated. Spleen and liver volumes were normalized to the body surface area (m2), which was calculated as body weight (kg)0.425×height (cm)0.725 ×0.007184 [18].

Endpoints

The primary endpoint was OS and the secondary endpoints were liver-related (i.e., development of HCC and decompensation) and metabolic outcomes (i.e., development of DM). We assessed the cumulative incidence of the occurrence of HCC, hepatic decompensation, DM, and death. Development of HCC was determined histopathologically in patients who underwent surgical resection or percutaneous biopsy, or based on imaging features categorized into “LR-5” according to the Liver Imaging Reporting and Data System [19] or “definite HCC” according to the 2022 Korean Liver Cancer Association and National Cancer Center Korea practice guidelines [20], in patients without histopathologic analysis. The development of hepatic decompensation was defined as the occurrence of variceal bleeding, spontaneous bacterial peritonitis, hepatic encephalopathy, or hepatorenal syndrome [21]. The development of DM was determined based on medical records. OS was calculated as the interval between the day of the baseline liver CT and death or the last follow-up date. The survival data of the study population was acquired from the national registry data from the Korean Ministry of Interior and Safety. The data cut-off date was January 31, 2022.

Statistical analysis

All statistical analyses were performed using IBM SPSS Statistics for Windows version 27.0 (IBM Corp., Armonk, NY, USA), SAS version 9.3 (SAS Institute Inc., Cary, NC, USA), and MedCalc Statistical Software version 18.9.1 (MedCalc Software bvba, Ostend, Belgium; https://www.medcalc.org; 2019). Univariate and multivariate Cox proportional hazards logistic regression analyses were performed to identify significant predictors of each outcome. All variables with p-values less than 0.05, in univariate analyses, were included in the multivariate analysis using stepwise selection. The Kaplan–Meier method was used for estimation of the cumulative incidence of each outcome. The optimal cut-off values of body composition and organ volume measurements for predicting each outcome were determined using the minimal P-value approach based on log-rank test statistics [22]. Statistical significance was set at a P-value <0.05.

RESULTS

Patient characteristics

Baseline characteristics of the 2,333 patients (Male: Female=1,396:937; median age, 52.0 years [interquartile range {IQR}, 45.0–59.0]) are summarized in Table 1. Among them, 164 patients had DM at the time of enrollment. For all patients, body composition data including skeletal muscle, VAT, and SAT indices were successfully obtained from CT data analyzed by deep learning algorithm. Additionally, liver and spleen volumes of each patient were successfully acquired from their CT data via deep learning algorithm and standardized by dividing by body surface area.

Predictive factors for HCC development

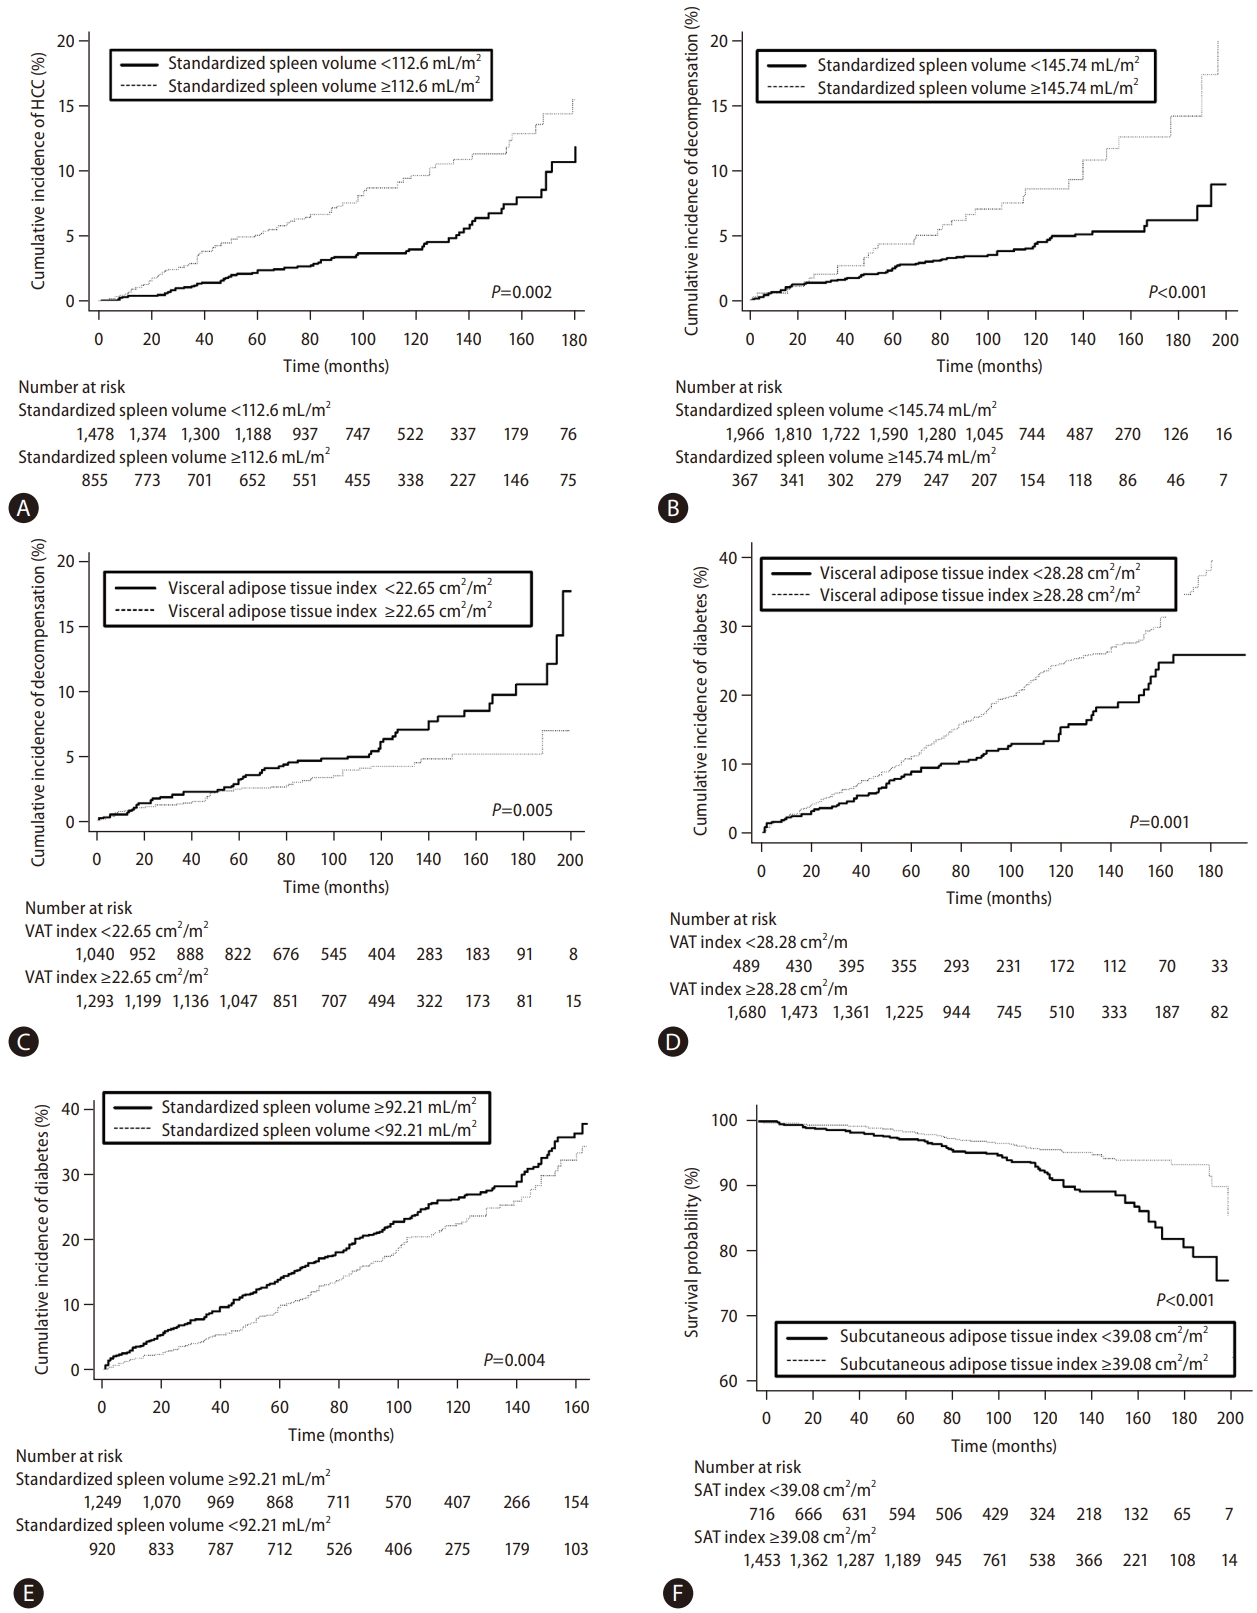
During a median follow-up period of 103 months, HCC developed in 134 patients (5.7%, 134/2,333) with the following stages at diagnosis: Barcelona-Clinic Liver Cancer stage 0 (n=70), stage A (n=59), stage B (n=4), and stage C (n=1). The estimated the 1-, 5-, and 10-year cumulative incidences of HCC occurrence were 0.6%, 3.2%, and 6.1%, respectively. According to the multivariate analysis, standardized spleen volume was one of the significant predictive factors for HCC development (hazard ratio [HR]=1.01, 95% confidence interval [CI]=1.01–1.01, P=0.025), along with age, sex, albumin level, and platelet count (Table 2). The optimal cut-off value for the standardized spleen volume was set at 112.6 mL/m2 to predict HCC development. The estimated 1-, 5-, and 10-year cumulative incidences of HCC development in 773 patients with standardized spleen volumes ≥112.6 mL/m2 were 0.8%, 5.1%, and 9.9%, respectively, and were significantly higher than those in 1,396 patients with standardized spleen volumes <112.6 mL/m2 which were 0.4%, 2.2%, and 3.9%, respectively (HR=1.71, 95% CI =1.21–2.42, P=0.002) (Fig. 3A).

Predictive factors for the development of hepatic decompensation

During the follow-up period, 103 patients (4.4%, 103/2,333) experienced hepatic decompensation with the development of: ascites (n=59); hepatic encephalopathy (n=33); and variceal bleeding (n=11). The estimated 1-, 5-, and 10-year cumulative incidences for the development of hepatic decompensation were 0.7%, 2.8%, and 5.1%, respectively. On multivariate analysis, age and serum albumin level were significantly associated with the development of hepatic decompensation. In addition, standardized spleen volume (HR=1.01, 95% CI=1.01–1.01, P<0.001) and VAT index (HR=0.98, 95% CI=0.97–0.99, P=0.004) were also significant predictive factors for hepatic decompensation (Table 3). The optimal cut-off value of the standardized spleen volume was set at 145.74 mL/m2 to predict hepatic decompensation. The estimated 1-, 5-, and 10-year cumulative incidences of hepatic decompensation in 329 patients with a standardized spleen volume ≥145.74 mL/m2 were 0.6%, 4.4%, and 9.1%, respectively, and were significantly lower than those of 1,840 patients with a standardized spleen volume <145.74 mL/m2 which was 0.7%, 2.5%, and 3.9%, respectively (HR=2.34, 95% CI =1.51–3.63, P<0.001) (Fig. 3B). Regarding the VAT index, the optimal cut-off value was set at 22.65 cm2/m2 to predict hepatic decompensation. The estimated 1-, 5-, and 10-year cumulative incidences of hepatic decompensation in 990 patients with a VAT index <22.65 cm2/m2 were 0.5%, 3.3%, and 6.1%, respectively, which were significantly higher than those of 1,179 patients with a VAT index ≥22.65 cm2/m2 which were 0.8%, 2.4%, and 4.2%, respectively (HR=0.57, 95% CI=0.38–0.84, P=0.005) (Fig. 3C).

Predictive factors for the development of DM

We excluded 164 patients who had DM at the time of enrollment to examine the development of DM. During the follow-up period, DM developed in 432 patients (19.9%, 432/2,169). The estimated 1-, 5-, and 10-year cumulative incidences for the development of DM were 2.7%, 10.7%, and 22.7%, respectively. Multivariate analysis revealed that VAT index (HR=1.01, 95% CI=1.01–1.01, P=0.001) and standardized spleen volume (HR=1.01, 95% CI=1.01–1.01, P=0.001) were among the significant predictors for the development of DM (Table 4), along with sex, age, and albumin level. The optimal cut-off value of the VAT index was set at 28.28 cm2/m2 to predict the development of DM. The estimated 1-, 5-, and 10-year cumulative incidences of DM development in 1,680 patients with a VAT index ≥28.28 cm2/m2 were 2.7%, 11.2%, and 24.8%, respectively, and were significantly higher than those of 489 patients with a VAT index of <28.28 cm2/m2 which were 2.5%, 9.0%, and 15.4%, respectively, (HR=1.34, 95% CI =1.13–1.74, P=0.001) (Fig. 3D). Regarding the standardized spleen volume, the optimal cut-off value was set at 92.21 mL/m2 to predict the development of DM. The estimated 1-, 5-, and 10-year cumulative incidences of DM development in 1,249 patients with a standardized spleen volume ≥92.21 mL/m2 were 3.4%, 12.7%, and 24.7%, respectively, and were significantly higher than those of 920 patients with a standardized spleen volume <92.21 mL/m2 which were 1.7%, 8.1%, and 20.0%, respectively (HR=1.35, 95% CI=1.10–1.67, P=0.004) (Fig. 3E).

Predictive factors for OS

We excluded 164 patients who had DM at the time of enrollment to examine OS. During the follow-up period, 120 patients (5.5%, 120/2,169) died. The causes of death were: unknown (n=104, 86.7%), liver cirrhosis-related complications (n=6, 5.0%), pneumonia (n=6, 5.0%), and progression of HCC (n=4, 3.3%). The estimated 1-, 5-, and 10-year OS were 99.6%, 98.1%, and 94.5%, respectively. Multivariate analysis revealed that the SAT index (HR=0.99, 95% CI=0.98–0.99, P=0.004) was significantly associated with OS, along with age, albumin, and the Model for End-Stage Liver Disease score (Table 5). The optimal cut-off value of the SAT index was set at 39.08 cm2/m2 to predict OS. The estimated 1-, 5-, and 10-year OS in 1,453 patients with a SAT index ≥39.08 cm2/m2 were 99.7%, 98.5%, and 95.6%, respectively, and were significantly higher than those of 716 patients with a SAT index <39.08 cm2/m2 which were 99.4%, 97.2%, and 92.5%, respectively (HR=0.49, 95% CI=0.34–0.70, P<0.001) (Fig. 3F).

DISCUSSION

In this study, body composition data and spleen and liver volumes were automatically acquired from portal venous phase CT images using CNN in all patients. Standardized spleen volume was significantly associated with the development of HCC, hepatic decompensation, and DM; furthermore, the VAT index was correlated with the development of hepatic decompensation and DM. In addition, a higher SAT index correlated with increased OS.
Although ultrasound is currently the recommended modality for HCC screening in patients with CHB [23,24], its sensitivity for detecting HCC can be commonly reduced in situations such as limited sonic window, inherent liver blind spots, or coarse liver parenchyma masking focal lesions [25]. Considering that CT scans can be performed as an alternative imaging modality in such circumstances [25], we expect that body composition and spleen volumetric data automatically and additionally obtained by applying CNN-based fully automated algorithm on CT data, can be used for opportunistically predicting the comprehensive prognosis of patients with CHB. Our study results are in line with those from previous studies [13,26,27] showing the usefulness of automated CT-based opportunistic screening of various diseases such as cardiovascular events, osteoporosis, and sarcopenia.
Our study results showed the prognostic role of spleen volume in predicting the development of HCC and hepatic decompensation. As liver fibrosis and cirrhosis advance, the spleen tends to enlarge owing to both the accumulation of portal flow and tissue hyperplasia characterized by a combination of angiogenesis, fibrogenesis, enlargement, and hyperactivation of the splenic lymphoid compartment [28,29]. Therefore, spleen enlargement was reported as a potential surrogate marker of the severity of liver fibrosis and portal hypertension [30,31] and showed a significant association with the development of HCC and hepatic decompensation in previous studies [32,33], which aligns with our results. However, these previous studies determined a spleen enlargement of more than 12 cm on ultrasonography [33] or acquired splenic volume by applying a semi-automated software to CT scans [32]. In contrast, in this study, we obtained spleen volume using a deep learning-based fully automated segmentation tool, saving researchers’ time and efforts.
The association between CHB and DM has been controversial, and some previous studies [34,35] reported the increased prevalence of DM in patients with CHB, while others did not [36,37]. In our study, the spleen volume was a significant predictor of DM. Several mechanisms have been suggested to explain the association between hepatitis B viral (HBV) infection and the prevalence of DM [35]. The liver’s impairment resulting from HBV infection can potentially lead to disruptions in glycometabolism, owing to its crucial role in maintaining glucose homeostasis by managing both glucose storage and release [38]. Therefore, the significant correlation between the spleen volume and DM in our study may be attributable to the association between DM and HBV infection-induced chronic inflammation of the liver, which was represented by increased splenic volume.
In our study, a higher VAT index was associated with hepatic decompensation and DM, whereas a higher SAT index was significantly correlated with increased OS. In previous studies [39,40], obesity, represented by the body mass index, was a significant risk factor for decompensation in patients with cirrhosis of all etiologies. Moreover, obesity-related changes in insulin and leptin may change intrahepatic vascular resistance [40], leading to portal hypertension. However, body mass index alone may not be an accurate predictor of outcomes since it does not reflect the distribution of fat deposition [41]. Recently, growing evidence indicates that adipose tissue plays an active role in influencing endocrine function, immunity (i.e., leptin and adiponectin), and angiogenesis (i.e., angiopoietin-2, vascular endothelial growth factor, leptin, and adiponectin) [42,43]. Adipose tissue is currently divided into SAT and VAT based on location and functions. The VAT index was an independent predictor of DM in our study, which can be explained by previous studies showing significant correlations between increased visceral adiposity with insulin resistance in patients with DM [44,45]. In contrast, the favorable effects of increased SAT on survival were demonstrated in patients with various oncologic diseases [46,47] and cirrhosis [48], which are concordant with our study results. The reasons for the protective effects of high subcutaneous adiposity were not clearly identified; however, potential explanations include the association between leptin produced by SAT and better insulin sensitivity and energy metabolism, as well as less prevalent cachectic state inducing energy exhaustion in patients with increased SAT [49]. Based on these results from ours, fully automated body composition measurements using CNN on CT data which quantifies the distribution of fat deposition, rather than merely determining the presence of obesity according to the body mass index, may provide more accurate information regarding prognosis.
Our study has several limitations. First, this was a retrospective study from a single tertiary referral center; therefore, selection bias was unavoidable. Furthermore, our study results were not externally validated in other patient cohorts. Therefore, further studies are warranted to validate our study results. Second, our study did not provide longitudinal follow-up data which might have shown different results.
In conclusion, a larger spleen volume was significantly associated with HCC, hepatic decompensation, and DM occurrence. A higher abdominal VAT index was correlated with the development of DM, while a higher SAT index was correlated with increased OS in patients with CHB. Deep learning-based automatically measured spleen volume, abdominal VAT and SAT indices may be used as opportunistic prognostic factors in patients with CHB.

ACKNOWLEDGMENTS

This study was supported by a research grant (No. 04-2021-2310) from Seoul National University Hospital, Seoul, Korea.

FOOTNOTES

Authors’ contribution
Jeongin Yoo: analysis and interpretation of data; drafting manuscript; critical revision of the manuscript; obtained funding. Heejin Cho: acquisition of data; critical revision of the manuscript. Dong Ho Lee: study concept and design; analysis and interpretation of data; supervision; critical revision of the manuscript. Eun Ju Cho: study concept and design; supervision; critical revision of the manuscript. Ijin Joo: study concept and design; acquisition of data. Sun Kyung Jeon: study concept and design; acquisition of data. All authors approved the final version of the manuscript.
Conflicts of Interest
The authors have no conflictsto disclose.

Figure 1.
Patient enrollment process. CHB, chronic hepatitis B; CT, computed tomography; DM, diabetes mellitus; HCC, hepatocellular carcinoma.

cmh-2023-0190f1.jpg
Figure 2.
Fully automated body composition and organ volume analysis using convolutional neural network. (A) A three-dimensional U-Net automatically provided volumetric segmentation of body components into seven classes (skin, subcutaneous fat, muscle, visceral fat, bone, internal organs and vessels, and the central nervous system). (B) An axial image showsthe results of segmentation, which are overlaid on orthogonal cross-sectional images at the L3 vertebral-body level. Pink, yellow, green, and purple colors indicate skeletal muscle, subcutaneous fat, visceral fat, and internal organs, respectively. (C) An axial image shows the results of organ segmentation of the liver (yellow) and spleen (red), which are overlaid on the CT image. (D) Three-dimensionalsegmentation of the liver and spleen was performed. CT, computed tomography.

cmh-2023-0190f2.jpg
Figure 3.
Kaplan–Meier estimation of cumulative incidences of HCC, hepatic decompensation, development of DM, and overall survival in patients stratified according to body composition measurements and organ volumes. (A) The cumulative incidence of HCC of 855 patients with a standardized spleen volume ≥112.6 mL/m2 was significantly higher than that of 1,478 patients with a standardized spleen volume <112.6 mL/m2 (P<0.001). (B) The cumulative incidence of hepatic decompensation of 367 patients with a standardized spleen volume ≥145.74 mL/m2 was significantly higher than that of 1966 patients with a standardized spleen volume <145.74 mL/m2 (P<0.001). (C) The cumulative incidence of hepatic decompensation of 1,040 patients with a VAT index <22.65 cm2/m2 was significantly higher than that of 1,293 patients with a VAT index ≥22.65 cm2/m2 (P=0.012). (D) The cumulative incidence of DM of 1,680 patients with a VAT index ≥28.28 cm2/m2 was significantly higher than that of 489 patients with a VAT index <28.28 cm2/m2 (P<0.001). (E) The cumulative incidence of DM development of 1,249 patients with a standardized spleen volume ≥92.21 mL/m2 was significantly higher than that of 920 patients with a standardized spleen volume <92.21 mL/m2 (P=0.040). (F) The overall survival of 1,453 patients with a SAT index ≥39.08 cm2/m2 was significantly higher than that of 716 patients with a SAT index <39.08 cm2/m2 (P<0.001). HCC, hepatocellular carcinoma; VAT, visceral adipose tissue; DM, diabetes mellitus; SAT, subcutaneous adipose tissue.

cmh-2023-0190f3.jpg

cmh-2023-0190f4.jpg
Table 1.
Baseline characteristics of 2,333 patients with compensated chronic liver disease from CHB
Characteristic Value
Age (yr) 52.0 (45.0–59.0)
Sex
 Males 1,396 (59.8)
 Females 937 (40.2)
Diabetes
 Yes 164 (7.0)
 No 2,169 (93.0)
Alanine aminotransferase (IU/L) 27.0 (19.0–47.0)
Serum albumin (g/L) 43.0 (41.0–45.0)
Total bilirubin level (mg/dL) 0.9 (0.7–1.2)
Prothrombin activity (INR) 1.03 (0.97–1.08)
Platelet count (K/mm3) 195.0 (159.0–233.0)
Alpha fetoprotein (ng/mL) 2.7 (1.6–4.2)
APRI 0.35 (0.25–0.58)
FIB-4 1.41 (0.99–2.05)
MELD 7.0 (6.5–8.0)
Body mass index (kg/m2) 23.8 (21.8–26.0)
Standardized liver volume (mL/cm2) 715.7 (641.8–802.4)
Standardized spleen volume (mL/cm2) 99.1 (78.0–128.4)
Skeletal muscle index (cm2/m2) 47.1 (40.9–53.6)
Visceral adipose tissue index (cm2/m2) 25.3 (11.9–41.7)
Subcutaneous adipose tissue index (cm2/m2) 48.0 (34.5–64.5)
Antiviral therapy
 Yes 1,276 (54.7)
 No 1,057 (45.3)
HBeAg
 Yes 1,877 (80.5)
 No 456 (19.5)
REACH-B 7.0 (6.0–10.0)

Values are presented as median (interquartile range) or number (%).

CHB, chronic hepatitis B viral infection; INR, international normalized ratio; IU, international unit; APRI, aspar tate aminotransferase-to-platelet ratio index; FIB-4, fibrosis-4 index; MELD, model for end-stage liver disease; HBeAg, hepatitis B e antigen; REACH-B, risk estimate for hepatocellular carcinoma in chronic hepatitis B.

Table 2.
The predictors for development of HCC in 2,333 patients with compensated chronic liver disease from CHB
Characteristic Univariate
Multivariate
Hazard ratio 95% CI P-value Hazard ratio 95% CI P-value
Sex (female) 0.46 0.31–0.69 <0.001 0.57 0.38–0.87 0.010
Age (per 1 year) 1.03 1.01–1.05 0.001 1.02 1.01–1.04 0.015
Body mass index (kg/m2) 1.04 0.99–1.08 0.108
Antiviral therapy (yes) 1.46 1.05–2.03 0.024 0.95 0.65–1.38 0.785
HBeAg (positive) 1.16 0.79–1.70 0.458
Alanine aminotransferase (IU/L) 1.00 0.99–1.01 0.518
Albumin (g/L) 0.63 0.50–0.80 <0.001 0.77 0.59–1.02 0.068
Total bilirubin (mg/dL) 1.01 0.90–1.12 0.912
PT-INR 1.00 0.94–1.07 0.982
Platelet count (K/mm3) 0.99 0.99–0.99 <0.001 0.99 0.99–0.99 0.002
AFP (ng/mL) 1.00 0.99–1.01 0.157
Standardized liver volume (mL/m2) 0.99 0.99–1.00 0.099
Standardized spleen volume ≥112.6 mL/m2 1.92 1.36–2.69 <0.001 1.71 1.21–2.42 0.002
Skeletal muscle index (cm2/m2) 1.00 0.99–1.01 0.901
Visceral adipose tissue index (cm2/m2) 1.00 0.99–1.01 0.709
Subcutaneous adipose tissue index (cm2/m2) 0.99 0.99–1.00 0.016 1.00 0.99–1.01 0.835
APRI 1.00 0.97–1.03 0.982
FIB-4 1.00 0.99–1.01 0.923
REACH-B 1.26 1.20–1.33 <0.001 1.20 1.12–1.28 <0.001
MELD 1.07 1.02–1.12 0.003 1.00 0.95–1.06 0.895

CHB, chronic hepatitis B viral infection; HCC, hepatocellular carcinoma; CI, confidence interval; HBeAg, hepatitis B e antigen; PT-INR, prothrombin time international normalized ratio; AFP, alpha fetoprotein; APRI, aspartate aminotransferase-to-platelet ratio index; FIB-4, fibrosis-4 index; REACH-B, risk estimate for hepatocellular carcinoma in chronic hepatitis B; MELD, model for end-stage liver disease.

P<0.05.

Table 3.
The predictors for development of decompensation in 2,333 patients with compensated chronic liver disease from CHB
Characteristic Univariate
Multivariate
Hazard ratio 95% CI P-value Hazard ratio 95% CI P-value
Sex (female) 1.09 0.75–1.60 0.647
Age (per 1 year) 1.06 1.04–1.08 <0.001 1.06 1.04–1.08 <0.001
Body mass index (kg/m2) 1.01 0.98–1.05 0.493
Antiviral therapy (yes) 1.14 0.79–1.66 0.488
HBeAg (positive) 1.21 0.78–1.88 0.397
Alanine aminotransferase (IU/L) 1.00 0.99–1.01 0.369
Albumin (g/L) 0.52 0.42–0.64 <0.001 0.59 0.45–0.77 <0.001
Total bilirubin (mg/dL) 0.91 0.69–1.19 0.469
PT-INR 1.00 0.91–1.10 0.967
Platelet count (K/mm3) 1.00 0.99–1.01 0.115
AFP (ng/mL) 1.00 0.99–1.01 0.245
Standardized liver volume (mL/m2) 1.00 0.99–1.00 0.383
Standardized spleen volume ≥145.7 mL/m2 2.14 1.39–3.27 <0.001 2.34 1.51–3.63 <0.001
Skeletal muscle index (cm2/m2) 1.00 0.99–1.01 0.780
Visceral adipose tissue index ≥22.65 cm2/m2 0.61 0.41–0.90 0.013 0.57 0.38–0.84 0.005
Subcutaneous adipose tissue index (cm2/m2) 0.99 0.99–1.00 0.120
APRI 0.99 0.92–1.05 0.660
FIB-4 1.00 0.98–1.01 0.855
REACH-B 1.14 1.07–1.21 <0.001 1.05 0.98–1.12 0.144
MELD 1.07 1.02–1.12 0.008 1.02 0.96–1.07 0.564

CHB, chronic hepatitis B viral infection; CI, confidence interval; HBeAg, hepatitis B e antigen; PT-INR, prothrombin time international normalized ratio; AFP, alpha fetoprotein; APRI, aspartate aminotransferase-to-platelet ratio index; FIB-4, fibrosis-4 index; REACH-B, risk estimate for hepatocellular carcinoma in chronic hepatitis B; MELD, model for end-stage liver disease.

P<0.05.

Table 4.
The predictors for development of diabetes mellitus in 2,169 patients with compensated chronic liver disease from CHB
Characteristic Univariate
Multivariate
Hazard ratio 95% CI P-value Hazard ratio 95% CI P-value
Sex (female) 0.70 0.57–0.85 <0.001 0.73 0.56–0.95 0.017
Age (per 1 year) 1.04 1.03–1.05 <0.001 1.05 1.04–1.06 <0.001
Body mass index (kg/m2) 1.01 0.99–1.03 0.211
Antiviral therapy (yes) 1.14 0.94–1.37 0.189
Alanine aminotransferase (IU/L) 1.00 0.99–1.01 0.604
Albumin (g/L) 0.80 0.67–0.95 0.013 0.79 0.65–0.95 0.014
Total bilirubin (mg/dL) 0.98 0.91–1.07 0.690
PT-INR 0.99 0.93–1.06 0.820
Platelet count (K/mm3) 1.00 0.99–1.01 0.116
AFP (ng/mL) 1.00 0.99–1.01 0.431
Standardized liver volume (mL/m2) 1.01 1.01–1.01 0.004 1.00 0.99–1.01 0.075
Standardized spleen volume ≥92.21 mL/m2 1.23 1.01–1.49 0.040 1.35 1.10–1.67 0.004
Skeletal muscle index (cm2/m2) 1.00 0.99–1.01 0.686
Visceral adipose tissue index ≥28.28 cm2/m2 1.56 1.21–2.02 0.001 1.34 1.13–1.74 0.001
Subcutaneous adipose tissue index (cm2/m2) 1.00 0.99–1.01 0.927
APRI 1.00 0.98–1.02 0.932
FIB-4 0.99 0.99–1.01 0.571
MELD 1.05 1.01–1.09 0.007 1.03 0.99–1.07 0.176

CHB, chronic hepatitis B viral infection; CI, confidence interval; PT-INR, prothrombin time international normalized ratio; AFP, alpha fetoprotein; APRI, aspartate aminotransferase-to-platelet ratio index; FIB-4, fibrosis-4 index; MELD, model for end-stage liver disease.

P<0.05.

Table 5.
The predictors for death in 2,169 patients with compensated chronic liver disease from CHB
Characteristic Univariate
Multivariate
Hazard ratio 95% CI P-value Hazard ratio 95% CI P-value
Sex (female) 0.68 0.46–1.01 0.053
Age (per 1 year) 1.09 1.07–1.12 <0.001 1.09 1.07–1.11 <0.001
Body mass index (kg/m2) 0.97 0.94–0.99 0.015
Antiviral therapy (yes) 1.00 0.70–1.43 0.999
Alanine aminotransferase (IU/L) 1.00 1.00–1.01 0.085
Albumin (g/L) 0.48 0.40–0.58 <0.001 0.51 0.40–0.65 <0.001
Total bilirubin (mg/dL) 1.06 0.99–1.15 0.115
PT-INR 1.00 0.93–1.08 0.935
Platelet count (K/mm3) 1.00 0.99–1.01 0.784
AFP (ng/mL) 1.00 1.00–1.01 0.073
Standardized liver volume (mL/m2) 1.00 0.99–1.00 0.737
Standardized spleen volume 1.00 0.99–1.01 0.148
Skeletal muscle index (cm2/m2) 0.99 0.98–1.01 0.361
Visceral adipose tissue index (cm2/m2) 0.99 0.99–1.00 0.678
Subcutaneous adipose tissue index ≥39.08 cm2/m2 0.46 0.32–0.66 <0.001 0.49 0.34–0.70 <0.001
APRI 1.01 0.99–1.03 0.269
FIB-4 1.00 0.99–1.01 0.911
MELD 1.12 1.08–1.17 <0.001 1.09 1.04–1.14 <0.001

CHB, chronic hepatitis B viral infection; CI, confidence interval; PT-INR, prothrombin time international normalized ratio; AFP, alpha fetoprotein; APRI, aspartate aminotransferase-to-platelet ratio index; FIB-4, fibrosis-4 index; MELD, model for end-stage liver disease.

P<0.05.

Abbreviations

CHB
chronic hepatitis B
CI
confidence interval
CT
computed tomography
DM
diabetes mellitus
HCC
hepatocellular carcinoma
HR
hazard ratio
OS
overall survival

REFERENCES

1. European Association for the Study of the Liver. EASL 2017 Clinical Practice Guidelines on the management of hepatitis B virus infection. J Hepatol 2017;67:370-398.
crossref pmid
2. European Association for the Study of the Liver. EASL clinical practice guidelines: Management of chronic hepatitis B virus infection. J Hepatol 2012;57:167-185.
crossref pmid
3. Raffetti E, Fattovich G, Donato F. Incidence of hepatocellular carcinoma in untreated subjects with chronic hepatitis B: a systematic review and meta-analysis. Liver Int 2016;36:1239-1251.
crossref pmid pdf
4. Varbobitis I, Papatheodoridis GV. The assessment of hepatocellular carcinoma risk in patients with chronic hepatitis B under antiviral therapy. Clin Mol Hepatol 2016;22:319-326.
crossref pmid pmc pdf
5. Yuen MF, Tanaka Y, Fong DY, Fung J, Wong DK, Yuen JC, et al. Independent risk factors and predictive score for the development of hepatocellular carcinoma in chronic hepatitis B. J Hepatol 2009;50:80-88.
crossref pmid
6. Wong VW, Chan SL, Mo F, Chan TC, Loong HH, Wong GL, et al. Clinical scoring system to predict hepatocellular carcinoma in chronic hepatitis B carriers. J Clin Oncol 2010;28:1660-1665.
crossref
7. Chen CJ, Yang HI, Su J, Jen CL, You SL, Lu SN, et al. Risk of hepatocellular carcinoma across a biological gradient of serum hepatitis B virus DNA level. JAMA 2006;295:65-73.
crossref pmid
8. Papatheodoridis G, Dalekos G, Sypsa V, Yurdaydin C, Buti M, Goulis J, et al. PAGE-B predicts the risk of developing hepatocellular carcinoma in Caucasians with chronic hepatitis B on 5-year antiviral therapy. J Hepatol 2016;64:800-806.
crossref pmid
9. Ripoll C, Groszmann R, Garcia-Tsao G, Grace N, Burroughs A, Planas R, et al. Hepatic venous pressure gradient predicts clinical decompensation in patients with compensated cirrhosis. Gastroenterology 2007;133:481-488.
crossref pmid
10. Ripoll C, Bañares R, Rincón D, Catalina MV, Lo Iacono O, Salcedo M, et al. Influence of hepatic venous pressure gradient on the prediction of survival of patients with cirrhosis in the MELD Era. Hepatology 2005;42:793-801.
crossref pmid
11. Weston AD, Korfiatis P, Kline TL, Philbrick KA, Kostandy P, Sakinis T, et al. Automated abdominal segmentation of CT scans for body composition analysis using deep learning. Radiology 2019;290:669-679.
crossref pmid
12. Lee YS, Hong N, Witanto JN, Choi YR, Park J, Decazes P, et al. Deep neural network for automatic volumetric segmentation of whole-body CT images for body composition assessment. Clin Nutr 2021;40:5038-5046.
crossref pmid
13. Pickhardt PJ, Graffy PM, Zea R, Lee SJ, Liu J, Sandfort V, et al. Automated CT biomarkers for opportunistic prediction of future cardiovascular events and mortality in an asymptomatic screening population: a retrospective cohort study. Lancet Digit Health 2020;2:e192-e200.
crossref pmid pmc
14. Pickhardt PJ, Correale L, Hassan C. AI-based opportunistic CT screening of incidental cardiovascular disease, osteoporosis, and sarcopenia: cost-effectiveness analysis. Abdom Radiol (NY) 2023;48:1181-1198.
crossref pmid pdf
15. Sakamoto T, Yagyu T, Uchinaka E, Miyatani K, Hanaki T, Kihara K, et al. Sarcopenia as a prognostic factor in patients with recurrent pancreatic cancer: a retrospective study. World J Surg Oncol 2020;18:221.
crossref pmid pmc pdf
16. Jang M, Park HW, Huh J, Lee JH, Jeong YK, Nah YW, et al. Predictive value of sarcopenia and visceral obesity for postoperative pancreatic fistula after pancreaticoduodenectomy analyzed on clinically acquired CT and MRI. Eur Radiol 2019;29:2417-2425.
crossref pmid pdf
17. Pecorelli N, Capretti G, Sandini M, Damascelli A, Cristel G, De Cobelli F, et al. Impact of sarcopenic obesity on failure to rescue from major complications following pancreaticoduodenectomy for cancer: Results from a multicenter study. Ann Surg Oncol 2018;25:308-317.
crossref pdf
18. Du Bois D, Du Bois EF. A formula to estimate the approximate surface area if height and weight be known. 1916. Nutrition 1989;5:303-311 discussion 312-313.

19. Americal College of Radiology Committee on LI-RADS®. CT/MRI LI-RADS® v2018 core. ACR web site, <https://www.acr.org/-/media/ACR/Files/RADS/LI-RADS/LI-RADS-2018-Core>. Accessed 8 Aug 2023.

20. Korean Liver Cancer Association (KLCA) and National Cancer Center (NCC) Korea. 2022 KLCA-NCC Korea practice guidelines for the management of hepatocellular carcinoma. Clin Mol Hepatol 2022;28:583-705.
crossref pdf
21. D’Amico G, Garcia-Tsao G, Pagliaro L. Natural history and prognostic indicators of survival in cirrhosis: a systematic review of 118 studies. J Hepatol 2006;44:217-231.
crossref pmid
22. Contal C, O’Quigley J. An application of changepoint methods in studying the effect of age on survival in breast cancer. Computational Statistics & Data Analysis 1999;30:253-270.
crossref
23. Terrault NA, Lok ASF, McMahon BJ, Chang KM, Hwang JP, Jonas MM, et al. Update on prevention, diagnosis, and treatment of chronic hepatitis B: AASLD 2018 hepatitis B guidance. Hepatology 2018;67:1560-1599.
crossref pmid pmc pdf
24. European Association for the Study of the Liver. EASL Clinical Practice Guidelines: Management of hepatocellular carcinoma. J Hepatol 2018;69:182-236.
crossref pmid
25. Kim DH, Choi JI. Current status of image-based surveillance in hepatocellular carcinoma. Ultrasonography 2021;40:45-56.
crossref pmid pmc pdf
26. Jang S, Graffy PM, Ziemlewicz TJ, Lee SJ, Summers RM, Pickhardt PJ. Opportunistic osteoporosis screening at routine abdominal and thoracic CT: Normative L1 trabecular attenuation values in more than 20 000 adults. Radiology 2019;291:360-367.
crossref pmid pmc
27. van der Werf A, Langius JAE, de van der Schueren MAE, Nurmohamed SA, van der Pant KAMI, Blauwhoff-Buskermolen S, et al. Percentiles for skeletal muscle index, area and radiation attenuation based on computed tomography imaging in a healthy Caucasian population. Eur J Clin Nutr 2018;72:288-296.
crossref pmid pmc pdf
28. Bolognesi M, Merkel C, Sacerdoti D, Nava V, Gatta A. Role of spleen enlargement in cirrhosis with portal hypertension. Dig Liver Dis 2002;34:144-150.
crossref pmid
29. Gracia-Sancho J, Marrone G, Fernández-Iglesias A. Hepatic microcirculation and mechanisms of portal hypertension. Nat Rev Gastroenterol Hepatol 2019;16:221-234.
crossref pmid pdf
30. Iranmanesh P, Vazquez O, Terraz S, Majno P, Spahr L, Poncet A, et al. Accurate computed tomography-based portal pressure assessment in patients with hepatocellular carcinoma. J Hepatol 2014;60:969-974.
crossref pmid
31. Liu P, Li P, He W, Zhao LQ. Liver and spleen volume variations in patients with hepatic fibrosis. World J Gastroenterol 2009;15:3298-3302.
crossref pmid pmc
32. Yoo J, Kim SW, Lee DH, Bae JS, Cho EJ. Prognostic role of spleen volume measurement using computed tomography in patients with compensated chronic liver disease from hepatitis B viral infection. Eur Radiol 2021;31:1432-1442.
crossref pmid pdf
33. Berzigotti A, Zappoli P, Magalotti D, Tiani C, Rossi V, Zoli M. Spleen enlargement on follow-up evaluation: a noninvasive predictor of complications of portal hypertension in cirrhosis. Clin Gastroenterol Hepatol 2008;6:1129-1134.
crossref pmid
34. Papatheodoridis GV, Chrysanthos N, Savvas S, Sevastianos V, Kafiri G, Petraki K, et al. Diabetes mellitus in chronic hepatitis B and C: prevalence and potential association with the extent of liver fibrosis. J Viral Hepat 2006;13:303-310.
crossref pmid
35. Cai C, Zeng J, Wu H, Shi R, Wei M, Gao Y, et al. Association between hepatitis B virus infection and diabetes mellitus: A meta-analysis. Exp Ther Med 2015;10:693-698.
crossref pmid pmc
36. Antonelli A, Ferri C, Fallahi P, Pampana A, Ferrari SM, Goglia F, et al. Hepatitis C virus infection: evidence for an association with type 2 diabetes. Diabetes Care 2005;28:2548-2550.
crossref pmid pdf
37. Huang ZS, Huang TS, Wu TH, Chen MF, Hsu CS, Kao JH. Asymptomatic chronic hepatitis B virus infection does not increase the risk of diabetes mellitus: a ten-year observation. J Gastroenterol Hepatol 2010;25:1420-1425.
crossref pmid
38. Tappy L, Minehira K. New data and new concepts on the role of the liver in glucose homeostasis. Curr Opin Clin Nutr Metab Care 2001;4:273-277.
crossref pmid
39. Berzigotti A, Garcia-Tsao G, Bosch J, Grace ND, Burroughs AK, Morillas R, et al. Obesity is an independent risk factor for clinical decompensation in patients with cirrhosis. Hepatology 2011;54:555-561.
crossref pmid pmc
40. Berzigotti A, Albillos A, Villanueva C, Genescá J, Ardevol A, Augustín S, et al. Effects of an intensive lifestyle intervention program on portal hypertension in patients with cirrhosis and obesity: The SportDiet study. Hepatology 2017;65:1293-1305.
crossref pmid pdf
41. Ahn JC, Sundaram V. Obesity and liver decompensation. Clin Liver Dis (Hoboken) 2019;14:12-15.
crossref pmid pmc pdf
42. Blaszczak AM, Jalilvand A, Hsueh WA. Adipocytes, innate immunity and obesity: A mini-review. Front Immunol 2021;12:650768.
crossref pmid pmc
43. Herold J, Kalucka J. Angiogenesis in adipose tissue: the interplay between adipose and endothelial cells. Front Physiol 2021;11:624903.
crossref pmid pmc
44. Frayn KN. Visceral fat and insulin resistance--causative or correlative? Br J Nutr 2000;83 Suppl 1:S71-S77.
crossref pmid
45. Gastaldelli A, Miyazaki Y, Pettiti M, Matsuda M, Mahankali S, Santini E, et al. Metabolic effects of visceral fat accumulation in type 2 diabetes. J Clin Endocrinol Metab 2002;87:5098-5103.
crossref pmid
46. Charette N, Vandeputte C, Ameye L, Bogaert CV, Krygier J, Guiot T, et al. Prognostic value of adipose tissue and muscle mass in advanced colorectal cancer: a post hoc analysis of two non-randomized phase II trials. BMC Cancer 2019;19:134.
crossref pmid pmc pdf
47. Ebadi M, Martin L, Ghosh S, Field CJ, Lehner R, Baracos VE, et al. Subcutaneous adiposity is an independent predictor of mortality in cancer patients. Br J Cancer 2017;117:148-155.
crossref pmid pmc pdf
48. Yu Q, Xu C, Li Q, Ding Z, Lv Y, Liu C, et al. Spleen volume-based non-invasive tool for predicting hepatic decompensation in people with compensated cirrhosis (CHESS1701). JHEP Rep 2022;4:100575.
crossref pmid pmc
49. Kim JM, Chung E, Cho ES, Lee JH, Shin SJ, Lee HS, et al. Impact of subcutaneous and visceral fat adiposity in patients with colorectal cancer. Clin Nutr 2021;40:5631-5638.
crossref pmid

Editorial Office
The Korean Association for the Study of the Liver
Room A1210, 53 Mapo-daero(MapoTrapalace, Dowha-dong), Mapo-gu, Seoul, 04158, Korea
TEL: +82-2-703-0051   FAX: +82-2-703-0071    E-mail: kasl@kams.or.kr
Copyright © The Korean Association for the Study of the Liver.         
COUNTER
TODAY : 366
TOTAL : 1797536
Close layer