Hepatic inflammatory pseudotumor misinterpreted as hepatocellular carcinoma
Article information
INTRODUCTION
Inflammatory pseudotumor (IPT) is a rare benign disease, but may develop in various organs.1 IPT that develops in the liver is very rare, and often accompanied by fever, malaise, and abdominal pain. IPT can be mistaken for malignant tumor such as cholangiocarcinoma or liver abscess due to lack of characteristic clinical and radiological features to suggest its diagnosis.1-4 Especially, IPT can be a vascular-rich tumor demonstrating radiological findings similar to those of hepatocellular carcinoma (HCC).5 If a patient with an IPT has risk factors for HCC such as chronic viral hepatitis and liver cirrhosis, the lesion may misdiagnosed as an HCC, only to be confirmed by biopsy or surgery.5,6
With a review of relevant literature, we report imaging features of hepatic IPT in a patient with chronic hepatitis B diagnosed by percutaneous core biopsy.
CASE
A 39-year-old Korean man was referred to the out-patient clinic for investigation of a 3 cm-sized liver mass, which had been detected incidentally by ultrasonography (US) during preoperative checkup for a mallet finger. He had a history of hepatitis B diagnosed one year ago and his daily alcohol intake was over 80 g for 10 years. Physical examination was unremarkable except for the mallet finger and his vital signs were normal.
The patient was positive for hepatitis B surface antigen and hepatitis B e antigen with high titer of HBV DNA (>1.7×10⁸ IU/mL), but negative for hepatitis B e antibody and hepatitis C virus antibody. Blood chemistry test revealed the following findings: hemoglobin 14.9 g/dL; leukocyte count, 9,500/mm3 with 60% neutrophil; erythrocyte sedimentation rate, 6 mm/hr; platelet count, 155,000/mm3; total protein, 7.4 g/dL; albumin 4.0 g/dL; total bilirubin 0.6 mg/dL; aspartate aminotransferase, 101 IU/L; alanine aminotransferase (ALT), 46 IU/L; alkaline phsophatase, 81 IU/L; GGT, 125 IU/mL; prothrombin time of 12.4 seconds. We decided to start entecavir treatment. Tumor markers showed 19 ng/mL of α-fetoprotein (AFP), 20 mAU/ml of PIVKA-II and 84 U/ml (normal range, 0-37) of CA-19-9.
Computed tomography (CT) showed a 3.8 cm-sized mass located in hepatic segment V with early contrast enhancement and washout with rim enhancement on delayed phase (Fig. 1). Capsular retraction of the hepatic parenchyma overlying the tumor was seen. The lateral edge of the left lateral segment of the liver was blunted and the contour of the liver was mildly lobulated; however, there was no definite evidence of liver cirrhosis such as loss of hepatic volume or hypertrophy of the left liver and caudate lobe. Magnetic resonance imaging (MRI) was performed (Fig. 2). Slight central hyperintensity with hypointense rim and capsular retraction was noted on T1 weighted image. On T2-weighted image, irregular peripheral hyperintensity and central isointensity was shown. Dynamic contrast enhanced MR study using a liver specific contrast agent (Gadoxetate disodium, Primovist, Bayer Healthcare, Germany) was performed. On the arterial phase following contrast injection, the tumor was enhanced intensely and homogeneously as demonstrated on CT, and on the delayed phase image, the tumor was washed out centrally leaving behind a peripherally enhancing rim. On the hepatobiliary phase obtained in 20 minutes after contrast injection, decreased signal intensity on the peripheral fibrous portion was noted, but high signal intensity was also seen in the center of the tumor. Diffusion weighted image (b=800) showed that the periphery of the tumor which was hyperintense on T2 weighted image was bright, but the center of the tumor showed dark signal intensity. On the ultrasonography, the lesion was isoechoic to surrounding parenchyma and did not stand out (Fig. 3).
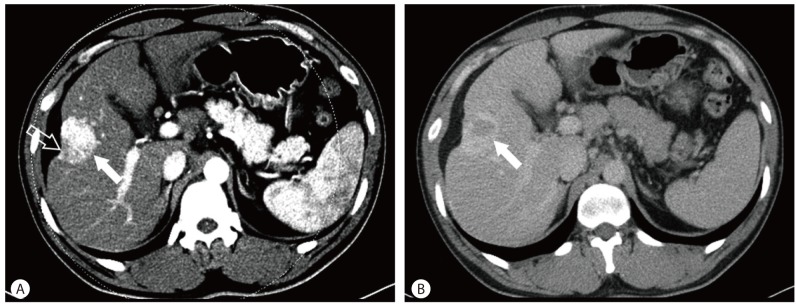
Dynamic abdominal CT findings. On the arterial phase, a well-demarcated, intensely-enhanced mass (solid arrow) is shown in hepatic segment V. Capsular retraction (open arrow) on the mass is also noted (A). On the delayed phase, it is washed out and vague rim enhancement (arrow) around the lesion is seen (B).
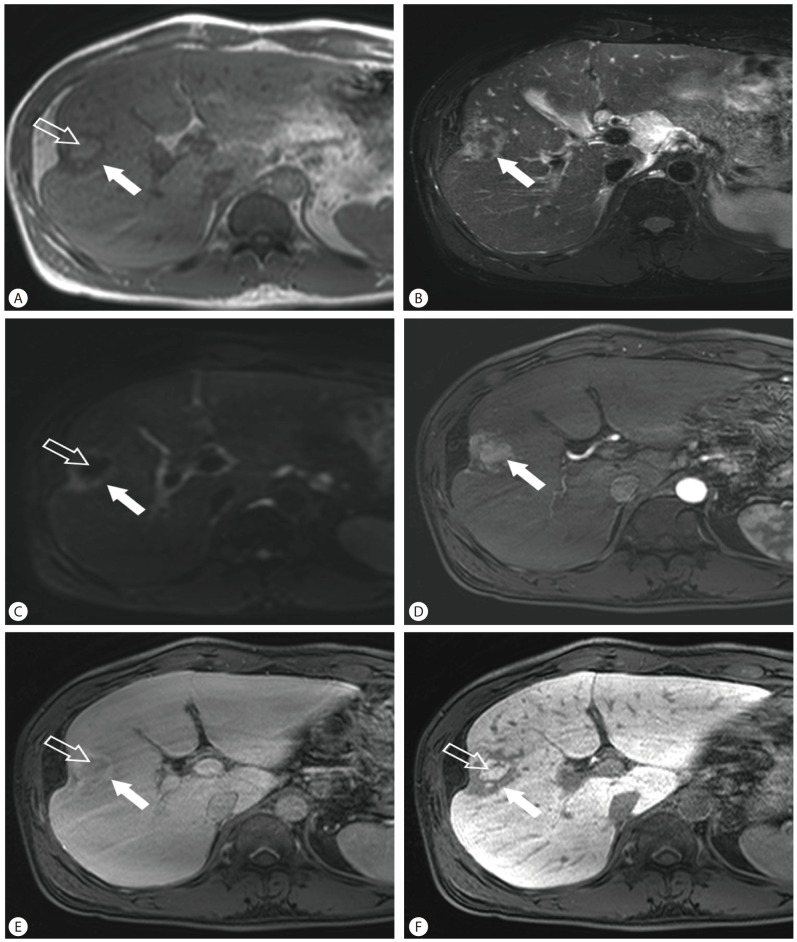
Liver MRI findings. On T1 weighted (A) and T2 weighted MR images (B) show a 3.8 cm-sized, lobulated mass with capsular retraction located in hepatic segment V. The center of the tumor is hyperintense on T1 weighted image (open arrow) and the periphery is hypointense on T1-weighted image and hyperintense on T2-weighted image (solid arrow). Diffusion weighted image (b=800; C) shows that the periphery of the tumor was bright (solid arrow), but the center of the tumor shows dark signal intensity (open arrow). Dynamic contrast enhanced MRI (D-F) using a liver specific contrast agent shows well enhancement of the tumor (arrow) on arterial phase (D), washout (open arrow) and peripheral enhancement (solid arrow) of the tumor on delayed phase (E), and contrast uptake in the center (open arrow) on hepatobiliary phase (F).

Sonographic finding. The lesion (arrow) is isoechoic to surrounding liver parenchyma. Capsular retraction on the tumor is also seen.
The history of active HBV infection and radiologic findings suggested a preoperative diagnosis of mixed HCC with cholangiocarcinoma component. However, no evidence of cirrhosis and nearly normal range of AFP and normal range of PIVKA-II did not favor this diagnosis. Therefore, the decision to perform a needle biopsy before surgical resection was made in order to exclude the diagnosis of benign hepatic lesions such as IPT, in which case spontaneous regression may be expected. Microscopically, the tumor consisted of infiltrated inflammatory cells comprising lymphoplasma cells, neutrophil, and eosinophils in background of stroma composed of interlacing bundles of myofibroblasts, fibroblasts, and collagen bundles (Fig. 4). The surrounding liver parenchyma showed no evidence of cirrhosis. Immunohistochemically, there was positive staining of SMA and CD 34, and negative staining of CD117 and IgG4. The histopathological diagnosis of IPT was provided.

Histologic finding. Infiltrated inflammatory cells comprised of lymphoplasma cells, neutrophils, and eosinophils are seen in the background of stroma composed of interlacing bundles of myofibroblasts, fibroblasts, and collagen bundles (A) H&E, ×400. (B) SMA, ×40.
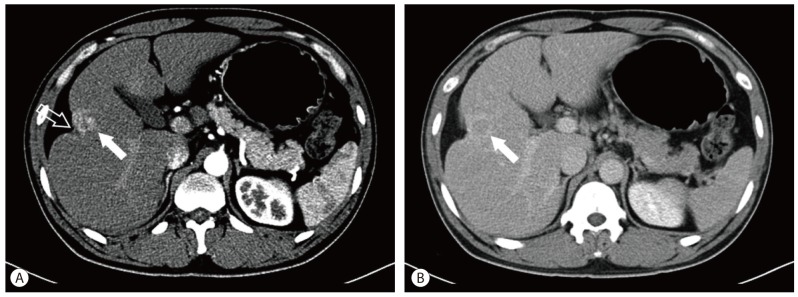
The patient was subsequently discharged after being prescribed with an antiviral agent. Seven months later, follow-up abdominal CT showed that the lesion had shrunken and capsular retraction had become more prominent compared with the previous study (Fig. 5).
DISCUSSION
IPT in the liver was first described in 1953 by Pack and Baker, and described as a rare hepatic lesion.7 However, physicians and radiologists are becoming increasingly aware of hepatic IPT, and presently more than 200 cases can be discovered in PubMed search of English literature, while more than 10 cases have been reported in Korea alone.5,8 In a study of resected focal lesions in 403 patients, the incidence of hepatic IPT was reported to be 0.7%.9 This lesion commonly presents in men in their 30s and 40s, and is frequently associated with symptoms such as fever, abdominal pain, jaundice, and weight loss. In this case, the patient was asymptomatic.5,10
The pathogenesis of IPT is still unknown. However, factors that have been hypothesized in the pathogenesis include infection, vascular disease, and autoimmune diseases, among which infection by micro-organisms that access the portal vein is often associated with hepatic IPT.5,10,11 Also, there were some cases associated with viral infection,12,13 including those associated with HBV or hepatitis C virus infection.5-6,14 Despite these reports, any association between hepatic IPT and infectious organism has not been identified.
The diagnosis of hepatic IPT without biopsy or surgical resection is difficult, even with the use of modern imaging and laboratory techniques.10 It is often seen as a hypoechoic mass on US,5,8 but there is no typical radiologic finding to characterize hepatic IPT. Hepatic IPT demonstrates various enhancement patterns according to the vascularity of the tumor. Although it commonly shows heterogeneous enhancement or peripheral enhancement during the arterial phase, it may at times demonstrate homogeneous enhancement during the arterial phase and washout during the delayed phase.5,10 On MRI, features of hepatic IPT may vary. It commonly shows low signal intensity on T1 weighted image and high signal intensity on T2 weighted image.9,10 If a patient has risk factors for HCC, a tumor measuring more than 2 cm, and typical radiologic findings of HCC as seen in our case, hepatic IPT could be misdiagnosed for HCC. In our case, hepatic IPT was accompanied with capsular retraction which is thought to be caused by tumoral necrosis and desmoplastic reaction. Capsular retraction is a characteristic feature of malignant hepatic tumor such as cholangiocarcinoma and is only rarely associated with benign tumors, such as atypical hemangiomas.15 However, diffusion weighted MRI and ultrasonography did not show any features to suggest malignancy. Furthermore, the clinical findings in this patient did not support the diagnosis of an HCC. Interestingly, high signal intensity in the center of the tumor was seen on the hepatobiliary phase of MRI, suggesting that contrast agent was retained in the tumor. This finding usually appears in benign lesions such as focal nodular hyperplasia and hepatic adenoma.16 The reason for this phenomenon is not clear because no report has previously described retention of gadoxetic disodium within the inflammatory pseudotumor. However, we postulate that during the process of its development, the lesion could destroy communications to the normal bile ducts or block contrast media excretion into the bile canaliculi.
Microscopically, three basic histological patterns have been previously recognized: myxoid, vascular, and inflammatory areas resembling nodular fasciitis; compact spindle cells with intermingled inflammatory cell (lymphocytes, plasma cells, and eosinophils) resembling fibrous histocytoma; and dense plate-like collagen resembling desmoids or scar.10 Malignant progression of hepatic IPT is extremely rare and the prognosis of IPT is good. Therefore, if definitive diagnosis of IPT is made before it is resected, conservative measures such as follow-up imaging or medical management including antibiotics, nonsteroid anti-inflammatory drugs, and steroids may be undertaken.17
In conclusion, hepatic IPT demonstrates various radiologic findings. When differential diagnosis from other malignant tumors is difficult, biopsy should be performed in order to avoid unnecessary resection even in patients with a high risk of HCC.
SUMMARY
Inflammatory pseudotumor (IPT) is a rare benign disease, but may develop in various organs. Usually, hepatic IPT can be mistaken for malignant tumor such as hepatocellular carcinoma and cholangiocarcinoma, or inflammatory lesion such as liver abscess. We report imaging features of hepatic IPT in a patient with chronic hepatitis B diagnosed by percutaneous core biopsy.
Notes
The authors have no conflicts to disclose.
Abbreviations
AFP
α-fetoprotein
CT
computed tomography
HCC
hepatocellular carcinoma
IPT
inflammatory pseudotumor
US
ultrasonography