


Graphical Abstract
INTRODUCTION
Hepatocellular carcinoma (HCC) is the most common primary liver cancer and the fourth leading cause of cancer-related mortality worldwide [1]. Despite active surveillance in high-risk groups, most HCC patients are still diagnosed at an intermediate or advanced stage [2]. Portal vein tumor thrombosis (PVTT) is a defining feature of advanced-stage HCC, and patients with PVTT show a median overall survival (OS) of 2.7 months without treatment [3]. To overcome the poor prognosis of HCC with PVTT, various therapeutic approaches have been investigated [4,5].
Sorafenib, an oral tyrosine kinase inhibitor (TKI), has been accepted as a standard first-line systemic therapy for advanced HCC since 2008, showing longer OS compared to the placebo in a randomized controlled trial (RCT) [6]. Lenvatinib, another TKI, was also introduced in 2018, providing a non-inferior survival outcome relative to sorafenib [7]. However, adverse effects of TKIs such as hand-foot skin reactions and diarrhea are common, and frequently necessitate dose reduction or discontinuation, especially in old age [6,8]. Furthermore, a post hoc analysis of the RCT showed that the effect of sorafenib further decreased when PVTT was present [9]. Hence, there is still an unmet clinical need to improve the outcomes of patients with HCC and PVTT.
Transarterial radioembolization (TARE) is a procedure that delivers Yttrium-90 microspheres directly to viable tumors via the hepatic artery and can be used safely in HCC with PVTT owing to its low risk of liver ischemia [10]. Compared with external radiotherapy, it can provide a more continuous release of radiation while sparing the surrounding non-tumor liver tissues. TARE is equally as effective as conventional transarterial chemoembolization (TACE) with less post-embolization syndrome [11]. Previous studies have also suggested that TARE could be a first-line treatment option for HCC patients with PVTT [12,13].
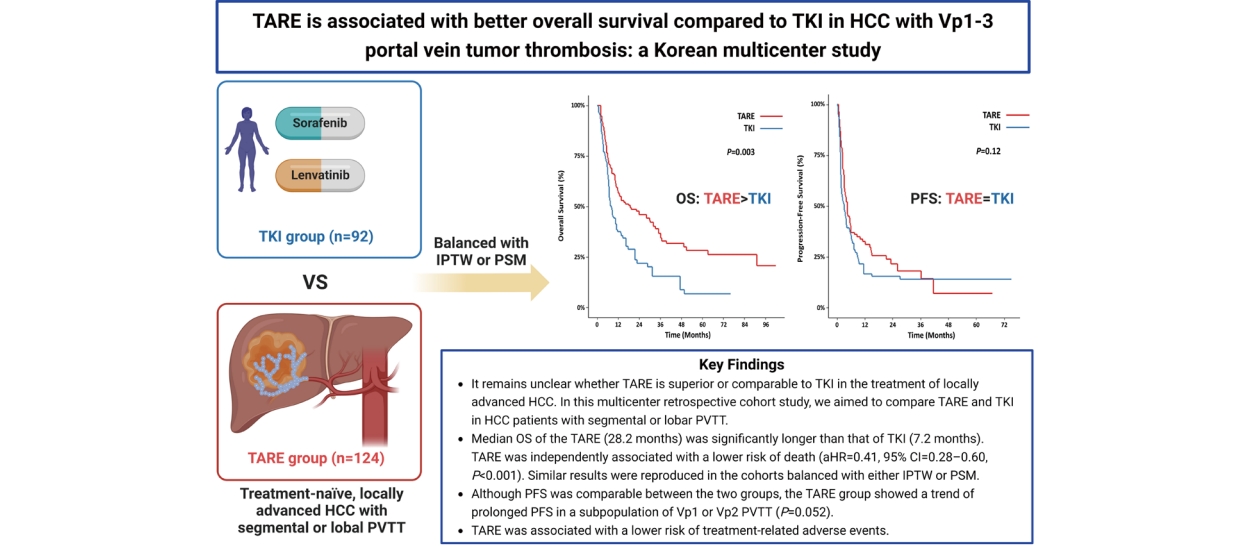
It remains unclear whether TARE is superior or comparable to TKI in the treatment of locally advanced HCC. Several studies have shown that TARE is associated with better outcomes than sorafenib in HCC patients with PVTT [14-19]. In contrast, two randomized trials (SARAH and SIRveNIB) conducted on patients with advanced HCC found no significant differences between the two treatment groups [20,21]. However, these two RCTs included HCC patients with and without PVTT, and a large proportion of HCC patients with main portal vein invasion were enrolled in the TARE group of the SARAH trial [20]. The comparable outcomes of the RCTs may be attributed to the ineffectiveness of TARE in the treatment of HCC with main portal vein involvement, as confirmed in previous studies [10,22]. Therefore, in this multicenter retrospective cohort study, we aimed to compare TARE and TKI in HCC patients with segmental or lobar PVTT.
MATERIALS AND METHODS
Patients
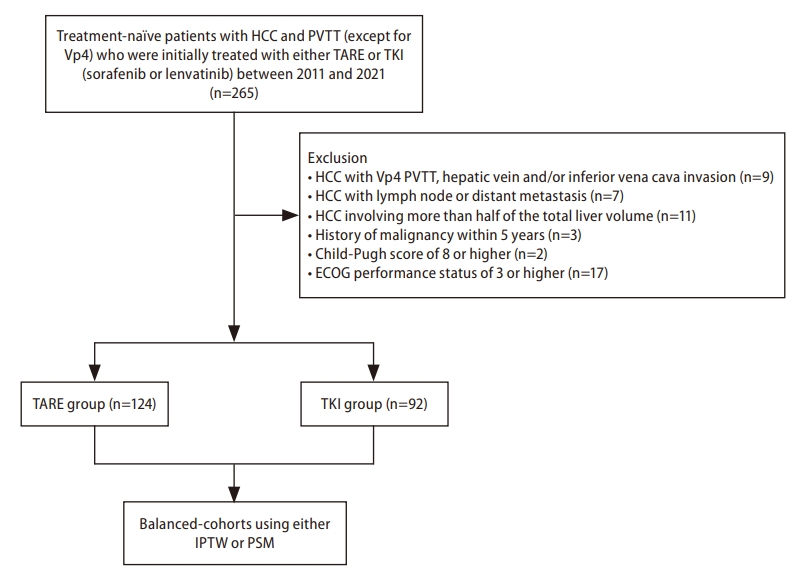
Treatment-na├»ve patients diagnosed with HCC and PVTT not amenable to curative treatment modalities and initially treated with either TARE or TKI (sorafenib or lenvatinib) were consecutively enrolled from five referral centers (Seoul National University Hospital, Severance Hospital, National Cancer Center, Samsung Medical Center, and Korea University Anam Hospital) in South Korea between 2011 and 2021. Patients with unresectable HCC who had preserved liver function (i.e., ChildŌĆōPugh class A) and fair performance status (PS) were eligible for TKI therapy, and sorafenib was prescribed to those with a ChildŌĆōPugh score of 7 beginning in 2020. TKI was contraindicated if patients had a recent history of variceal bleeding or cardiovascular events. Patients with advanced HCC, preserved hepatic function, and adequate PS in the absence of distant metastases were considered candidates for TARE. TARE was performed when there were no technical contraindications, and the lung dose was below the acceptable range. Given the high cost of TARE, the final choice of first-line treatment was based on informed consent following discussions between the primary care physician and the patient, or interdisciplinary team consultations.
HCC was confirmed radiologically or histologically, according to international guidelines [23-25]. PVTT was classified as suggested by the Liver Cancer Study Group of Japan as follows: Vp1, tumor thrombus in the segmental portal vein (PV); Vp2, in the second-order branches of the PV; Vp3, in the first-order branches of the PV; and Vp4, in the main trunk of the PV and/or branches of the PV contralateral to the primarily involved lobe [26].
For each patient, data were collected from electronic medical records; these included age, sex, body weight, height, etiology of underlying liver disease, Eastern Cooperative Oncology Group (ECOG) PS, coexisting medical conditions, and blood test results. The exclusion criteria were as follows: (i) HCC with Vp4 PVTT, hepatic vein and/or inferior vena cava invasion, lymph node metastasis, or distant metastasis; (ii) HCC involving more than half of the total liver volume; (iii) HCC combined with intrahepatic cholangiocarcinoma; (iv) history of malignancy within five years; (v) ChildŌĆōPugh score of 8 or higher; and (vi) ECOG PS of 3 or higher. This study was approved by the institutional review board of each hospital.
Treatments
At each hospital, TARE was performed by interventional radiologists with more than 10 years of experience. Microspheres (Therasphere┬« or SIR-Spheres┬«) labeled with Yttrium-90 were delivered to the target lesions through the hepatic artery. The type of microspheres was determined according to the interventional radiologistsŌĆÖ preference. For Therasphere ┬«, TARE was performed unless the lung dose estimated by the Medical Internal Radiation Dose measurement exceeded 30 Gy. In the case of SIR-Spheres┬«, TARE was conducted if the lung dose estimated using a partition model was less than 25 Gy. Patients in the TKI group received 400 mg sorafenib twice daily or 12 or 8 mg lenvatinib once daily based on their body weight. Dose reduction or discontinuation was determined according to HCC progression or adverse effects assessed by the physicians.
Outcomes
The primary outcome was the OS rate, which was measured from the initial date of treatment until the date of death from any cause, or date of the last follow-up. Survival data were retrieved from the medical records of each hospital or the national database provided by the Ministry of the Interior and Safety of Korea using resident registration numbers. The secondary outcomes were progression-free survival (PFS), hepatic PFS (HPFS), best treatment response, PVTT response, and safety. HPFS was calculated as the duration between treatment initiation and first documented progression in the liver. Overall PFS was defined as the progression of HCC at any site in the body, not limited to the liver (e.g., bone, brain, and lung). Best treatment response was assessed using the modified Response Evaluation Criteria in Solid Tumors (mRECIST) criteria [27]. The PVTT response was evaluated by radiologists as follows: complete response, disappearance of PVTT with revascularization; partial response, apparent decrease in size and extent of PVTT; stable disease, no significant change; progressive disease, obvious increase in size or extent of PVTT, or newly appearing PVTT. Treatment-related adverse events including ascites and radiation pneumonitis were evaluated in each group.
Statistical analysis
Chi-squared and independent t-tests were used to compare categorical and continuous variables, respectively. Both propensity score matching (PSM) and inverse probability of treatment weighting (IPTW) were used to balance the TARE and TKI groups. OS, PFS, and HPFS were calculated using the KaplanŌĆōMeier method and compared using the log-rank test. The Cox proportional hazard model was used to evaluate the independent risk factors of progression or survival, and hazard ratio (HR) and 95% confidence interval (CI) were derived. Logistic regression was applied, and the odds ratio (OR) was calculated to identify factors associated with a higher objective response rate (ORR). All statistical analyses were performed using R (version 4.0.4; R Foundation for Statistical Computing, Vienna, Austria). Statistical significance was set at P<0.05.
RESULTS
Baseline characteristics
This study involved 216 patients, with 124 and 92 patients in the TARE and TKI groups, respectively (Fig. 1). In the TKI group, 71 patients (77.2%) received sorafenib, whereas the remainder were treated with lenvatinib (22.8%). Table 1 summarizes the baseline characteristics of the study participants. In the unmatched cohort, patients in the TKI group showed higher levels of serum bilirubin and prothrombin time and a lower level of serum albumin than those in the TARE group (all P<0.05). There were no significant differences between the two groups in terms of tumor type (nodular vs. infiltrative), tumor size, PVTT level, and tumor markers. However, the TKI group showed a greater number of tumors and more frequent bilobar involvement than the TARE group (both P<0.001). After applying IPTW and PSM, the balance between the two treatment groups improved, except for the bilirubin levels and prothrombin time.
Supplementary Table 1 shows a summary of the TARE treatment. The mean absorbed dose was 208.0 Gy and the median delivered radiation activity was 3.6 GBq (interquartile range [IQR]=2.8ŌĆō5.1). We confirmed a median lung shunt fraction (LSF) of 5.4% (IQR=3.6ŌĆō7.9) and a median lung dose of 11.9 Gy (IQR=6.4ŌĆō19.1). The median tumor volume in the TARE group was 350.0 mL (IQR=131.0ŌĆō610.0).
Primary outcome: OS
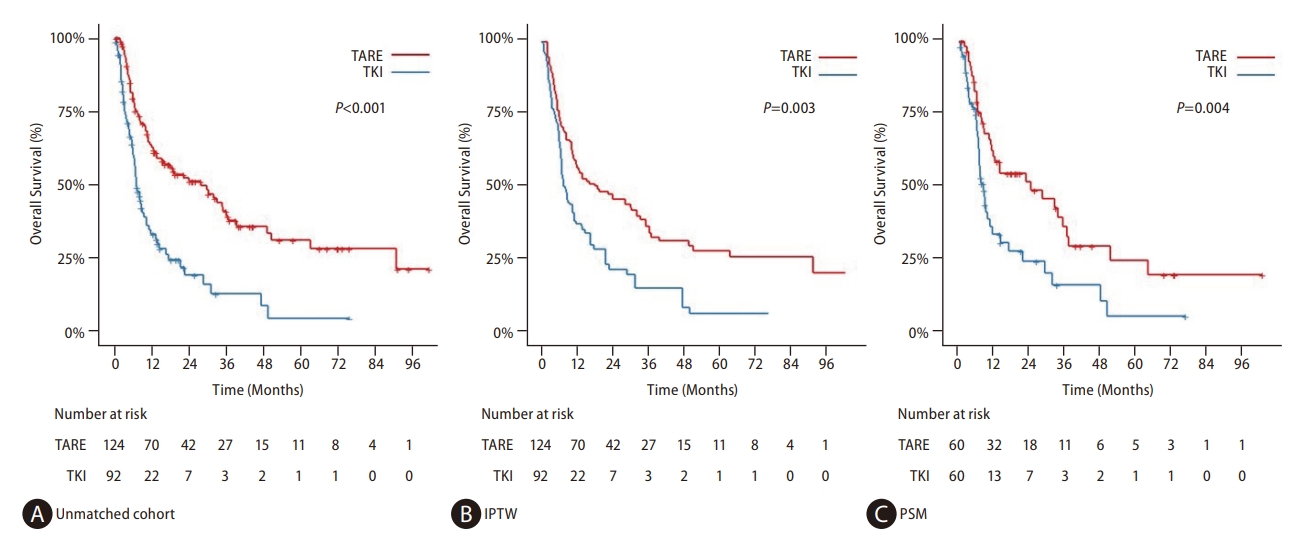
In the unmatched cohort, patients in the TARE group showed a median OS of 28.2 months (IQR=7.6ŌĆō91.1), while the median OS of the TKI group was 7.2 months (IQR=3.5ŌĆō17.8; Table 2). Figure 2 depicts the KaplanŌĆōMeier curves comparing the OS of the two treatment groups. The TARE group demonstrated significantly longer OS than the TKI group (log-rank P<0.001; Fig. 2A). The same results were reproduced in the study cohorts balanced with either IPTW (log-rank P=0.003; Fig. 2B) or PSM (log-rank P=0.004; Fig. 2C).
In multivariable Cox analysis of the unmatched cohort, TARE was independently associated with a lower risk of death compared to TKI (TARE vs. TKI: adjusted HR=0.41, 95% CI=0.28ŌĆō0.60, P<0.001; Table 3). Similar results were reproduced in the cohorts balanced with either IPTW (HR=0.55, 95% CI=0.36ŌĆō0.84, P=0.006; Table 4) or PSM (HR=0.51, 95% CI=0.32ŌĆō0.81, P=0.004). Poor ECOG PS, ChildŌĆōPugh score of 7, higher bilirubin levels or prothrombin time, and lower albumin levels were associated with a higher risk of death. Subgroup analysis according to PVTT level is presented in Supplementary Figure 1. Among patients with Vp1 or Vp2 PVTT, OS of the TARE group was significantly longer (P=0.002), whereas no difference was found in patients with Vp3 PVTT after IPTW (P=0.19). When patients in the TKI group were divided according to the type of drug prescribed, the TARE group showed longer OS than both sorafenib and lenvatinib groups, while OS was comparable between the two drugs (Supplementary Fig. 2).
Among the overall population, 87 patients in the TARE group (70.2%) and 24 in the TKI group (26.1%) received rescue treatment after disease progression (Supplementary Table 2). In the TARE group, 38 (43.7%), 23 (26.4%), and 8 (9.2%) patients underwent TACE, systemic therapy, and resection, respectively. In the TKI group, 9 (37.5%) and 6 (25.0%) patients received subsequent systemic treatment and TACE, respectively, after HCC progression. The superiority of TARE over TKI in terms of OS was maintained even after excluding 10 patients from the TARE group who underwent subsequent resection or radiofrequency ablation (Supplementary Fig. 3).
Secondary outcomes: PFS, HPFS, best treatment response, and PVTT response
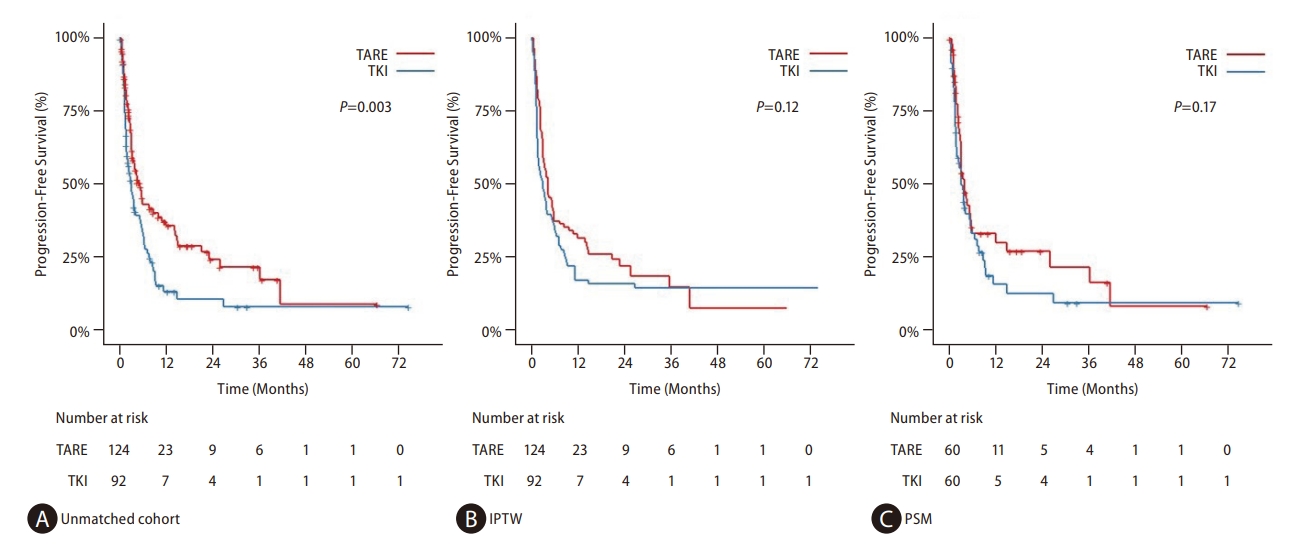
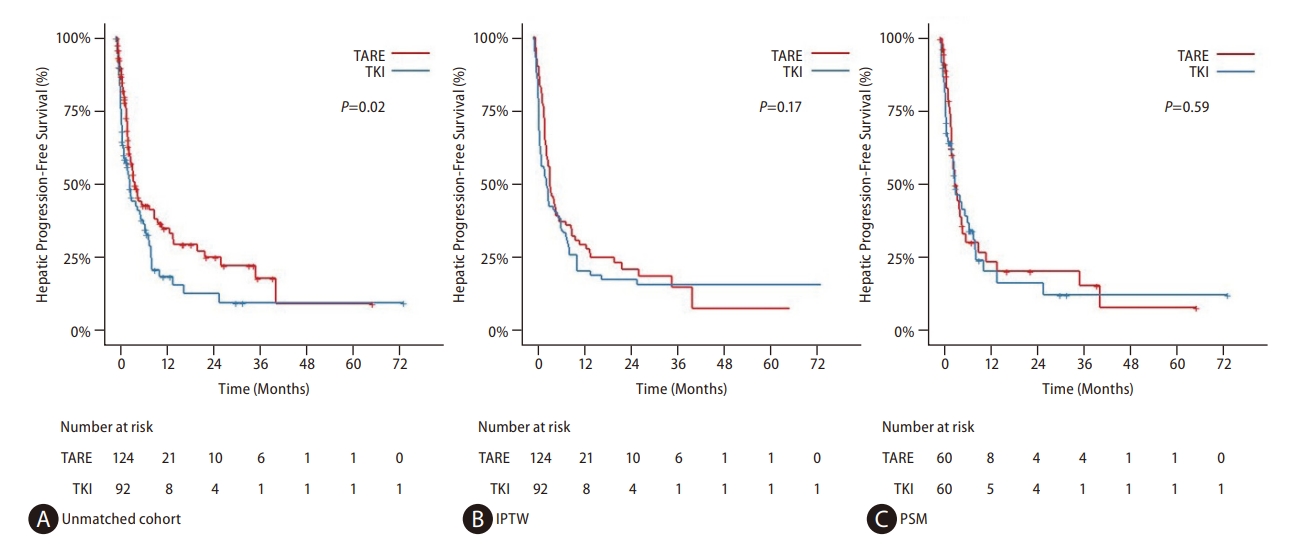
After applying IPTW, there was no significant difference in PFS between the TARE (median 4.5 months, IQR=2.5ŌĆō21.3) and TKI (median 3.1 months, IQR=1.6ŌĆō8.8) groups (log-rank P=0.12; Fig. 3B). The HPFS of the TARE group (median 4.6 months, IQR=2.9ŌĆō15.2) was also comparable to that of the TKI group (median 3.7 months, IQR=1.7ŌĆō11.6) in the matched cohort using IPTW (log-rank P=0.17; Fig. 4B). The same results were confirmed after applying PSM (Figs. 3C and 4C). Subgroup analyses according to the level of PVTT after IPTW revealed no significant difference between the two groups in terms of PFS and HPFS, although the TARE group showed a trend of prolonged PFS in patients with Vp1 or Vp2 PVTT (P=0.052; Supplementary Figs. 4 and 5). When patients in the TKI arm were stratified by drug type, PFS was comparable for TARE, sorafenib, and lenvatinib (Supplementary Fig. 6).
Regarding the best treatment and PVTT responses, the TARE group was significantly superior to the TKI group (Table 2). The ORR of the TARE group was 53.0% and 56.7% in the matched cohorts using IPTW and PSM, respectively, whereas that of the TKI group was 12.3ŌĆō15.0%; more than half of the patients had progressive disease after TKI treatment. The results of the logistic regression analyses of the best treatment response are presented in Supplementary Table 3. The TARE group was associated with a significantly higher likelihood of ORR than the TKI group after balancing with IPTW (OR=8.05, 95% CI=3.35ŌĆō19.3, P<0.001) or PSM (OR=7.41, 95% CI=3.09ŌĆō17.8, P<0.001). The TARE group was also more beneficial for controlling PVTT. The ORR of PVTT was 39.4ŌĆō46.7% in the TARE group and 10.0ŌĆō10.5% in the TKI group after balancing with IPTW or PSM.
Safety assessment
The TARE group showed a significantly lower incidence of treatment-related adverse events than the TKI group (Supplementary Table 4). Ascites of grade 2 or higher and hepatic encephalopathy occurred more frequently in the TKI group than in the TARE group (both P<0.001). Although statistically insignificant, four patients in the TKI group experienced variceal bleeding after treatment initiation, whereas only one bleeding event was confirmed in the TARE group (P=0.09). Due to ascites development and decline in liver function, 33 (35.9%) patients in the TKI group showed a ChildŌĆōPugh score aggravation of 2 or greater. Radiation pneumonitis and radioembolization-induced liver disease were confirmed in two (1.6%) and six (4.8%) TARE-treated patients, respectively.
DISCUSSION
In this multicenter cohort study, the TARE group showed significantly longer OS, higher ORR, and fewer adverse events than the TKI group among HCC patients with Vp1ŌĆō3 PVTT. Although there were no significant differences in PFS and HPFS, the TARE group showed a trend of prolonged PFS in a subpopulation of patients with Vp1ŌĆō2 PVTT. For patients with HCC and PVTT, curative therapies, such as surgical resection, liver transplantation, or radiofrequency ablation, are limited due to the high risk of early intrahepatic recurrence and distant metastasis. This study showed that TARE can be a safer and more effective treatment option for patients with HCC and PVTT than TKI.
Several factors may have contributed to the superior outcomes of TARE compared to those of TKI. First, appropriate patient selection may have resulted in differences between the current study and previous RCTs. Although two earlier RCTs did not demonstrate an improvement in survival with TARE compared with sorafenib, this might be attributable to the high proportion of patients with Vp4 PVTT in the TARE group. In the SARAH trial, 34% (49/143) of patients with PVTT were confirmed to have HCC involvement in the main portal vein [20]. Since it has been shown that TARE is not effective in HCC with main portal vein invasion [10,22], we excluded HCCs with Vp4 PVTT and demonstrated the superiority of TARE over TKI in terms of OS and ORR. The findings of our study are consistent with those of previous retrospective studies comparing TARE and TKI in patients with HCC and PVTT [15,18]. Second, the median delivered radiation activity was significantly higher in the current study (3.6 GBq) than in the SARAH (1.4 GBq) and SIRveNIB (1.6 GBq) trials [20,21]. The median lung dose in the present study (11.9 Gy) was significantly higher than that measured in the SARAH trial (2.6 Gy) [20]. However, while two patients (1.6%) were diagnosed with non-serious radiation pneumonitis in the current study, there was one case (0.4%) of grade 5 radiation pneumonitis in the SARAH study [20]. Therefore, delivering high-dose radiation without increasing the rate of fatal complications may lead to favorable outcomes. Third, pre-treatment simulation tests before TARE to measure the LSF can assist in the selection of appropriate patients who could benefit from TARE. Patients with high LSF are ineligible for TARE because of the risk of fatal lung injury, and high LSF itself indicates poor outcomes [28]. Thus, excluding those with a high LSF could result in the superior outcomes of TARE.
Effective control of PVTT might also have contributed to the prolonged OS in the TARE group. PVTT is one of the most important risk factors for patients with HCC [4]. In this study, the TARE group showed a significantly higher ORR for PVTT than the TKI group. TACE is also used in some countries for patients with HCC and PVTT, but it has a risk of hepatic decompensation due to dual (arterial and portal) blood flow impairment [29]. Previous studies demonstrated the superiority of TACE combined with external radiotherapy over sorafenib for PVTT [30,31]. Collectively, these results suggest that local control of PVTT may have a critical impact on the prognosis of HCC patients with portal vein invasion and that this can be achieved more effectively with radiation focused at PVTT rather than with TKI.
Although there were no significant differences in PFS and HPFS between the two groups, it is possible that patients in the TARE group benefited more from subsequent rescue treatments than those in the TKI group, resulting in longer OS. In this study, more than half of the patients in the TARE group received rescue treatment such as surgical resection, TACE, or systemic therapy. On the other hand, less than half of the patients in the TKI group underwent further treatment for disease progression. TARE seems to be more effective in downstaging advanced HCC than TKI, which may lead to subsequent curative treatments with preserved liver function. In contrast, low availability of rescue therapies in the TKI group might be attributable to a decline in liver function at the time of HCC aggravation. The fact that approximately one-third of patients in the TKI group experienced an increase in ChildŌĆōPugh score of 2 or more supports this explanation. Moreover, patients with PVTT have a high risk of distant metastasis, especially in the lungs. Therefore, early progression with distant metastasis might lead to no significant difference in PFS between TARE and TKI.
TARE seems to be superior, or at least comparable, to TKI in the treatment of advanced-stage HCC with fewer adverse events. In addition, TARE treatment has evolved consistently since its introduction [32]. A recent DOSISPHERE-01 study demonstrated that personalized dosimetry, instead of standard dosimetry, can improve ORR by up to 71% in locally advanced HCC [33]. In another study, a prognostic score to predict response after TARE was developed and validated, and PVTT was confirmed to be a critical risk factor [34]. This scoring system underlines an individualized approach for selecting appropriate TARE candidates. It is anticipated that the efficacy of TARE will continue to improve, owing to technological developments and the accumulated skills of interventional radiologists. Therefore, TARE may have the potential to outperform TKI, and further research is warranted to identify a proper subset of patients with advanced HCC that will benefit more from TARE than from TKI.
This study has several limitations. First, it was prone to selection bias due to its retrospective nature, and the small sample size from each institute with different management strategies may have influenced the outcomes. To overcome this problem, we applied strict inclusion and exclusion criteria, and patients were consecutively enrolled from five referral centers. In addition, IPTW and PSM were performed to balance the two treatment groups. The matched cohorts showed comparable baseline characteristics and reproduced the main results. Second, despite the study period of more than 10 years, the number of patients in the TKI group was relatively small. This may be attributed to the use of other treatment modalities, especially TACE. Patients with unresectable HCC and Vp1ŌĆō2 PVTT were more likely to receive conventional TACE as an initial treatment, instead of TKIs, as TACE is recommended as the optimal treatment option for these patients according to practice guidelines [25]. Third, most HCCs in this study were hepatitis B virus-related. Although the effects of sorafenib and lenvatinib did not differ according to the etiology of HCC [7,8], future studies with diverse ethnicities and etiologies are warranted to confirm the validity of our findings. Fourth, atezolizumab plus bevacizumab, which showed significantly longer OS and PFS than sorafenib in unresectable HCC [35], was not included in this study. However, given the short history of immune checkpoint inhibitors, further studies are required, including a comparison or combination of TARE with atezolizumab and bevacizumab.
In conclusion, TARE was significantly associated with longer OS and higher ORR than TKI in patients with HCC and PVTT. There were no significant differences in the PFS or HPFS, and patients in the TARE group experienced fewer adverse events than those in the TKI group. With meticulous patient selection, TARE may become an effective and safe treatment strategy for advanced HCC with segmental or lobar PVTT.
 PDF Links
 PubReader
 ePub Link
 Full text via DOI
 Download Citation
 Supplement1
 Print
Print