Association of serum alanine aminotransferase and γ-glutamyltransferase levels within the reference range with metabolic syndrome and nonalcoholic fatty liver disease
Article information
Abstract
Background/Aims
Nonalcoholic fatty liver disease (NAFLD) has recently been found to be a novel component of metabolic syndrome (MS), which is one of the leading causes of chronic liver disease. The serum alanine aminotransferase (ALT) and γ-glutamyltransferase (GGT) levels are suggested to affect liver fat accumulation and insulin resistance. We assessed the associations of serum ALT and GGT concentrations within the reference ranges with MS and NAFLD.
Methods
In total, 1,069 subjects enrolled at the health promotion center of Wonkwang University Hospital were divided into 4 groups according to serum ALT and GGT concentrations levels within the reference ranges. We performed biochemical tests, including liver function tests and lipid profiles, and diagnosed fatty liver by ultrasonography. Associations of ALT and GGT concentrationgrading within the reference range with fatty liver and/or MS were investigated.
Results
The presence of MS, its components, and the number of metabolic abnormalities [except for high-density lipoprotein-cholesterol (HDL-C) and fasting blood glucose] increased with the ALT level, while the presence of MS, its components, and the number of metabolic abnormalities (except for HDL-C) increased with the GGT level. The odds ratios for fatty liver and MS increased with the ALT level (P<0.001 and P=0.049, respectively) and the GGT level (P=0.044 and P=0.039, respectively).
Conclusions
Serum ALT and GGT concentrations within the reference ranges correlated with the incidence of NAFLD and MS in a dose-dependent manner. There associations need to be confirmed in large, prospective studies.
INTRODUCTION
Nonalcoholic fatty liver disease (NAFLD) is the most common liver disorder in Western countries, affecting 20-30% of the general population.1,2 The prevalence of NAFLD has increased substantially during the last 15 years in parallel with regional trends in over-nutrition central and overall obesity, type 2 diabetes mellitus (DM), and the metabolic syndrome (MS).3-5
NAFLD, characterized by elevated alanine aminotransferase (ALT) and γ-glutamyltransferase (GGT), is now considered as the hepatic expression of insulin resistance (IR),6 accounting for the risk of advanced liver disease observed in these patients, in addition to the well-established risk of cardiovascular disease.
Serum ALT is associated with liver fat accumulation as a marker of hepatic steatosis or hepatic dysfunction. Also, as a gluconeogenic enzyme, the ALT is associated with hepatic IR.7 A number of MS components, obesity, IR, and high sensitivity-C-reactive protein (hs-CRP), are strong predictors of increased ALT activity in NAFLD.8 Elevated serum ALT levels have a positive association with MS-related diseases, such as type 2 DM and cardiovascular disease.9,10
In recent data, both normal and increased levels of ALT are associated with long-term development of multiple metabolic disorders. These results indicate the potential for ALT values within the reference interval as biomarkers for the risk of MS.11 Several prospective epidemiologic studies have demonstrated that increased concentrations of hepatic enzyme in serum, even within the reference interval, may be related to an increased risk of type 2 DM and the MS, as well as death.12 In addition, ALT is a predictor of mortality due to unrecognized liver diseases, but also due to other causes of ALT elevation, linked to non-liver health risks, such as atherosclerosis, hypertension (HTN), and type 2 DM.7 Even within the normal range, there is a positive association between the aminotransferase concentration and mortality from liver disease.13
As GGT is a sensitive indicator of liver damage,14 excess deposition of fat in the liver is associated with an elevated serum GGT and IR.15,16 GGT is located on the external surface of most cells and mediates the uptake of glutathione,17 an important component of intracellular oxidative defenses.18 GGT is also considered a marker of oxidative stress and it may be directly involved in the generation of reactive oxygen species. The serum GGT level has been associated with many cardiovascular disease risk factors, DM, MS, and IR.18,19 In Korean adults, serum GGT is closely correlated with IR and the increased number of components of MS,20 as a surrogate marker of IR, inflammation, and MS.21 Some studies suggest that within its reference interval, the serum GGT concentration has been closely related to the presence of components of the MS.7 Recent reports suggest that an increased GGT level is a risk factor for advanced fibrosis in NAFLD21 and, with weight loss, a decrease in GGT activity is predictive of improved lobular inflammation and fibrosis of liver.20
Thus, measurement of ALT and GGT may identify subjects in the general population with a risk of NAFLD and MS.7 However, limited data exist on the significance of GGT or ALT activities within reference interval in subjects with NAFLD and MS. Therefore, we assessed the association of serum ALT and GGT activities within reference range with MS and NAFLD.
MATERIALS AND METHODS
Subjects
The medical records of 2,024 subjects who attended our Center for Health Promotion for a medical check-up between 2006 and 2008 were investigated. Subjects meeting any of the following criteria were excluded: hepatic enzyme/GGT concentrations higher than the upper limit of the reference range, a positive test for hepatitis C virus antibody, a positive test for hepatitis B virus surface antigen, a daily alcohol intake of 20 g or more, liver cirrhosis, or incomplete data for determination of the MS (Fig. 1).
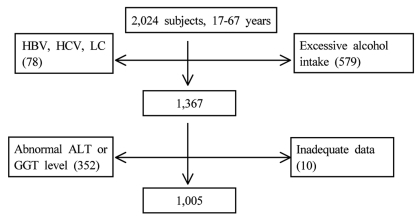
Study profile.
HBV, hepatitis B virus; HCV, hepatitis C virus; LC, liver cirrhosis; Abnormal ALT, abnormal alanine aminotransferase; GGT level, gamma glutamyltransferase level.
The subjects were classified separately into four groups according to the serum ALT and GGT activities within reference range, as in previous report.18 According to ALT and GGT activities, subjects were divided into four group respectively as below; ALT grading (first 1-14 IU/L, second 15-19 IU/L, third 20-25 IU/L, and fourth 26-40 IU/L); GGT grading (first 1-10 IU/L, second 11-15 IU/L, third 16-24 IU/L, and fourth 25-50 IU/L). Considering sexual difference, group of ALT activity was divided into male and female groups.
Assessment of hepatic steatosis
We used ultrasonography as a non-invasive method to diagnose fatty liver disease. All ultrasound scans were performed by two skilled operators using a high resolution B-mode scanner (SSD-5500; Aloka, Tokyo, Japan). Liver steatosis was assessed on the basis of abnormally intense, high-level echoes arising from the hepatic parenchyma, the liver-kidney difference in echo amplitude, the echo penetration into the deep portion of the liver, and the clarity of the blood vessel structure in the liver.22
Definition of MS
According to the International Diabetes Federation (IDF) consensus statement, MS was defined as the presence of 3 or more of the followings: i) waist circumference (WC) ≥90 cm in men and ≥80 cm in women; ii) serum triglyceride (TG) ≥150 mg/dL; iii) high-density lipoprotein cholesterol (HDL-C) <50 mg/dL in females and <40 mg/dL in men; iv) systolic blood pressure (BP) ≥ 130 or diastolic BP ≥85 mmHg or treatment of previously diagnosed HTN; v) fasting blood glucose ≥100 mg/dL or treated type 2 DM.23
Subject assessment and anthropometric measurements
A self-administered questionnaire also served to measure medical history of the examinee and family, medication history, and lifestyle (cigarette smoking, drinking alcohol, and exercise). Anthropometric measurements of height, body weight, and WC were made on the same day. The height was measured to the nearest 0.5 cm. The body weight was measured in light clothing and without shoes to the nearest 0.1 kg. The WC was measured to the nearest 0.1 cm with flexible tape at the midpoint between the lower rib margin and the iliac crest in the horizontal position.
Biochemical and metabolic measurements
After an overnight fast, subjects underwent liver function tests [aspartate aminotransferase (AST), ALT, GGT, alkaline phsophatase, albumin, and total bilirubin], lipid profiles [total cholesterol (TC), TG, HDL-C, and low-density lipoprotein cholesterol (LDL-C)], glucose, creatinine, and hemoglobin (Hb).
Statistical analysis
Statistical analysis was performed by the Statistical Package for Social Science (SPSS), version 17.0 (SPSS, Inc., Chicago, IL, USA). Results are expressed as the means±standard deviations or median (interquartile range) for continuous variables and as frequencies (proportions) for categorical variables. The trends for each variables with increasing ALT/GGT gradings were evaluated by the Spearman's rank correlation analysis. Continuous variables were compared using the Kruskal-Wallis H test. Categorical parameters among groups were compared using the chi-square test. The factors (ALT grading and GGT grading) correlated with fatty liver or metabolic syndrome were evaluated using multiple logistic regression analysis after adjustment for clinical and biochemical parameters. Using ROC, levels of ALT and GGT activities within reference range to predict NAFLD and MS were evaluated. Statistical significance was considered to be a P<0.05.
RESULTS
Prevalence of fatty liver by ultrasonography and MS
The 1,005 subjects [mean age, 45.08±10.26 years; 45.62±9.49 (men); 44.59±10.90 (women)] of total 2,024 subjects were enrolled in this study. Among the men and women examined, ultrasonographic scans revealed fatty liver in 25.3% (254/1005); 150/480 (men), 104/525 (women). Among the subjects examined, the prevalence of MS was 10.8% (109/1005); 53/480 (men), 56/525 (women). Among 254 subjects with fatty liver by ultrasonography, 67 subjects (26.4%) had MS and, among 109 subjects with MS, 67 subjects (61.5%) revealed fatty liver by ultrasonography.
Clinical and metabolic characteristics according to ALT and GGT activities
Clinical characteristics of the study subjects according to serum GGT and ALT were presented in Tables 1, 2 and 3. As the ALT levels increased in male subjects, age, body weight (BW), BMI (body mass index), obesity (BMI>25), WC, systolic BP, diastolic BP, Hb, uric acid, AST, ALT, TG, and TC increased and HDL-C decreased (Table 1). As the ALT levels increased in female subjects, age, BW, BMI, obesity (BMI>25), WC, systolic BP, diastolic BP, Hb, fasting plasma glucose, uric acid, AST, ALT, TG, TC, TC (>200 mg/dL), and LDL-C (>130 mg/dL) increased and HDL-C decreased (Table 2). As the GGT levels increased in total subjects, age, BW, BMI, obesity (BMI>25), WC, systolic BP, diastolic BP, Hb, fasting plasma glucose, uric acid, AST, ALT, TG, TC, TC (>200 mg/dL), and LDL-C (>130 mg/dL) increased and HDL-C decreased (Table 3).
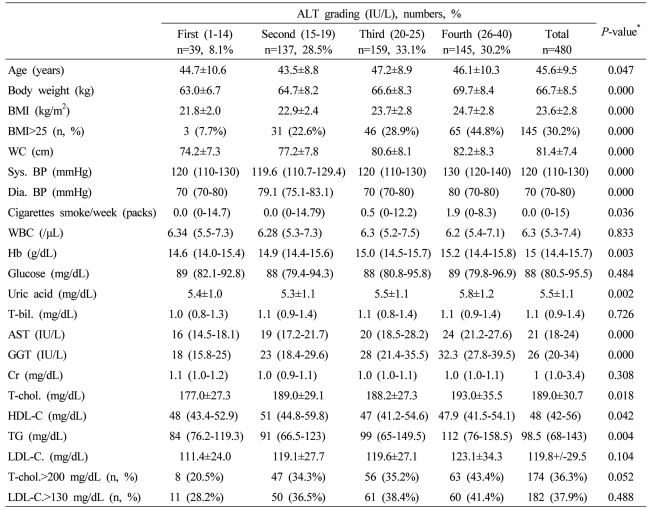
Baseline characteristics of the male subjects according to serum alanine aminotransferase (ALT) grading

Baseline characteristics of the female subjects according to serum ALT grading
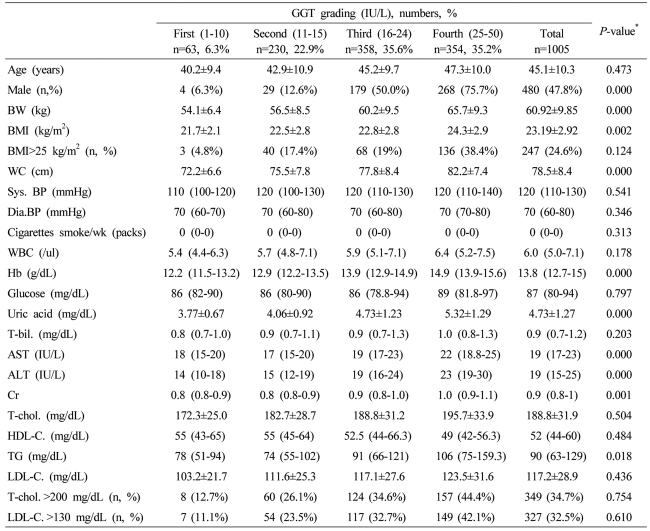
Baseline characteristics of all of the study subjects according to serum γ-glutamyltransferase (GGT) grading
Association of MS and fatty liver with ALT and GGT activities
In male subjects, the presence of MS, its components, and the number of metabolic abnormalities increased with increased ALT grading, except the low HDL-C and fasting plasma glucose>100 mg/dL (Table 4). With increased ALT grading in female subjects, the presence of MS, its components, and the number of metabolic abnormalities increased, except the low HDL-C (Table 5). With increased GGT grading in total subjects, the presence of MS, its components, and the number of metabolic abnormalities increased, except the low HDL-C (Table 6).
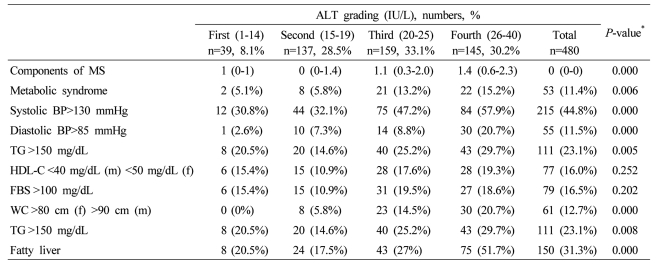
Components of metabolic syndrome (MS), fatty liver, and severity of fatty liver according to serum ALT grading in male subjects
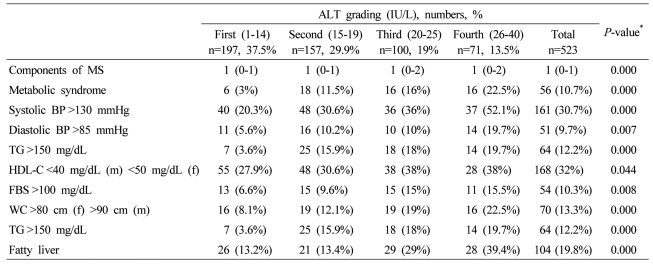
Components of MS, fatty liver, and severity of fatty liver according to serum ALT grading in female subjects
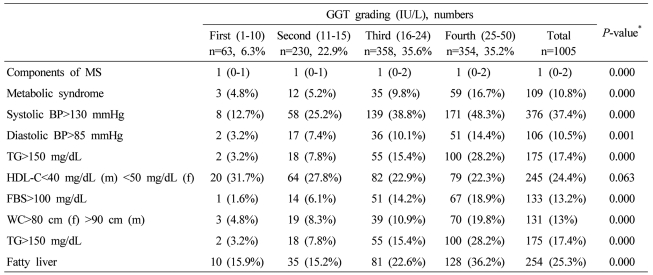
Components of MS, fatty liver, and severity of fatty liver according to serum GGT grading in all of the subjects
With increasing ALT grading, odds ratios for fatty liver elevated in third and fourth quartile in a dose dependent manner, after adjustment for obesity, systolic BP>130 mmHg, diastolic BP >85 mmHg, MS, fasting blood glucose, GGT, although odds ratio in second quartile (0.81, 95% CI 0.47-1.39) has weaker risk than in first quartile. With increasing GGT grading, odds ratio for fatty liver elevated in third (1.04, 95% CI 0.48-2.23) and fourth quartile (1.29, 95% CI 0.60-2.79) in a dose dependent manner, adjusted for obesity, systolic BP>130 mmHg, diastolic BP>85 mmHg, MS, fasting plasma glucose.
With increasing ALT grading, odds ratios for MS increased in a dose dependent manner from second quartile to fourth quartile. With increasing GGT grading, odds ratios for MS increased in third and fourth quartiles, although the risk for MS was weaker in second quartile than in first quartile (Table 7).
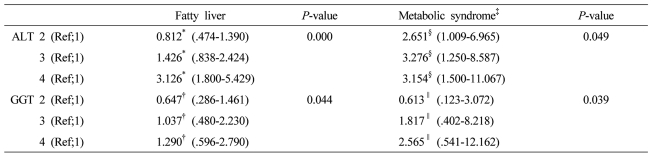
Odds ratio and 95% confidence interval (CI) values for fatty liver and MS according to the baseline serum GGT and ALT gradings
Levels of ALT and GGT activities within reference range to predict NAFLD and MS
In male subjects, when 21.5 IU/L of ALT activity was considered as cut-off level to predict NAFLD, sensitivity and specificity were 70.7% and 55.2%, respectively (area under curve 0.677, 95% CI 0.625-0.729, P<0.001). In female subjects, cut-off level of 16.95 IU/L in ALT activity had sensitivity of 69.2% and specificity of 56.5% to predict NAFLD (area under curve 0.662, 95% CI 0.602-0.723, P<0.001). In total subjects, when 19.5 IU/L in GGT activity was considered as cut-off level to predict NAFLD, sensitivity and specificity were 68.1% and 52.1%, respectively (area under curve 0.634, 95% CI 0.594-0.673, P<0.001).
To predict MS, in male subjects, 21.9 IU/L of ALT cut-off level had sensitivity of 66% and specificity of 48.9% (area under curve 0.629, 95% CI 0.553-0.705, P<0.001) and, in female subjects, 15.5 IU/L of ALT cut-off level had sensitivity of 59.6% and specificity of 51.8% (area under curve 0.590, 95% CI 0.528-0.652, P=0.004). In total subjects, 20.4 IU/L of GGT cut-off level had 68.8% of sensitivity and 53.0% of specificity to predict MS (area under curve 0.656, 95% CI 0.602-0.710, P<0.001).
DISCUSSION
In the present study, both ALT and GGT activities, even within the reference interval, were correlated with incident NAFLD, even after adjusting for variable factors including presence of MS. Although the association of ALT activity with NAFLD was not significant in the second quartile, subjects in the fourth quartiles have risks for NAFLD to approximately three-fold than those in the lowest quartile. Although the association of GGT activity with NAFLD was weak, the odds ratio of GGT activity for NAFLD was elevated according to elevation of the GGT grading. In addition, ALT activity, within the reference interval, was associated with incident MS, even after adjustment for variable factors including fatty liver in a dose-dependent manner from second quartile. Although the association of GGT activity with MS was not significant in the second quartile and 95% CI include 1.0, subjects in the fourth quartiles have risks for MS to approximately two-fold than those in the lowest quartile in a dose dependent manner.
Among the hepatic enzymes, ALT is most closely related to liver fat accumulation.24 Our results appear to agree with the findings of several previous studies that increased ALT concentration, even within the reference interval, is an independent predictor of incident NAFLD12 and ALT is more closely associated than GGT with both hepatic IR and a later decline in hepatic insulin sensitivity.25 This finding could be explained by the higher specificity of ALT for liver injury.24 Also, as a gluconeogenic enzyme,12 increased ALT has been demonstrated to be an indicator of impaired insulin signaling, which might not necessarily be associated with liver injury due to hepatic steatosis.26,27 GGT might also be involved in the pathogenesis of NAFLD through another mechanism, such as oxidative stress.28
Elevated ALT could be a prognostic marker for development of various MS-related diseases, including type 2 DM, cardiovascular disease, and atherothrombosis, and a minor ALT elevation is also an important feature for effective screening of MS.7 Thus, individuals with a minor elevation in the serum ALT level that is close to the upper limits of the reference range are also of concern because elevated ALT itself is closely associated with IR, even in the absence of NAFLD and obesity.7 Because the mean ALT activities in subjects with 2 or 3 metabolic risk factors is not particularly high, tending only to be close to the upper limit, screening for serum ALT levels may facilitate identifying the potential risk for MS-related diseases in the general population,7 in addition to detection of liver disease, even within the reference interval.
The mechanism underlying the relationship between IR and GGT elevation has not been clarified, although hepatic steatosis or hepatic IR caused by visceral obesity may be the first mechanism.29-33 Because oxidative stress can play a role in the pathophysiology of cardiovascular disease, and GGT has a pivotal role in maintaining intracellular glutathione transport into most types of cells, oxidative stress provides a second possible mechanism.34-36 Increased GGT activity may be a response to oxidative stress, one which can increase the transport of glutathione precursors into cells. In addition, GGT leaks into serum possibly as a result of normal cell turnover and cellular stress.8 Subclinical inflammation may be another possible cause.37,38 In the present study, the white blood cell counts were also related to serum GGT and ALT concentrations. The significant associations between serum GGT and ALT activities and MS, even after adjusting for fatty liver, suggest that another mechanism governs the relationship between serum enzymes and MS, such as oxidative stress or subclinical inflammation.
In our study, the prevalence of NAFLD diagnosed by ultrasonography was 25.3%. Male gender was significantly associated with NAFLD. In addition, the increased ALT and GGT activities with the reference interval were associated with various cardiovascular disease risk factors, prevalence of fatty liver, number of components of metabolic abnormalities, and presence of MS.
In this study, using ROC curve, cut-off levels of ALT and GGT activities to predict NAFLD or MS were estimated. In male subjects, ALT activities within third grading were considered to predict NAFLD and MS, as cut-off levels. In female subjects, ALT activities within second grading were estimated as adequate cut-off levels to predict NAFLD and MS. In total subjects, GGT activities within third grading were considered as cut-off levels to NAFLD and MS. Therefore, even ALT and GGT levels within reference range may be considered to predict NAFLD and/or MS. However, this study is inadequate to clarify significance of ALT and GGT activities within reference level as predictor of NAFLD and/or MS.
In summary, even ALT and GGT activities within the reference interval correlated with incident NAFLD and MS in a dose-dependent manner, although the risks in lower quartiles were low according to the ALT or GGT grading. Therefore, increased ALT and GGT activities, despite remaining within the reference interval, might be an important preclinical marker of NAFLD and MS. Although the mechanism through which serum ALT and GGT are related to the risk for NAFLD and MS remains to be elucidated, ALT and GGT might be not only indicators of liver injury by hepatic steatosis, but also an early indicator of impaired insulin signaling, subclinical inflammation, and oxidative stress.12
Our study had some limitations. First, liver biopsies were not performed to determine hepatic steatosis and its severity. However, in other studies, ultrasonography was 82-94% sensitive and 66-95% specific in detecting fatty infiltration of the liver.8 Second, other causes of liver disease, such as autoimmune hepatitis, hemochromatosis, or Wilson's disease, could not be ruled out. Third, enrolled numbers in each groups were different. Especially, enrolled numbers in group 1 were small. However, we suggest these differences may be attributed to prevalence according to the gradings rather than problem of study design. Also, because this study was performed in apparently healthy Korean people undergoing health check-ups at a hospital, the study had selection bias. A cross-sectional study, prospective, multi-center study should be performed to clarify the relationship between hepatic enzymes and metabolic risk. Lastly, influence of drug including herb was not considered in this study.
In conclusion, grading of ALT and GGT activities with reference range correlated with NAFLD and MS, rather than the absolute normal limit. To date, although increased ALT and GGT concentrations are considered to have association with NAFLD and MS, it is unclear what underlies the relationship between enzymes and NAFLD and/or MS. Future studies are needed to demonstrate the related pathways and these correlation.
Acknowledgements
This study was supported by the 2009 research fund from the Wonkwang University.
Abbreviations
NAFLD
nonalcoholic fatty liver disease
MS
metabolic syndrome
ALT
alanine aminotransferase
GGT
γ-glutamyltransferase
DM
diabetes mellitus
MS
metabolic syndrome
IR
insulin resistance
WC
waist circumference
Sys. BP
systolic blood pressure
Dia. BP
diastolic blood pressure
T-bil.
total bilirubin
ALT
alanine aminotransferase
GGT
gamma glutamyltransferase
Cr
creatinine
T-chol.
total cholesterol
LDL-C.
LDL cholesterol
TG
triglyceride
HDL-C.
HDL-cholesterol
hs-CRP
high sensitivity-C-reactive protein
Hb
hemoglobin
BW
body weight
BMI
body mass index
TG
triglyceride
FBS
fasting blood glucose