


Graphical Abstract
INTRODUCTION
Since the first case of coronavirus disease 2019 (COVID-19) was identified in Wuhan, China in December 2019, as of June 2, 2020, a total of 6,194,533 laboratory-confirmed COVID-19 cases and 376,320 deaths had been documented worldwide [1]. The extensive expansion of COVID-19, caused by severe acute respiratory syndrome coronavirus 2 (SARS-CoV-2), represents a great concern globally [2,3]. Due to the rapid spread of COVID-19 and its high mortality rate, it is necessary to identify the risk factors affecting the clinical outcomes of COVID-19. Knowledge about the risk factors of COVID-19 can help in the decision-making process for early management of COVID-19 patients.
Previous studies have shown that COVID-19 patients with comorbidities had poor clinical outcomes [3-5]. Underlying comorbidities including diabetes, hypertension, chronic obstructive pulmonary disease (COPD), and cardiovascular disease are known to be risk factors of COVID-19. However, the impact of the presence of liver disease, which is one of the major public health problems worldwide, on the outcome of COVID-19 remains unclear [6]. Globally, liver disease accounts for approximately 2 million deaths per year [7]. Moreover, the incidence and severity of infection are higher in cirrhosis patients compared to the general population [8,9]. Only a few studies have been performed on liver disease and/or liver function as prognostic factors of COVID-19 [10,11]. In previous studies, data were obtained from retrospective studies with a relatively small number of patients, and there were differences in the results among studies [3-5]. In addition, those studies did not show the clinical outcomes according to the exact cause of liver disease, such as chronic hepatitis or liver cirrhosis. Therefore, studies on liver-related comorbidities in COVID-19 patients are urgently needed.
In South Korea, the first confirmed case of COVID-19 was a Chinese woman who traveled from Wuhan, China on January 20, 2020. Since then, there have been 11,590 confirmed cases of COVID-19 in South Korea, and 273 of them have died as of June 3, 2020 [12,13]. As a large number of confirmed patients were linked to a religious group and hospitalized psychiatric patients in a closed ward, there was an explosive outbreak in the country with hundreds of newly confirmed cases per day [12,14]. With a significant surge in new cases, deaths during home isolation while waiting for hospitalization or pending test results have occurred [14]. Therefore, the need to monitor individuals with the risk factors for COVID-19, including old age and/or underlying disease, has emerged.
In this study, we evaluated the implication of existing liver-related comorbidities on the clinical outcomes of COVID-19 patients.
PATIENTS AND METHODS
Patients
From February 17 to April 6, 2020, patients with laboratory-confirmed COVID-19 who were admitted to five designated tertiary hospitals in Daegu, South Korea were included in this study. COVID-19 was diagnosed according to the interim guidance of the World Health Organization (WHO), mainly by the detection of the SARS-CoV-2 sequence in the nasopharyngeal and oropharyngeal swab [15,16].
The study was performed in accordance with the ethical guidelines of the Helsinki Declaration of 1975, as revised in 2013. The study protocol was approved by the Institutional Review Board of Kyungpook National University Hospital (IRB No. KNUCH-2020-04-017). Informed consent from study participants was waived by the ethics committee of the designated hospitals.
Data collection and study definition
We obtained medical records such as demographic variables, comorbidities, clinical symptoms, laboratory findings, and radiologic imaging studies on admission, treatments, complications, and clinical outcomes from electronic records. Laboratory testing included a complete blood count, serum C-reactive protein, serum procalcitonin, liver and renal function test, coagulation testing, serum lactate dehydrogenase, and serum reatine kinase. The data cut-off point for the study was April 30, 2020.
The degree of severity of COVID-19 (severe vs. non-severe) was defined based on the WHO interim guidance for COVID-19 [17]. Shock and acute respiratory distress syndrome (ARDS) were also determined in accordance with the WHO interim guidance [17]. Acute kidney injury was diagnosed by the highest serum creatinine level and urine output [18]. Secondary infection was identified if the patients had both clinical symptoms or signs of bacteremia or pneumonia, and a positive culture of a new pathogen from blood samples or a lower respiratory tract specimen. For patients requiring oxygen administration, the most intense level of oxygen therapy (nasal cannula or venturi mask, high-flow nasal cannula, invasive mechanical ventilation, or invasive mechanical ventilation with extracorporeal membrane oxygenation) was recorded.
Chronic hepatitis B or C infection, liver cirrhosis, and hepatocellular carcinoma (HCC) were identified by history taking, serology test, and/or imaging studies such as computed tomography [19]. Non-alcoholic fatty liver disease (NAFLD) was defined using hepatic steatosis index [HSI = 8 ├Ś (alanine aminotransferase [ALT] / aspartate aminotransferase ratio) + body mass index (BMI) + (+2, if diabetes mellitus; +2, if female)] of more than 36 points [20]. For each patient with liver cirrhosis, Child-Pugh class, model for endstage liver disease (MELD), chronic liver failure organ failure (CLIF-OF) score, and CLIF Consortium acute-on-chronic liver failure (CLIF-C ACLF) score were assessed on admission. ACLF on admission was also assessed and graded according to the EASL-CLIF definition at diagnosis of COVID-19 [21]. Hepatic flare was defined as ALT level Ōēź5 ├Ś upper limit of normality.
Study outcomes
The primary endpoint was clinical outcomes (including oxygen supplementation, the use of high-flow oxygen therapy and invasive mechanical ventilation, admission to intensive care unit [ICU], ARDS, or death) in COVID-19 patients with coexisting liver disease. The secondary endpoint was independent predictors of disease severity and mortality in COVID-19.
Statistical analysis
Data are presented as the median and interquartile range (IQR) or numbers (%) as appropriate. No imputation was conducted for missing data. Categorical variables were compared using the Chi-square test (or FisherŌĆÖs exact test), while StudentŌĆÖs t-test (or Mann-WhitneyŌĆÖs test) was used to compare continuous variables. The cumulative overall survival rates were estimated using the Kaplan-Meier method. Factors related to the severity of COVID-19 were identified with univariate and multivariate logistic regression analysis. The multivariate Cox proportional hazards regression test was used to identify the factors associated with mortality. The odds radio (OR), hazard ratio (HR), and 95% confidence interval (CI) were also determined. A P-value<0.05 was considered statistically significant. Statistical analyses were performed using IBM SPSS Statistics for Windows version 25.0 (IBM Corp., Armonk, NY, USA).
RESULTS
Baseline characteristics and clinical outcomes of COVID-19
From February 17 to April 6, 2020, a total of 1,005 patients (361 men and 644 women) were included in this study. Baseline characteristics of the patients are summarized in Table 1. The median age was 61 years. The most common symptoms of COVID-19 were cough (n=567, 57.1%), followed by fever and chills (n=452, 45.4%). Eight patients were healthcare-related COVID-19, and all of these patients had no pre-existing liver disease. Radiologic abnormality was found in 587 patients (58.4%). Oxygen therapy was administered to 289 patients (28.8%); among them, 70 patients (7.0%) underwent invasive mechanical ventilation. Ninety-seven patients (9.7%) were admitted to the ICU, and 113 patients (11.2%) had ARDS. Seventy-seven patients (7.7%) died after a median of 11 (6ŌĆō25) days from COVID-19 diagnosis (Table 2). All patients died of respiratory failure due to progression of COVID-19.
When the patients were divided into severe (n=133, 13.2%) and non-severe (n=872, 86.8%) disease in accordance with WHO interim guidance for COVID-19 [17], patients with severe pneumonia had significantly older age, higher body mass index, and more frequent smoking history (P<0.05) (Supplementary Table 1). The presence of comorbidities, including liver cirrhosis, diabetes, and hypertension, was more common in patients with severe disease compared to those with non-severe disease (P<0.05). However, there was no difference in the presence of chronic hepatitis between the two groups. More abnormalities in laboratory tests and radiographic images were found in patients with severe disease than those with mild disease. A higher percentage of patients with severe disease received antiviral therapy, hydroxychloroquine, systemic glucocorticoid, immunoglobulin, and oxygen therapy compared to patients with non-severe disease (P<0.05) (Supplementary Table 2). Patients with severe disease had a higher proportion of ICU admission, septic shock, ARDS, acute kidney injury, and death compared to patients with non-severe disease (P<0.05).
Comparison of COVID-19 patients with and without pre-existing liver disease
Of the 47 patients (4.7%) who had liver-related comorbidities, 14 patients (1.4%) had liver cirrhosis (Table 1). There were no significant differences in age, pre-existing comorbidities, or respiratory symptoms between COVID-19 patients with underlying liver disease and those without coexisting liver-related comorbidity (Table 1). Abnormal chest radiograph was more common in patients with chronic liver disease, but bilateral involvement on chest radiographs was not different between the two groups. ICU admission, septic shock, ARDS, acute kidney injury, and death were not statistically different.
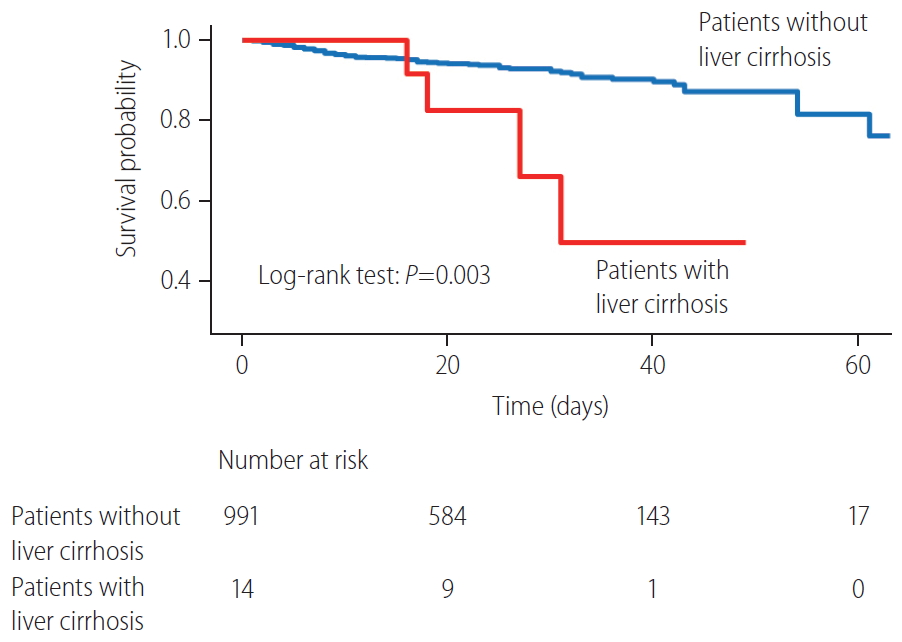
Patients with liver cirrhosis had more lymphocytopenia, thrombocytopenia, and chest radiograph abnormalities compared to patients without liver cirrhosis (P<0.05) (Table 1). Patients with liver cirrhosis had a significantly higher risk of oxygen therapy (total oxygen requirement 57.1% vs. 28.4%, P=0.032; high-flow oxygen therapy 42.9% vs. 12.2%, P=0.005), ICU admission (35.7% vs. 9.3%, P=0.007), septic shock (28.6% vs. 7.7%, P=0.020), ARDS (35.7% vs. 10.9%, P=0.014), and acute kidney injury (21.4% vs. 5.2%, P=0.037) than did patients without liver cirrhosis (Table 2). Four of 14 cirrhotic patients (28.6%) and 73 of 991 non-cirrhotic patients (7.4%) died of COVID-19 (P=0.018). The overall survival rate was significantly lower in patients with liver cirrhosis than in those without liver cirrhosis (log-rank test, P=0.003) (Fig. 1).
Independent predictors of severe pneumonia in COVID-19
In multivariate analysis, higher age (OR, 4.32; 95% CI, 2.73ŌĆō6.84; P<0.001), presence of liver cirrhosis (OR, 4.52; 95% CI, 1.20ŌĆō17.02; P=0.026), diabetes (OR, 2.26; 95% CI, 1.43ŌĆō3.58; P=0.001), chronic renal disease (OR, 4.20; 95% CI, 1.20ŌĆō14.71; P=0.025), fever and chill (OR, 2.93; 95% CI, 1.86ŌĆō4.62; P<0.001), and shortness of breath (OR, 5.82; 95% CI, 3.79ŌĆō8.95; P<0.001) were identified as independent predictors of severe COVID-19 (Table 3).
Independent predictors of mortality in COVID-19
Multivariate analysis showed that higher age (HR, 4.96; 95% CI, 2.65ŌĆō9.30; P<0.001), presence of liver cirrhosis (HR, 2.86; 95% CI, 1.04ŌĆō9.30; P=0.042), diabetes (HR, 2.29; 95% CI, 1.44ŌĆō3.64; P<0.001), COPD (HR, 4.52; 95% CI, 1.85ŌĆō11.02; P=0.001), fever and chill (HR, 2.69; 95% CI, 1.60ŌĆō4.53; P<0.001), and shortness of breath (HR, 2.34; 95% CI, 1.43ŌĆō3.83; P=0.001) were all significantly associated with mortality in COVID-19 (Table 4).
Clinical outcomes and risk factors for mortality in COVID-19 patients with liver cirrhosis
We determined the clinical outcomes and risk factors for mortality in COVID-19 patients with liver cirrhosis. Fourteen COVID-19 patients with cirrhosis (Child- Pugh class A and B in nine and five patients, respectively) were included and analyzed (Table 5). The most common etiology of cirrhosis was chronic hepatitis B (n=5) and alcohol (n=5), followed by chronic hepatitis C (n=2), autoimmune hepatitis (n=1), and unknown etiology (n=1). Two patients had a history of HCC treatment (radiofrequency ablation), and there was no evidence of recurrence. Seven patients (50%) had decompensated liver cirrhosis. The initial MELD score was 8 (IQR, 7ŌĆō12). CLIF-C ACLF score and CLIF-OF score were 92 (IQR, 49ŌĆō106) and 6 (IQR, 6ŌĆō6.25), respectively. ACLF was diagnosed in one patient (grade I) on admission. Hepatic flare occurred in three of 14 patients (21.4%), all of whom survived. The most common symptoms were fever (n=8, 57.1%), followed by shortness of breath (n=6, 42.9%). Ten patients (71.4%) received antiviral therapy with lopinavir/ritonavir and seven (50%) received hydroxychloroquine (Table 6). Four patients (28.6%) experienced septic shock and five patients (35.7%) had ARDS. Among these patients, four (28.6%) died after a median of 23 days (16ŌĆō32) from COVID-19 diagnosis.
We compared non-survivors (n=4) with survivors (n=10) among COVID-19 patients with liver cirrhosis. There were no significant differences between non-survivors and survivors in age, comorbidities, etiology, and stage of cirrhosis. Clinical symptoms, laboratory findings, and radiologic findings were not also related to prognosis. ICU admission, septic shock, ARDS, and acute kidney injury were more common in non-survivors than in survivors (P<0.05). Among the four non-survivors, all patients developed septic shock and ARDS, and all died of respiratory failure due to the progression of COVID-19. There was no worsening or new onset of jaundice, ascites, or cirrhosis-related complications, such as spontaneous bacterial peritonitis, esophageal variceal bleeding, or hepatic encephalopathy.
DISCUSSION
Due to the rapid spread of COVID-19 and the subsequent overwhelmed medical resources in many countries, it is important to evaluate the risk factors affecting the course of COVID-19. Globally, chronic liver disease represents a significant disease burden [7,22]. Moreover, as the severity of infection is known to be greater in cirrhotic patients than in the general population, studies on the implication of liver-related comorbidity on the outcomes of COVID-19 should be conducted [8]. However, the impact of liver disease in SAR-CoV-2 infection remains unclear. In the present study, we assessed the impact of liver-related comorbidity on the clinical outcomes of COVID-19 patients.
In this study, a total of 1,005 patients were included and analyzed. Liver cirrhosis was more common in patients with severe pneumonia than in those with non-severe pneumonia. When comparing patients with liver-related comorbidity to those without underlying liver disease, no significant differences were found in respiratory symptoms and clinical outcomes. Patients with liver cirrhosis needed more oxygen therapy and had a higher risk of admission to the ICU, septic shock, ARDS, acute kidney injury, and death. Multivariate analysis revealed that the presence of liver cirrhosis was significantly associated with disease severity and mortality in COVID-19, along with old age, diabetes, fever, and shortness of breath. Among COVID-19 patients with cirrhosis, there were no significant differences in the stage of cirrhosis, clinical symptoms, and laboratory findings between non-survivors and survivors.
This study has several strengths and provides some important findings. First, this study demonstrated the impact of liver disease on the clinical outcomes of COVID-19 in a large number of patients. There were no significant differences in clinical outcomes between COVID-19 patients with underlying liver disease and those without coexisting liver-related comorbidity. However, liver cirrhosis was associated with worsening clinical outcomes, disease severity, and mortality of COVID-19, even after adjusting for other risk factors. Such result suggests that liver cirrhosis is an important risk factor of COVID-19. Second, after the outbreak of COVID-19 in South Korea, mild COVID-19 patients were relocated to ŌĆ£life treatment centers,ŌĆØ which were temporary residence for isolation. As their symptoms progressed, the patients were referred to the hospital [12,14]. Since then, the number of confirmed patients has gradually decreased. Therefore, we can evaluate the mortality rate and treatment outcomes of COVID-19 in a relatively stable situation with little depletion of medical resources. By June 3, 2020, the case fatality rates of COVID-19 in South Korea was 2.4% [13]. Third, most of the patients in our study cohort experienced discharge or death, and only 6% were hospitalized when the analyses were performed. Therefore, analysis on the risk factors of mortality could be conducted accurately.
Liver injury in COVID-19 patients might be caused by not only viral infection of liver cells, but also severe inflammatory response, such as cytokine storm, hypoxia, and drug-induced liver injury caused by antiviral agents, including lopinavir/ritonavir, remdesivir, and chlorquine [23,24]. In COVID-19 patients with liver cirrhosis, poor outcomes might be associated with their systemic immunocompromised status. Cirrhosis is associated with dysfunctions of the innate and adaptive immunity. Deterioration of liver function causes a reduction in the number and dysfunction of neutrophils, monocytes, and innate immunity proteins. Both B and T lymphocytes involved in acquired immunity are also reduced in number and show functional impairment [25,26]. Moreover, a previous report showed that multiple factors exacerbate alveolar epithelial injury and increase vascular permeability in cirrhotic patients with ARDS. Systemic inflammation also promotes decompensation, organ failures and ACLF in patients with cirrhosis and ARDS [27,28].
In our study, 14 patients had liver cirrhosis. Among them, seven patients had decompensated liver cirrhosis. Four patients had history of esophageal variceal bleeding, one had history of both esophageal variceal bleeding and hepatic encephalopathy, and the other two patients had ascites. During hospitalization, there was no worsening of ascites or jaundice, and ascites were well-controlled by taking diuretics. New-onset cirrhosis-related complications, such as spontaneous bacterial peritonitis, esophageal variceal bleeding, and hepatic encephalopathy, did not occur. Moreover, the presence of decompensation, stage of cirrhosis, and laboratory findings did not affect the prognosis of COVID-19 patients with liver cirrhosis. Among the non-survivors, all patients died from respiratory failure. Unlike our study, recent studies have shown that lower lymphocyte and platelet counts, as well as higher serum direct bilirubin levels were related to poor prognosis in COVID-19 patients with liver cirrhosis, and 29% of cirrhotic patients died of end-stage-liver disease [10,11]. This inconsistency of results might be due to the small number of cirrhotic patients in our study, and further studies with a large number of patients are needed to resolve this issue.
Of a total of 47 patients with chronic liver disease, 24 patients (2.4%) had chronic hepatitis B infection. Among them, 19 patients had chronic hepatitis and five patients had liver cirrhosis. In patients with chronic hepatitis B infection, viral replication status and medication history of nucleos(t)ide analogues could not be confirmed in all patients. However, initial transaminase elevation over 60 U/L was observed only in one patient, and the patient had taken tenofovir disoproxil fumarate. After three days, transaminase levels decreased to under 50 U/L. Based on this result, there was no acute exacerbation of chronic hepatitis B during hospitalization in COVID-19 patients.
A recent study showed that NAFLD identified with HSI more than 36 points and/or abdominal ultrasound was associated with COVID-19 progression [29]. In our study, NAFLD, defined by HSI, was not related to clinical outcomes such as severe COVID-19 and mortality (P=0.244 and P=0.631, respectively). However, being overweight (BMI Ōēź25 kg/m2) was associated with disease severity and death in COVID-19 patients, and further studies are needed to validate this result.
This study showed a mortality rate of 7.7%. By June 3, 2020, the actual case fatality rate of COVID-19 in South Korea was 2.4% according to the Korea Centers for Disease Control and Prevention [13]. This difference occurred as patients with mild disease were not included in our study. Since patients with mild disease confirmed in outpatient settings who were treated in life treatment centers or at home had only brief medical information and limited laboratory testing, we excluded them from this study. Our study cohort included patients who were admitted to tertiary hospitals; therefore, it may represent the more severe patients of COVID-19.
This study had some limitations. First, some cases had incomplete records of clinical symptoms, laboratory testing, viral replication status, and medication history due to the retrospective nature of the study. Second, as described earlier in discussion, patients with mild disease were not included in this study; therefore, our study cohort may represent the more severe patients of COVID-19. To investigate the effect of liver-related comorbidity on clinical outcomes, further studies including mild patients as well as patients with severe disease will be required. However, since the prevalence of liver disease in our study was similar to that of the entire population, our findings are thought to be meaningful.
Amid the explosive outbreak of COVID-19 worldwide, research on the risk factors of this infectious disease is important. This study suggests that liver cirrhosis is an important risk factor of COVID-19. Stronger personal protection for COVID-19 is recommended, and more attention is needed in treating patients with advanced liver disease.

 PDF Links
 PubReader
 ePub Link
 Full text via DOI
 Full text via PMC
 Download Citation
 Supplement1
 Print
Print