


Graphical Abstract
INTRODUCTION
Metabolic syndrome is a cluster of metabolic derangements caused by central obesity and insulin resistance, and presents increased cardiovascular disease risk as their clinical outcome [1]. Patients with metabolic syndrome are at increased risk of cardiovascular disease-related mortality and all-cause mortality. Thus, early detection and intervention of metabolic syndrome are imperative. However, frequently, diagnosis of metabolic syndrome is only possible after complications have already begun [2,3].
Screening metabolic syndrome with a single serum biomarker is difficult, as it encompasses a wide range of disorders that develop at various times [4,5]. Several diagnostic criteria for metabolic syndrome which designate values for obesity, hypertension, hyperglycemia, triglyceride and high density lipoprotein (HDL)-cholesterol levels, and urine albumin have been outlined [6]. In addition, novel biomarkers were discovered to aid in earlier diagnosis when clinical signs are not obvious [7-9]. While numerous studies have evaluated various cytokines and adipokines thought to be useful as biomarkers, no single biomarker alone has been found to be indicative of metabolic syndrome [10]. Nevertheless, the development of improved biomarkers is needed to identify individuals with metabolic syndrome and decrease the overall prevalence of the disease in general population using an easy and less invasive method.
Although the entire mechanism of metabolic syndrome is yet to be determined, it is suggested that systemic oxidative stress promotes chronic inflammation, resulting in altered endothelial function and impaired lipid metabolism, and affecting insulin sensitivity [11]. Milk fat globule-EGF factor-8 (MFG-E8) is a multifunctional glycoprotein originally identified as part of the milk fat globule membrane which regulates inflammation through integrin-mediated clearance of apoptotic cells [12,13]. In addition, previous studies reported that MFG-E8 promotes obesity by mediating uptake of dietary fats and serum fatty acids [14,15]. MFG-E8 also acts as a bridging molecule between phosphatidylserine on extracellular vesicles and integrins on various cells [16,17]. Extracellular vesicles play important roles in intercellular communication by exchanging substances including lipids [18]. All these pathways that serum MFG-E8 involves in are pathogenic processes of metabolic syndrome. Thus, we hypothesized that serum MFG-E8 level could feasibly serve as a biomarker for detecting metabolic syndrome in general population.
Hence, we performed this study on Seoul Metabolic Syndrome (S-MAS) cohort, consisting of subjects aged 30 to 64 years with no history of cardiovascular disease. We investigated the predictive performance of serum MFG-E8 level for the diagnosis and prediction of the development of metabolic syndrome.
MATERIALS AND METHODS
Subjects
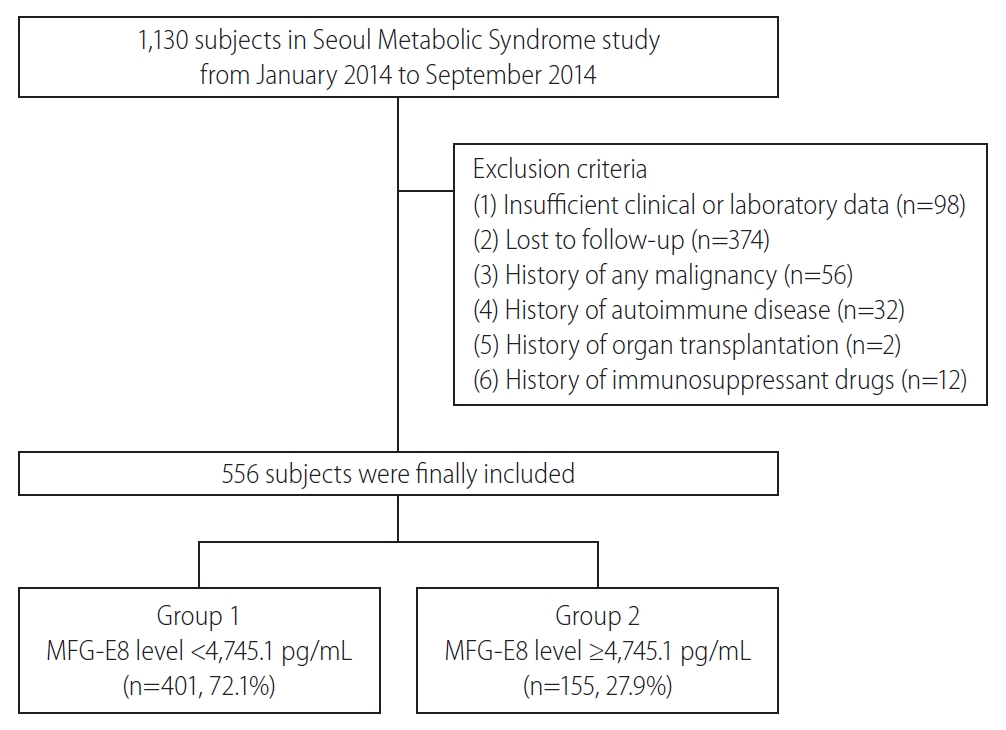
This is a prospective study on the S-MAS cohort performed by Korea University Anam Hospital in Seoul, Korea. This study originally aimed to investigate significant prognostic factors and develop valuable prognostic models in metabolic syndrome patients. A total of 1,130 subjects between 30 and 64 years of age were enrolled from 25 public healthcare centers from January to September 2014. Subjects with previous history of angina pectoris, myocardial infarction, stroke, or any revascularization were excluded. Medical examination, standardized questionnaire assessment, laboratory and hemodynamic measurements were performed at baseline. A total of 756 participants were visited for follow-up evaluation until November 2017. The exclusion criteria were as follows: 1) insufficient clinical or laboratory data, 2) lost to follow-up, 3) history of any malignancy, 4) history of autoimmune disease, 5) history of organ transplantation, and 6) history of immunosuppressant drugs (Fig. 1). This study protocol followed the ethical guidelines of the 1975 Declaration of Helsinki, and the Institutional Review Board of Korea University Anam Hospital approved this study (IRB No. ED13087). Written informed consent was obtained from each subject.
Definition of metabolic syndrome
Metabolic syndrome was defined according to the criteria of the joint interim statement of the International Diabetes Federation Task Force on Epidemiology and Prevention, the National Heart, Lung, and Blood Institute, the American Heart Association, the World Heart Federation, the International Atherosclerosis Society, and the International Association for the Study of Obesity in 2009 [6]. Accordingly, metabolic syndrome was defined as involving three of the following five criteria: 1) increased waist circumference (≥90 cm in men and ≥80 cm in women), 2) elevated serum triglyceride level (≥150 mg/dL) or drug treatment for elevated triglyceride level, 3) reduced serum HDL-cholesterol level (<40 mg/dL in men and <50 mg/dL in women) or drug treatment for reduced HDL-cholesterol level, 4) elevated blood pressure (BP) (≥130/85 mmHg) or use of antihypertensive medication, and 5) elevated fasting glucose level (fasting plasma glucose ≥100 mg/dL) or drug treatment for elevated glucose level.
Clinical evaluation and laboratory measurements
Each subject answered a self-administered questionnaire regarding medical history, anti-diabetic, anti-hyperlipidemic, and anti-hypertensive treatment, alcohol intake, and smoking habit at baseline. Alcohol intake and smoking habit were classified as either current or not current.
Blood samples were collected from each subject after an overnight fast of at least 10 hours at baseline and follow-up examinations. Sitting BP was measured in each arm, and the average value was calculated for analyses. Height and body weight were measured in light clothing without shoes. Pulse wave velocity was measured from carotid-radial artery with non-invasive applanation tonometry. Serum specimens collected at baseline were stored at -80°C until the measurement of serum MFG-E8 levels. Serum MFG-E8 levels was determined using an enzyme-linked immunosorbent assay kit (DFGE80; R&D Systems, Minneapolis, MN, USA) according to the manufacturer’s instructions.
Statistical analysis
Data are presented as mean (interquartile range) or numbers with percentages. The statistical significance of differences between continuous and categorical variables was compared using Student’s t-test or Mann-Whitney U test and chi-square test, respectively. The predictive accuracy for metabolic syndrome was assessed using area under the receiver operating characteristic curves (AUROCs) as well as 95% confidence intervals (CIs). Optimal cut-off values were selected to maximize the sum of sensitivity and specificity. The logistic regression analysis was used to evaluate the association between risk factors and metabolic syndrome, and Cox regression analysis was performed for further metabolic syndrome development. Associations were presented as odds ratios (ORs) or hazard ratios (HRs) with 95% CIs. Statistical analyses were conducted using IBM SPSS Statistics software (version 23.0.0.0; IBM Corporation, Armonk, NY, USA). Two-sided P-values <0.05 were considered significant.
RESULTS
Baseline characteristics
The baseline characteristics of the study subjects are presented in Table 1. A total of 556 subjects were included. The study subjects consisted of 279 women (50.2%) and 277 men (49.8%). The mean age of the subjects was 55.1 years. One hundred and three (18.5%) of the study population had diabetes and 299 (53.8%) had hypertension, respectively. Among all included subjects, 236 (42.4%) were defined as having metabolic syndrome at baseline. Subjects with metabolic syndrome had significantly younger age, higher mean body mass index (BMI), higher mean serum creatinine, and higher mean pulse wave velocity than those without metabolic syndrome (all P<0.05). The proportion of male was higher in subjects with metabolic syndrome than in those without (P<0.001). The mean total cholesterol and low-density lipoprotein (LDL)-cholesterol levels were comparable between two groups (all P>0.05). The mean serum MFG-E8 level of subjects with metabolic syndrome was significantly higher than that of subjects without metabolic syndrome (4,749.4 vs. 3,786.0 pg/mL, P<0.001).
Correlation of serum MFG-E8 level and metabolic syndrome components
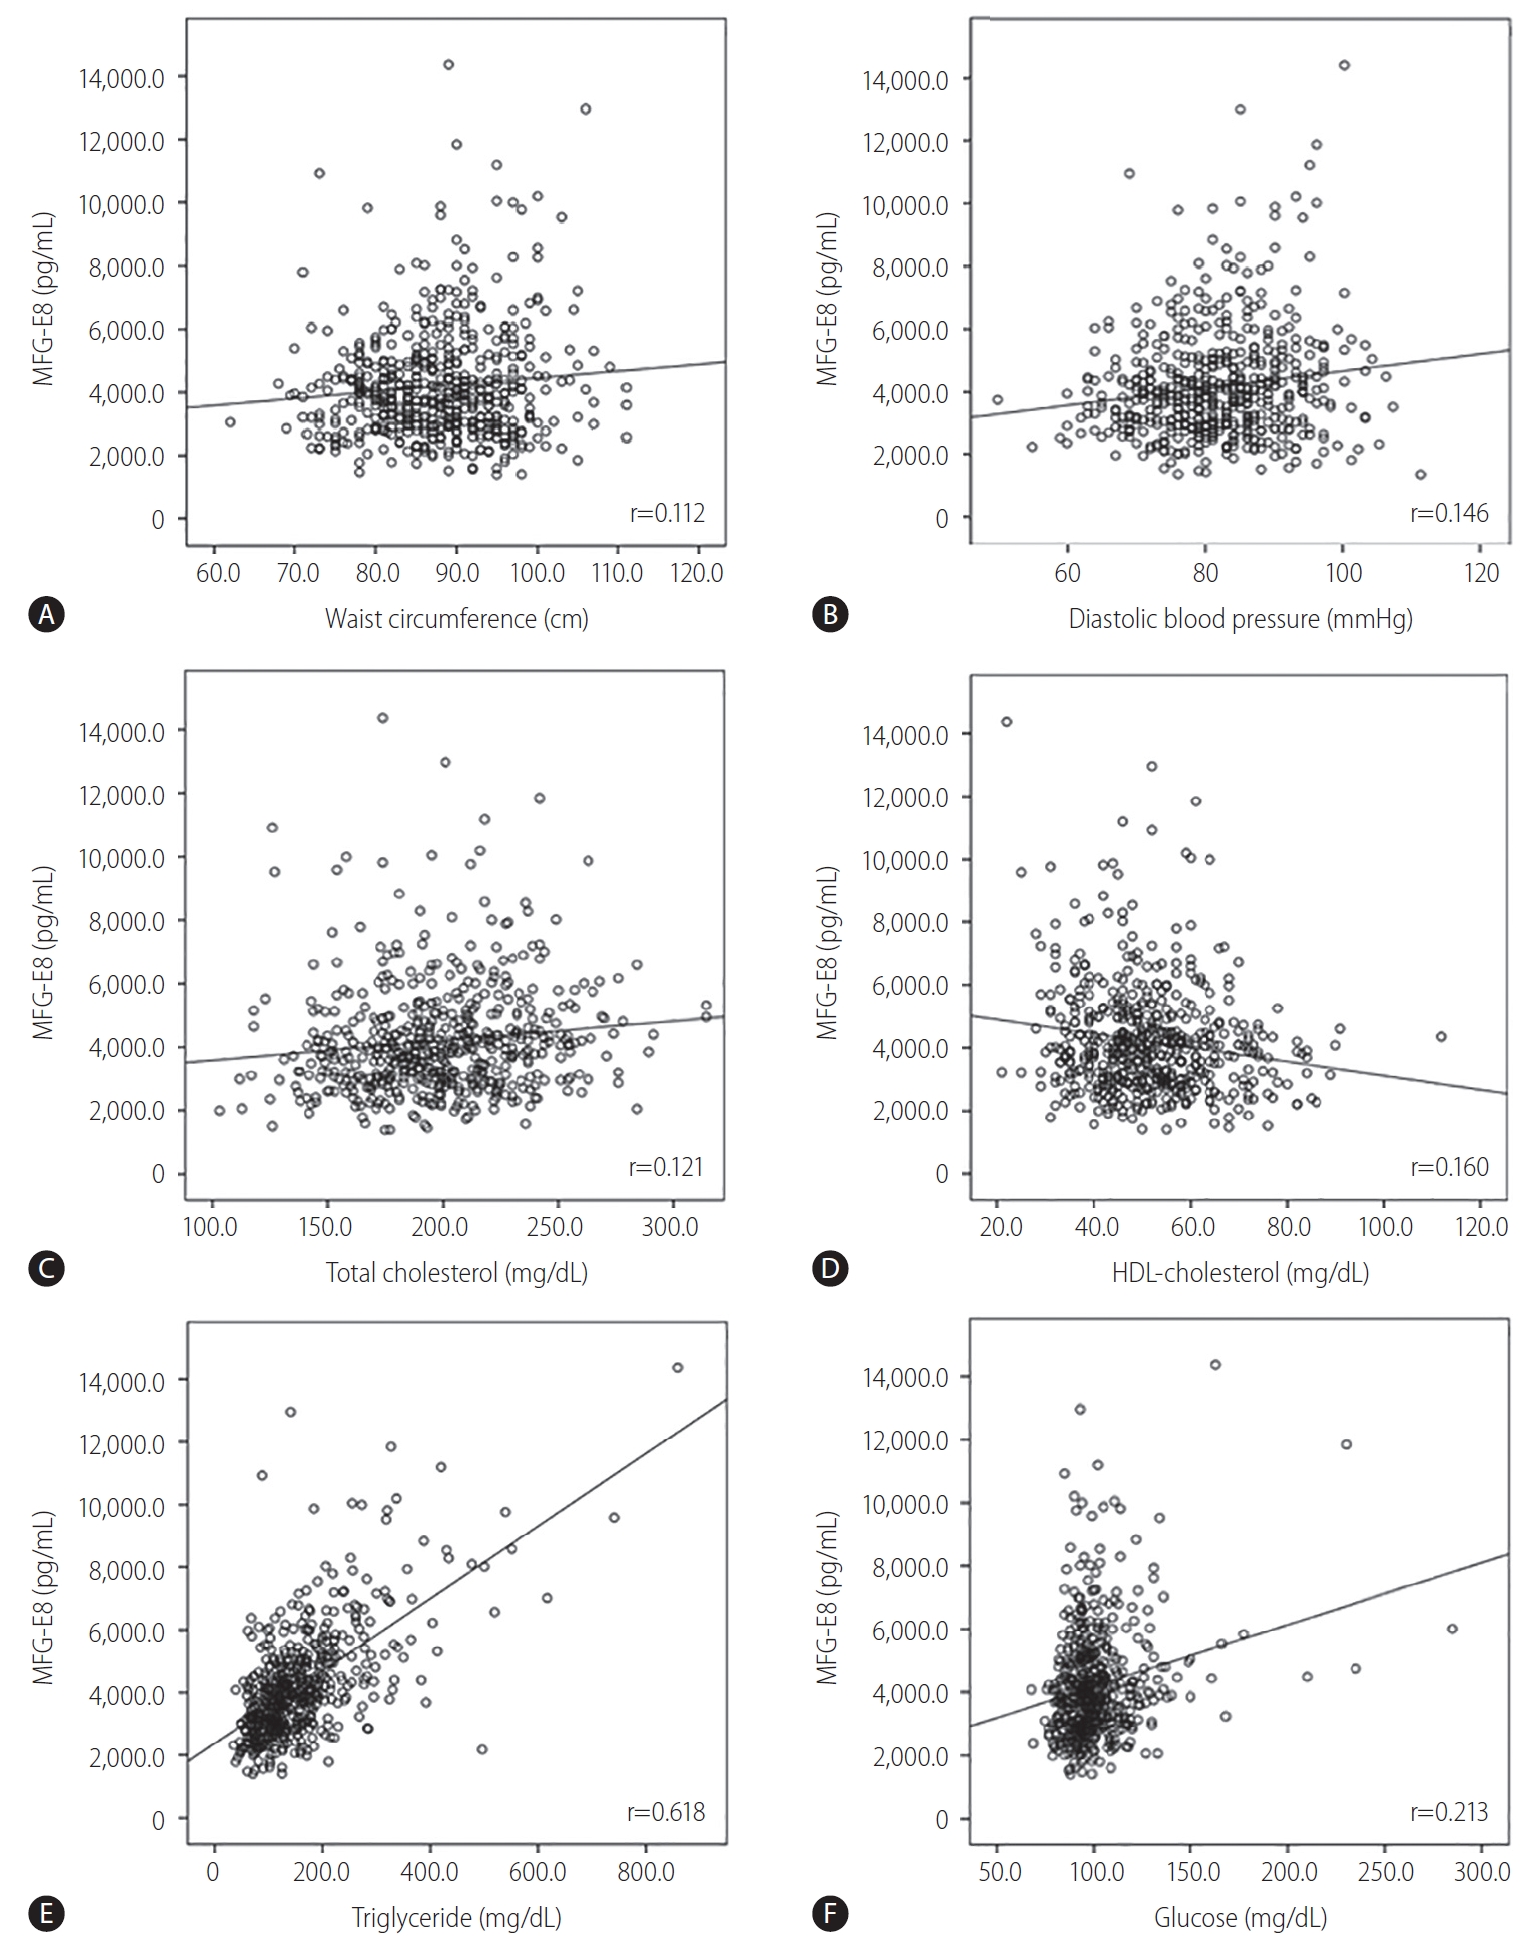
Serum MFG-E8 level was significantly correlated with waist circumference (Pearson’s correlation coefficient, 0.112; P=0.008), diastolic BP (0.146, P=0.001), serum total cholesterol (0.121, P=0.005), HDL-cholesterol (-0.160, P<0.001), triglyceride (0.618, P<0.001), glucose (0.213, P<0.001) levels, and pulse wave velocity (0.134, P=0.002) (Fig. 2). In addition, serum MFG-E8 level was significantly higher in subjects with diabetes than in those without (4,558.5 vs. 4,112.3 pg/mL, P=0.018).
Prevalence of metabolic syndrome and patient characteristics at baseline according to the groups classified by serum MFG-E8 level
The AUROC of the serum MFG-E8 level for the presence of metabolic syndrome at baseline was 0.644 (95% CI, 0.597-0.691; P<0.001) (Fig. 3). The optimal cut-off value of the serum MFG-E8 level for the diagnosis of metabolic syndrome was 4,745.1 pg/mL (sensitivity 41.9%, specificity 82.5%, positive predictive value 63.9%, negative predictive value 65.8%). Subjects were categorized into two groups according to the serum MFG-E8 level as follows: group 1, serum MFG-E8 level <4,745.1 pg/mL (n=401, 72.1%); group 2, serum MFG-E8 level ≥4,745.1 (n=155, 27.9%).
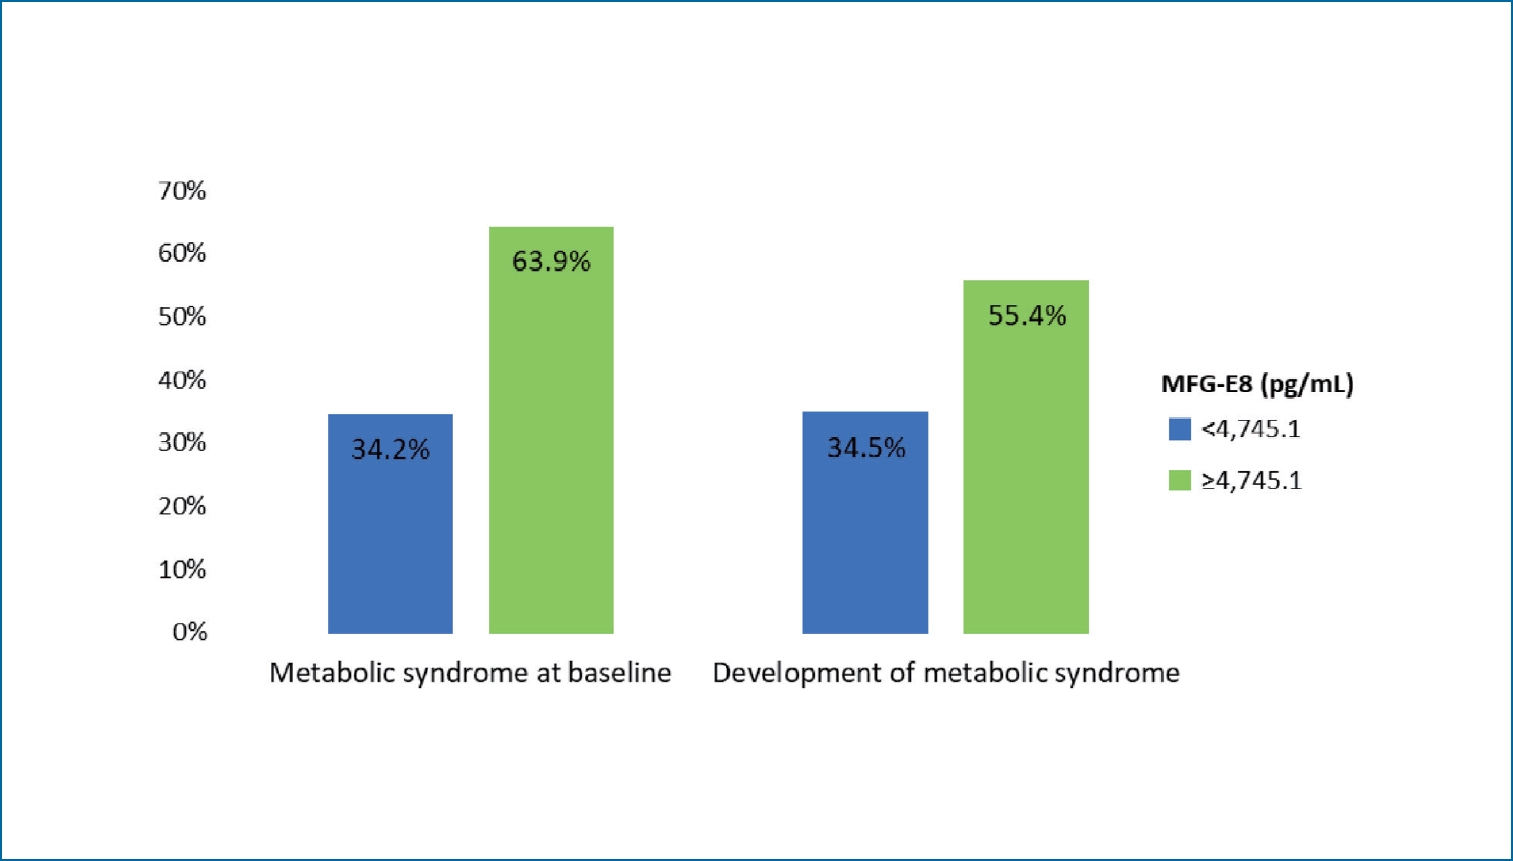
At baseline, the prevalence of metabolic syndrome in group 2 was significantly higher than that in group 1 (63.9% vs. 34.2%, P<0.001). The prevalence of diabetes, hypertension, and dyslipidemia at baseline was comparable between two groups (all P>0.05). Male sex was significantly more prevalent in group 2 than in group 1 (63.2% vs. 44.6%, P<0.001). The mean waist circumference, diastolic BP, total cholesterol, triglyceride, glucose, creatinine levels, and pulse wave velocity of group 2 were significantly higher than those of group 1 (all P<0.05). The mean HDL-cholesterol level of group 2 was significantly lower than that of group 1 (P<0.001) (Table 2).
Prevalence of metabolic syndrome and patient characteristics at follow-up according to the groups classified by serum MFG-E8 level
During the follow-up period of median 17 months, metabolic syndrome newly developed in 122 (38.1%) of 320 subjects without metabolic syndrome at baseline. The incidence of metabolic syndrome in group 2 was significantly higher than that in group 1 (55.4% vs. 34.5%, P=0.003). The prevalence of diabetes, hypertension, and dyslipidemia at follow-up was comparable between two groups (all P>0.05). At follow-up, the mean diastolic BP, total cholesterol, triglyceride levels, and pulse wave velocity of group 2 were significantly higher than those of group 1 (all P<0.05). The mean HDL-cholesterol level of group 2 was significantly lower than that of group 1 (P<0.001) (Supplementary Table 1).
The proportions and characteristics of patients according to the changes of the presence of metabolic syndrome are presented in Supplementary Table 2. The mean MFG-E8 level was 3,636.4 pg/mL in subjects without metabolic syndrome (n=198, 35.6%), 4,029.0 pg/mL in subjects who developed metabolic syndrome at follow-up (n=122, 21.9%), 4,440.6 pg/mL in subjects with disappeared metabolic syndrome at follow-up (n=72, 12.9%), and 4,885.0 pg/mL in subjects with sustained metabolic syndrome). The mean MFG-E8 level of subjects with sustained metabolic syndrome was significantly higher than that of subjects without metabolic syndrome and those who developed metabolic syndrome at follow-up (all P<0.001).
Predictors for diagnosis and further development of metabolic syndrome
Independent predictors for diagnosis and further development of metabolic syndrome were investigated (Table 3). In univariate analysis, younger age, male sex, higher BMI, lower LDL-cholesterol, higher creatinine level and MFG-E8 level ≥4,745.1 pg/mL were significantly related to the higher probability for metabolic syndrome at baseline (all P<0.05). Multivariate analysis showed that male sex (OR, 1.818; 95% CI, 1.076–3.074; P=0.026), higher BMI (OR, 1.273; 95% CI, 1.183–1.369; P<0.001), and MFG-E8 level ≥4,745.1 pg/mL (OR, 3.493; 95% CI, 2.298–5.311; P<0.001) were independent predictors for metabolic syndrome at baseline. In addition, higher BMI (HR, 1.137; 95% CI, 1.067–1.212; P<0.001), MFG-E8 level ≥4,745.1 pg/mL (HR, 1.971; 95% CI, 1.333–2.915; P=0.001) were significantly related to development of metabolic syndrome at follow-up.
DISCUSSION
The screening and prediction of metabolic syndrome are considered to be of great importance for public health; however, the useful single biomarker for metabolic syndrome has not been established yet. In this prospective cohort study, we investigated the diagnostic and predictive performance of serum MFG-E8 levels in metabolic syndrome. Subjects with serum MFG-E8 level ≥4,745.1 pg/mL exhibited a significantly higher risk for metabolic syndrome. The risk for further development of metabolic syndrome was also significantly higher in subjects with serum MFG-E8 level ≥4,745.1 pg/mL. In addition, MFG-E8 level ≥4,745.1 pg/mL was an independent predictor for metabolic syndrome following adjustment for other important factors including smoking, alcohol status, and other biomarkers.
The best cut-off value of serum MFG-E8 level for the presence of metabolic syndrome was 4,745.1 pg/mL with a sensitivity of 41.9% and specificity of 82.5%. When subjects were classified into two groups with this cut-off value, the prevalence of metabolic syndrome was significantly different between groups (63.9% vs. 34.2%, P<0.001). In a previous study, adiponectin showed a 52.3% and 37.5% prevalence of metabolic syndrome in men and women, respectively, with its best cut-off value [7]. In another study, the AUROC of adiponectin for the diagnosis of metabolic syndrome was 0.682–0.644 [9]. Compared to adiponectin, serum MFG-E8 could be a comparable or better surrogate marker for the diagnosis of metabolic syndrome. Recently, the leptin/adiponectin ratio showed an AUROC of 0.771–0.778 in the diagnosis of metabolic syndrome [8,9]. Studies comparing these biomarkers in a single cohort are needed for further validation.
Serum MFG-E8 showed a significant correlation with all components of metabolic syndrome, including waist circumference, diastolic BP, serum total cholesterol, HDL-cholesterol, triglyceride, glucose levels, and pulse wave velocity (all P<0.05). In contrast, because adiponectin and leptin are adipokines closely linked to lipid metabolism, these markers had a lower correlation with glucose level [8], which is the major component of metabolic syndrome. MFG-E8 also had a significant association with pulse wave velocity in this study, which is in accordance with the results of previous studies, suggesting that MFG-E8 could be a promising diagnostic biomarker in vascular disease [19-22]. It is suggested that MFG-E8 cause an age-associated increase in extracellular matrix adhesion molecules. Likewise, MFG-E8 could be useful not only in the diagnosis of metabolic syndrome but also in predicting its complication risk.
Among the patients without metabolic syndrome at baseline, the subgroup with MFG-E8 level ≥4,745.1 pg/mL had higher metabolic syndrome development rate than the other subgroup (55.4% vs. 34.5%, P=0.003). Considering the relatively short observational period of a median 17 months, this result suggests that subjects with higher MFG-E8 level should be closely monitored for metabolic syndrome development. Cho et al. [23] investigated the predictive potential of adiponectin and visceral adipose tissue in the same cohort as the present study. During the same observational period, the highest incidence of metabolic syndrome was 46.15% in one subgroup, which is lower than that in the present study. In addition, considering the cost and convenience, serum MFG-E8 level seems to be more beneficial than the combination of adiponectin and visceral adipose tissue measurement.
We observed that the higher BMI and MFG-E8 level ≥4,745.1 pg/mL were independent predictors for both diagnosis and further development of metabolic syndrome (all P<0.05). This finding additionally supports the value of serum MFG-E8 as a diagnostic and predictive marker of metabolic syndrome. MFG-E8 is a peripheral membrane glycoprotein that is universally distributed and expressed abundantly in various organs [24]. It has multiple functions including the clearance of apoptotic cells [25], suppression of proinflammatory cytokines [26], arterial remodeling and angiogenesis [20,26]. These various mechanisms play important role in progression of metabolic syndrome [27,28]. To our knowledge, we firstly investigated the correlation of serum MFG-E8 level and metabolic syndrome. Previous studies have shown conflicting results regarding the correlation of MFG-E8 and pathological status in various diseases [29-31]. In this study, a positive association was observed between serum MFG-E8 level and the presence of metabolic syndrome. This may be because the pathogenesis and organ damage of metabolic syndrome are complicated and involve various signaling pathways, in which MFG-E8 may play both proinflammatory and anti-inflammatory roles. Although the exact roles of MFG-E8 in metabolic syndrome have not been clarified in this study, we believe that MFG-E8 mainly contributes to the proinflammatory role in these subjects with mild and early disease status, because subjects with a previous history of angina pectoris, myocardial infarction, stroke, or any revascularization were excluded from this study.
This study has several limitations. First, the sample size was small for sufficient evaluation of the diagnostic performance of a biomarker. Clinical practice-based large, prospective studies are needed to assess its clinical utility on patient outcomes. Second, although this study was designed for a community-based cohort, enrollment was performed at a single center. Therefore, selection bias might be present, and this S-MAS cohort may not represent the general population in the community. Third, because of the short observation period and high rate of follow-up loss, the predictive performance of the biomarker could not be fully evaluated. Fourth, the serum MFG-E8 level was only measured at baseline, which limits its serial assessment with disease progression. Finally, the exact mechanism and role of MFG-E8 in disease development and progression has not been clarified and needs to be investigated in the future.
In conclusion, subjects with higher serum MFG-E8 level have a higher risk for metabolic syndrome and further development, even after adjusting for other important factors. Therefore, MFG-E8 could be an useful biomarker in screening for and serial monitoring of metabolic syndrome.

 PDF Links
 PubReader
 ePub Link
 Full text via DOI
 Full text via PMC
 Download Citation
 Supplement1
 Print
Print