


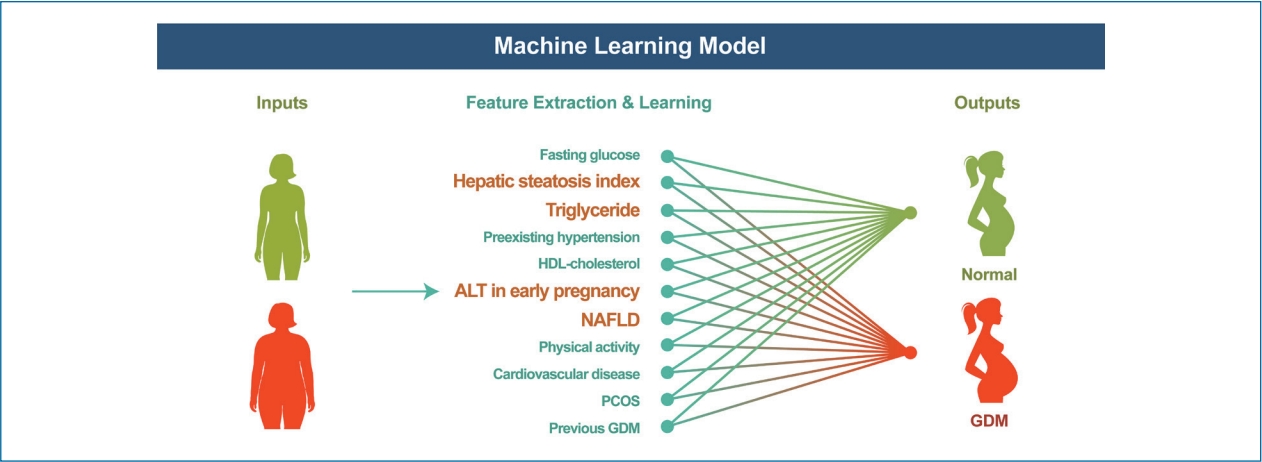
Graphical Abstract
INTRODUCTION
Gestational diabetes mellitus (GDM) complicates 5–10% of all pregnancies, and is associated with increased maternal morbidity and fetal/neonatal complications. In accordance with the rising incidence of obesity and metabolic complications worldwide, the incidence of GDM is also increasing [1]. Therefore, early and accurate prediction of GDM is critical to ensure preventive strategies are effective.
The American College of Obstetricians and Gynecologists (ACOG) has long recommended identifying women at high risk of developing GDM by screening them in early pregnancy using a series of clinical and demographic risk factors [2]. According to these criteria, women with one or more risk factors (including a personal history of GDM or impaired glucose tolerance, a family history of diabetes, obesity, or glucosuria) should be identified and tested for GDM in early pregnancy. In 2017, based on the recommendations of the American Diabetes Association (ADA), the ACOG revised its guidelines to incorporate these new criteria [3,4]. However, these guidelines have not been universally adopted and they have low accuracy [5], which has severely limited our ability to prevent pregnancy-related complications.
Nonalcoholic fatty liver disease (NAFLD) refers to hepatic fat accumulation in the absence of excessive alcoholic consumption. It is a common cause of chronic liver dysfunction [6-11], and recent data suggest that NAFLD is the early hepatic manifestation of metabolic syndrome [12-14]. NAFLD has also been identified as a risk factor for pregnancy complications such as GDM, preeclampsia, and fetal growth abnormalities [15-18]. However, there is a paucity of information regarding whether testing for NAFLD in early pregnancy can inform the prediction model for GDM.
Machine learning algorithms derived from computational learning methodologies are being increasingly used in medical informatics. A few recent studies have included machine learning methods in the development of prediction models for GDM [19-21]. However, these studies had the some limitations, including the following: 1) they used clinical/demographic variables collected in the second trimester, although prediction of GDM in the first trimester is more important in clinical practice; and 2) they mostly developed prediction models using already established clinical variables and did not include NAFLD-associated variables. In addition, the development of a prediction model with a relatively small number of variables is also an important task, since the use of many variables in the prediction model of machine learning may keep the clinician away from a wide acceptance of the developed prediction model.
In the current study, we developed prediction models for GDM with three main goals: 1) to predict the risk of GDM in the first trimester; 2) to use machine learning methodology to select essential variables to be included in the model and to develop the best predictive model; and 3) to evaluate whether the inclusion of NAFLD-associated variables improved the performance of the predictive model.
MATERIALS AND METHODS
Study population
This was a secondary analysis of a prospective cohort study of “Fatty Liver in Pregnancy” (NCT02276144) [5,16,17,22]. In this cohort, women with singleton pregnancies who visited either Incheon Seoul Women’s Hospital or Seoul Metropolitan Government Seoul National University Boramae Medical Center in Seoul, Korea for routine antenatal care in the first trimester were invited to enroll in the study. The enrolled subjects were routinely evaluated for fatty liver by ultrasound, taken for fasting blood at 10–14 weeks, and then followed at delivery. The cohort included all of the enrolled women, including women with fatty liver and those without. The current analysis included enrolled women who delivered between June 2015 and April 2020. The study was approved by the Institutional Review Board of Seoul Metropolitan Government Seoul National University Boramae Medical Center and the Public Institutional Review Board designated by the Ministry of Health and Welfare of Korea (No. 1308-116-518). Each participant provided informed written consent, and the study was conducted in accordance with the ethical guidelines of the Declaration of Helsinki. All authors had access to the study data, and they reviewed and approved the final version of the manuscript before submission.
Data collection
At the time of enrollment, patients with chronic liver diseases, such as hepatitis, primary biliary or sclerosing cholangitis, hemochromatosis, and Wilson disease, were not invited to enroll in the study cohort. After enrollment, basic clinical and demographic factors, including medical and family history, were retrieved using a questionnaire. Alcohol consumption was self-reported using the validated cut-annoyed-guilty-eye questionnaire [23] to exclude alcoholic fatty liver. Patients with pre-GDM, incomplete records for classical risk factors for GDM, previable birth before 24 weeks, or incomplete follow-up were also excluded from the current study. The laboratory results that were routinely measured in early pregnancy during antenatal care, such as complete blood count, serology for syphilis or hepatitis, and the presence or absence of glycosuria, were also retrieved by reviewing the medical records of the patients.
During the routine antenatal visit at 10–14 weeks of gestation, fasting blood samples were collected and stored for subsequent analysis. At the same visit, liver ultrasound was performed to detect NAFLD. Hepatic steatosis was assessed using a semi-quantitative grading system (grades 0–3), and NAFLD was defined as hepatic steatosis grades 1–3 [24,25]. The hepatic steatosis index (HSI) was calculated using the following equation: HSI = 8 × alanine aminotransferase (ALT) / aspartate aminotransferase + body mass index (BMI) + 2 (if type 2 diabetes) + 2 (if female) [26]. The remaining information regarding antenatal care and pregnancy outcomes were extracted from the patient’s medical charts by trained researchers.
Diagnosis of GDM
It is a routine practice in the participating hospitals to diagnose GDM using a two-stage approach. First, all patients were screened at 24–28 weeks of gestation using a 50-g oral glucose tolerance test (OGTT) [27]. In screen-positive cases (defined as ≥140 mg/dL), patients underwent a 100-g 3-hour OGTT (Supplementary Fig. 1). A diagnosis of GDM was made in patients with two or more blood glucose levels higher than the established cut-off values (≥95 mg/dL fasting, ≥180 mg/dL at 1 hour, ≥155 mg/dL at 2 hours, and/or ≥140 mg/dL at 3 hours) [28].
Definition of high-risk women using the old and new ACOG criteria
GDM risk factors used in the original ACOG guidelines were derived from the 4th International Workshop Conference on GDM in 1998, which defined high-risk women as those with at least one of the following risk factors: strong family history of diabetes, obesity, previous GDM history, impaired glucose tolerance, or glucosuria (Supplementary Fig. 2) [2]. GDM risk factors in the most recent 2018 ACOG guidelines [4] were derived from the recommendations of the ADA, which defined high-risk women as those who are overweight or obese with one of the following risk factors: physical inactivity, family history of type 2 diabetes, high-risk race or ethnicity, previous delivery of a macrosomic infant, previous GDM history, preexisting hypertension, low high-density lipoprotein (HDL) or high triglyceride, personal history of polycystic ovarian syndrome or cardiovascular disease, and/or other conditions such as severe obesity [3,4]. According to the World Health Organization, the categories of overweight, obesity, and severe obesity for Asian population are defined as BMI of 23–25 kg/m2, 25–30 kg/m2, and >30 kg/m2, respectively [29,30].
Statistical analysis
Clinical/demographic variables collected before 14 weeks were used to develop prediction models for GDM in four settings (settings 1, 2, 3, and 4). To limit the number of variables and identify those that are most important, a stepwise variable selection methodology was used to define one additional model [Setting 5]. The variables used in each setting are summarized in Supplementary Table 1. In brief: setting 1, conventional risk factors from the 4th International ADA Workshop; setting 2, setting 1 + revised risk factors from the ADA; setting 3, setting 2 + additional clinical variables; setting 4, setting 3 + additional variables associated with NAFLD; setting 5, using only 11 selected important variables.
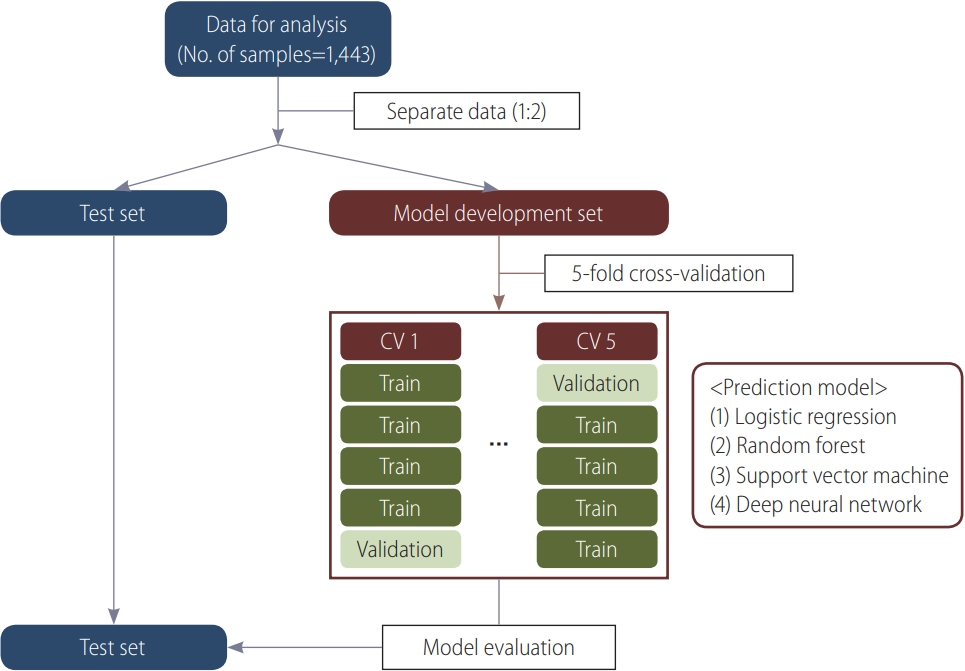
To avoid overfitting, the study population was randomly divided into a model development and a test dataset with a 2:1 ratio (Fig. 1) in a stratified manner, taking into account the ratio of the GDM group and the non-GDM group. Prediction models were developed using the model development dataset. To identify important predictors for GDM, the area under the receiver operating characteristic curve (AUC)-based stepwise selection was performed via 5-fold cross validation on the model development set [31]. Variables with the highest mean validation AUCs were selected at each step of the stepwise selection process. To construct predictive models, we considered four machine learning models: logistic regression (LR), random forest (RF) [32], support vector machine (SVM) [33], and deep neural network (DNN). For each model based on RF, SVM, and DNN, we tuned the hyperparameters to select the optimal combination with the highest mean AUC using 5-fold cross validation. Then, the final prediction model was evaluated using the test dataset.
To evaluate the predictive power for each setting more systematically and to avoid data split-dependent results, we repeated the data split process into a model development set and a test set a total of 10 times, and then compared the mean AUC of each model. All analyses were performed using R (version 3.6.1).
RESULTS
Subject population
A total of 1,709 women were enrolled in the original cohort. After excluding women with pre-GDM (n=27), incomplete records for classical risk factors for GDM (n=147), previable birth before 24 weeks (n=11), or incomplete follow-up (n=81), 1,443 women were included in the current analysis (Supplementary Fig. 3). Among them, 86 women (6.0%) were subsequently diagnosed with GDM. Table 1 presents the baseline clinical/demographic characteristics and pregnancy outcomes according to GDM status. Women who subsequently developed GDM were more likely to have a higher pre-pregnancy BMI and waist circumference compared to those who did not. With regard to pregnancy outcomes, women with GDM delivered at an earlier gestational age (P=0.033) and, despite an earlier gestational age, their neonates were more likely to be large-for-gestational age, although the difference was not statistically significant (P=0.053).
Risk stratification according to conventional guidelines
Table 2 summarizes the categorization of women at high risk for developing GDM according to the 1998 [2] and 2018 criteria [4]. Among those who developed GDM (n=86), the old criteria identified 59.3% (51/86) of women to be at high risk, and the frequency of all variables included was indeed higher in women who developed GDM. The new criteria identified only 41.9% (36/86) of women as high-risk, and the current analysis showed that some of the risk factors included in this ACOG-recommended model (physical inactivity, previous delivery of a macrosomic infant, low HDL, and a personal history of polycystic ovarian syndrome or cardiovascular disease) did not differ between the two groups in the cohort.
Selection of important variables
Among the variables retrieved, we selected important variables for the early prediction of GDM using AUC-based stepwise selection with 5-fold cross validation. The top 11 variables were fasting glucose, HSI, triglyceride level, HDL level, ALT in early pregnancy, preexisting hypertension, cardiovascular disease, polycystic ovarian syndrome, NAFLD, previous GDM history, and physical inactivity.
Evaluation of the predictive modeling
Supplementary Table 2 compares the baseline clinical characteristics of the model development and test dataset. There were no differences in the characteristics between the model development and test dataset.
The prediction model for GDM was developed using LR, RF, SVM, and DNN for settings 1–5. The AUC was used as an evaluative measure. The results are presented in Table 3. Among settings 1–4, the test AUC was the highest in setting 4 (highest AUC in setting 1–3, 0.617 by LR, 0.643 by RF, 0.697 by SVM, and 0.609 by DNN; AUC in setting 4, 0.740 by LR, 0.781 by RF, 0.756 by SVM, and 0.745 by DNN; Table 3), indicating that the addition of NAFLD-associated variables significantly improved performance of the prediction model. Then, we compared the test AUC of the models between setting 5 and settings 1–4. The test AUC of the developed prediction model using the top 11 variables [Setting 5] was similar to that of the model using setting 4, with the highest test AUC from the model developed by SVM (0.719 by LR, 0.763 by RF, 0.819 by SVM, and 0.777 by DNN; Table 3). Using SVM, the sensitivity and specificity in the test set were 70.8% and 86.6%, respectively, in setting 5 (Supplementary Fig. 4).
Figure 2 shows the receiver operating characteristic curves of the best prediction model in each setting. Prediction models from settings 4 and 5 had higher AUCs compared to those from settings 1–3. The old criteria of ACOG had a sensitivity of 59.3% and specificity of 71.5%, and the new criteria of ACOG had a sensitivity of 41.9% and specificity of 85.9% for the prediction of GDM, as previously shown in Table 2.
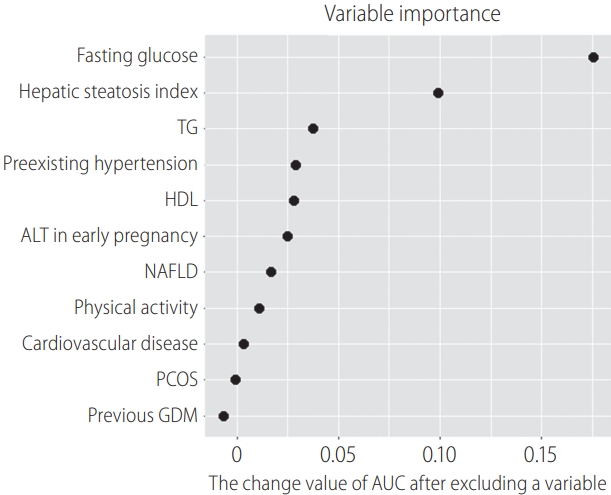
We further identified which variable contributed the most to the prediction result, focusing on the SVM model that had the highest test AUC for setting 5. To this end, the 11 predictors used in setting 5 were systematically excluded, and the effect on the prediction result was thus evaluated. The more important the variable, the more the AUC value was expected to decrease once the variable was excluded. Fasting glucose had the highest effect, followed by HSI (Fig. 3).
To evaluate the predictive power for each setting more systematically by avoiding data split-dependent results, we repeated the data split process into a model development set and a test set 10 times and compared the mean AUC of each model (Supplementary Fig. 5). These data confirmed that the predictive model with the top 11 variables had the highest predictive performance, regardless of the data split. We compared the predictive power of the models in setting 5 with that in settings 1–4 using the Wilcoxon rank-sum test (Supplementary Table 3). This analysis confirmed that the predictive performance of setting 5 was significantly higher than that of settings 1–3 and similar to that of setting 4.
DISCUSSION
This study demonstrated that the addition of NAFLD-associated variables significantly improved the prediction model performance for GDM in early pregnancy. In addition, the model with selected important variables [Setting 5] showed similar predictive power as the model derived from all clinical variables, including NAFLD-associated variables [Setting 4].
Overall, we suggest a final model with 11 important variables [Setting 5]. The model showed the highest predictive power for the AUC among the five settings. The predictive performance of the final model was much higher than that of settings 1–3 with a small number of variables. Setting 5 also showed similar predictive performance as setting 4, which used all available clinical variables and NAFLD-associated variables. We confirmed that these trends were not data-split-dependent results through statistical analysis. Based on the ultimate goal of developing a parsimonious model with high predictive power, we suggest a prediction model in setting 5 as the final model.
NAFLD is strongly associated with the development of type 2 diabetes, hypertension, metabolic syndrome, and other cardiovascular complications [12-14,34]. Several recent studies have reported that NAFLD is also a risk factor for GDM, which is consistent with the observation that pregnancy can unmask subclinical metabolic disorders in patients at risk of metabolic diseases later in life [15,16,35,36]. The molecular mechanisms underlying the relationship between NAFLD and metabolic complications in later life appear to be related to hepatic insulin resistance and lipotoxicity in the setting of excessive free fatty acids, hepatokines, or cytokines, and peripheral adiposity, which leads to oxidative stress, activation of proinflammatory cytokines, and fibrosis [16,37-39].
In previous studies, NAFLD identified in early pregnancy was shown to increase the risk of GDM, with the odds ratios ranging from 2.2 to 6.5 [40]. Moreover, several biomarkers related to NAFLD, such as ALT, triglycerides (TG), and gamma-glutamyl transferase, have been independently reported as risk factors for GDM [19,41,42]. However, whether we should evaluate NAFLD-associated factors in early pregnancy for GDM prediction has not been evaluated to date. In this study, we showed that the addition of NAFLD-associated variables [Setting 4] significantly improved the prediction model performance for GDM by both traditional machine learning algorithms and DNN. In addition, NAFLD, HSI, TG, and ALT in the first trimester were identified among the top 11 important selected variables for GDM prediction [Setting 5].
Several recent studies have used machine learning algorithms to develop prediction models for GDM, although most of the included clinical variables were retrieved in the second trimester. Ye et al. [19] failed to show better performance of machine learning algorithms for GDM prediction compared to traditional LR analysis, although other studies have reported improved performance. For example, Xiong et al. [20] reported higher accuracy with gradient boosting and SVM with clinical variables up to 19 weeks; however, they used a case-control study design, which did not accurately represent the real-world context in which we see GDM. Artzi et al. [21] used real-world data from retrospective electronic health records retrieved up to 20 weeks of gestation and developed a prediction model for GDM with a gradient boosting model, with variable success. Theoretically, machine learning should improve the performance of predictive models due to its ability to learn from non-linear and complex relationships among risk factors in realworld datasets [43]. In addition, machine learning can also identify important variables that may not have been identified in other analyses. In the current study, we showed that the machine learning algorithm performed better than the conventional LR analysis, and identified important variables in the prediction model.
Interventions such as lifestyle modification, weight gain optimization, and regular exercise starting early in pregnancy may prevent some cases of GDM [44-46]. As such, there is an increasing demand for early prediction of GDM. Both the ACOG and ADA have developed guidelines to identify high-risk women in early pregnancy [2-4]. However, predictive modeling using both original and revised criteria has poor accuracy in identifying women at risk, and there is a high demand for a more accurate model in early pregnancy [5]. In the current study, we developed a prediction model using clinical/demographic variables collected prior to 14 weeks, enabling accurate prediction of GDM in the first trimester. After acute prediction of GDM in early pregnancy, we can modify our screening strategies for GDM or intervention in high-risk women with lifestyle modification or regular exercise.
To establish a prediction model that could be implemented more easily in routine clinical practice, we tried to limit the number of variables in this study [47]. The model with the 11 most important variables [Setting 5] showed similar or better performances than settings 1–4 (Supplementary Fig. 1), making this probably the most useful of the five models. However, whether the suggested model can be used in clinical practice requires further larger randomized studies.
The strengths of this study are that it used data that were collected prospectively, and included data on both NAFLD and HSI. In the current study, NAFLD was defined by liver ultrasound and not by histologic examination, although sonographic evaluation of the fatty liver is subjective and may not be able to detect small amounts of fat accumulation [48]. However, histological confirmation of the liver was not possible in asymptomatic pregnant women. Instead, we evaluated HSI, a metric derived from laboratory results, which is a more objective marker of hepatic dysfunction than ultrasound alone [49]. One of the limitations of the current study is that all study subjects were of Korean ethnicity. Whether these findings can be generalized to other racial/ethnic groups is not clear. In addition, we enrolled pregnant women only when they denied a history of chronic liver disease and agreed to enroll in a prospective cohort study. Given that there could be differences between women who agreed to participate in the study and those who refused, there is a possibility of selection bias at enrollment. Moreover, we did not include a cost-effective analysis. For this prediction model, participants should undergo further examinations, such as liver ultrasound and laboratory tests, at 10–14 weeks in addition to routine laboratory tests in early pregnancy. Whether the suggested model with additional evaluation can be used in practice also requires a cost-effective analysis. In addition, we did not use an external validation dataset to evaluate the prediction model. However, the evaluation of liver ultrasound and sampling of fasting blood in early pregnancy has not been a routine practice in obstetrics, and we failed to find another pregnancy population dataset for external validation that had similar data regarding NAFLD as ours. Instead, 1) we split the study population into a development and test dataset before performing any analysis, and showed the performance of the final prediction model in a test dataset; and 2) we repeated this data split process 10 times to avoid split-dependent results, and showed that the predictive model with the top 11 variables had the highest predictive performance regardless of the data split. Nevertheless, the study population was based on a single cohort. Further studies with external datasets are needed to confirm the usefulness of the proposed prediction model. Lastly, we could not evaluate the influence of mild or significant fibrosis in the liver, although fibrosis itself might be more problematic in terms of metabolic outcomes. Moreover, fibrosis has been reported to be associated with adverse outcomes in non-pregnant patients with NAFLD [50].
In conclusion, we developed early prediction models for GDM using machine learning, which performed better than the models using only clinical/demographic variables recognized by the ACOG and ADA. The inclusion of NAFLD-associated variables significantly improved the performance of early GDM prediction. However, further evaluation in large prospective studies is needed before these models can be incorporated into routine practice.

 PDF Links
 PubReader
 ePub Link
 Full text via DOI
 Full text via PMC
 Download Citation
 Supplement1
 Print
Print