Auranofin attenuates hepatic steatosis and fibrosis in nonalcoholic fatty liver disease via NRF2 and NF-κB signaling pathways
Article information

Abstract
Background/Aims
We aim to evaluate the effects of auranofin, a known antioxidant, on hepatic steatosis, inflammation, and fibrosis, contributing to non-alcoholic steatohepatitis (NASH) development in vivo and in vitro.
Methods
Transcriptome analysis of LX-2 cells was that expression patterns of genes changed by auranofin, and their related pathways were estimated. We used the gene set enrichment analysis (GSEA) program to determine the pathway involved in overall genetic change. In vitro, LX-2 and HepG2 cells were treated with transforming growth factor (TGF)-β1 and palmitic acid (PA), respectively, and the antifibrotic and antiadipogenic effect function of auranofin was evaluated.
Results
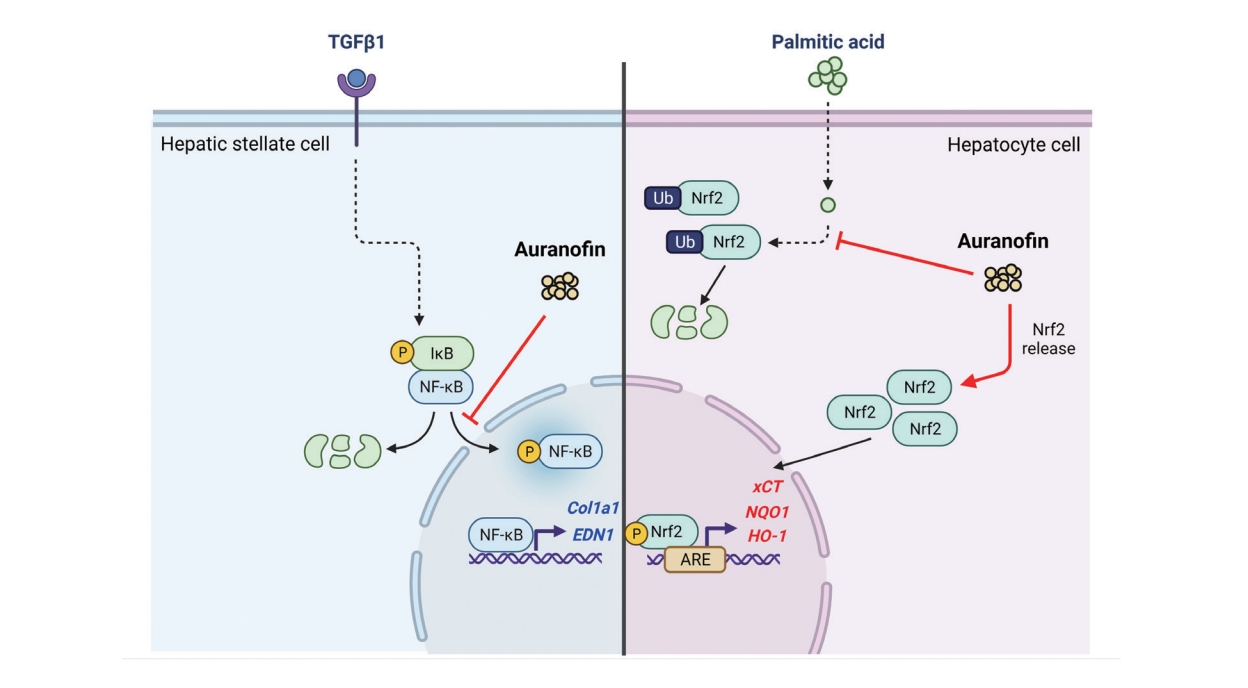
Transcriptome analysis revealed that auranofin decreased the expression of 15 genes, including thrombospondin 1, endothelin 1 (ET-1), fibronectin 1, and LOX. The molecular functions of these genes are involved in collagen binding. GSEA of the overall gene expression pattern revealed that many genes increased in the reactive oxygen species pathway and decreased in the inflammatory response. Auranofin decreased nuclear factor kappa B (NF-κB) and IκBα in TGF-β1-induced LX-2 cells, thereby reducing ET-1 and fibrosis. Furthermore, increased pNRF2 in PA-induced HepG2 cells led to increased antioxidant marker expression and decreased lipid accumulation. In the bile duct ligation model mice, auranofin reduced the fibrosis area and increased the survival rate. Auranofin reduced liver fibrosis and lipid accumulation in NASH model mice fed on a Western diet.
Conclusions
Auranofin inhibits lipogenesis and fibrosis formation and is a proposed candidate for NASH treatment.
Graphical Abstract
INTRODUCTION
Nonalcoholic fatty liver disease (NAFLD) is the most common chronic liver disease worldwide. It is present in up to 30% of the adult population and 70–80% of individuals with obesity or diabetes [1]. Reports show that NAFLD exacerbates chronic inflammation and oxidative stress, causing hepatic dysfunction [2]. However, increasing evidence indicates that NAFLD is a multi-system disease involving multiple mechanisms, such as insulin resistance, oxidative stress, mitochondrial insufficiency, endoplasmic reticulum stress, and apoptosis [3]. NAFLD progresses into non-alcoholic steatohepatitis (NASH) due to lipid accumulation in hepatocytes. NASH causes lipid peroxidation and accumulation of reactive oxygen species (ROS) and proinflammatory cytokines in the liver, leading to hepatic injury and inflammation [4]. In rare cases, NAFLD can advance into progressive hepatic inflammation accompanied by apoptosis and fibrosis affecting stellate cells and even into cirrhosis or hepatocellular carcinoma [5]. The pathogenesis of NAFLD is believed to be centered on the interaction of fibrogenic cells with activated hepatic stellate cells. Presently, no effective protective or therapeutic modality against steatohepatitis or hepatocellular carcinoma resulting from NAFLD is available [6]. Thus, it is important to understand the intricate mechanisms underlying NAFLD progression [7,8].
Oxidative stress and inflammation are the most important causes of liver diseases. Unregulated free radicals and/or ROS production can damage important biomolecules and cells and upregulate proinflammatory genes during liver injuries [9,10]. Antioxidant and anti-inflammatory therapy has been beneficial in liver diseases [10-12].
Nuclear erythroid 2-related factor 2 (NRF2) is a transcription factor of the basic leucine zipper family [13]. It plays a significant role in adaptive responses to oxidative stress by regulating the expression of antioxidant, anti-inflammatory, and cytoprotective genes through interaction with the antioxidant response element (ARE) sequences of such genes [14,15]. Studies show that dysregulation of NRF2 activity correlates with the development of chronic inflammatory diseases [16-19]. Reports have shown the protective effects of the NRF2 signaling pathway in multiple disease models and implicated this transcription factor in various liver diseases, including acute hepatoxicity, NAFLD, NASH, viral hepatitis, and liver fibrosis [20-23]. Under acute and chronic oxidative stress and inflammatory conditions, NRF2 is activated and prevents oxidative and inflammatory diseases by modulating the expression of cytoprotective proteins and enzymes, whereby ROS levels, inflammation, and cell death decrease [15,24].
Auranofin is a gold-based compound used to treat a wide range of conditions, such as rheumatoid arthritis, for a long time. Recent studies have shown that this compound is a TrxR inhibitor, which exerts immunosuppressive activity by inhibiting immune cell activation [25-27]. Auranofin is a potent inducer of heme oxygenase-1 and can also inhibit the activation of signal transducer and activator of transcription 3, nuclear factor kappa B (NF-κB), and toll-like receptor 4, all of which can be stimulated by interleukin-6 or lipopolysaccharide. Moreover, auranofin possesses the antioxidant property of enhancing the activation of NRF2 [28,29]. However, no study has assessed the beneficial effects of auranofin on NAFLD. Therefore, this study aimed to determine the effect of auranofin on hepatic steatosis and inflammation, which contribute to NAFLD development, both in vivo and in vitro.
MATERIALS AND METHODS
BDL ligation-induced fibrosis model & western diet-induced NASH model
C57BL/6N mice (8 weeks old, male) were obtained from OrientBio (Seongnam, Korea). The mice were maintained in a temperature-controlled (23°C±2°C) and specific-pathogen-free room under a 12 hours light/dark cycle. For the BDL ligation group, a midline incision was made. BDL was identified and ligated at two sites without cutting the duct. The vehicle group also underwent a similar procedure without BDL ligation. After 21 days, the animals were euthanized, and blood and serum samples were collected. The animals were randomly divided into control and auranofin groups for auranofin-induced fibrosis. Fibrosis was induced using escalating dose regime of auranofin (special feed containing 1 mg, 3 mg, and 10 mg of auranofin), as described previously. For the WD diet group, a liver biopsy was performed at 17 weeks to randomize the stratification and reduce the error between mice. Auranofin used special feed containing 3 mg/kg and 10 mg/kg. All experimental procedures were approved by The Hanyang Institutional Animal Care and Use Committee (HY-IACUC-20-0039). Blood and liver samples were collected for further analysis.
LX-2 cell culture and RNA sequencing
For RNA and protein extraction, LX-2 cells (3×10⁵) were seeded on a 6-well plate using Dulbecco’s modified Eagle’s medium (DMEM) containing 2% fetal bovine serum (FBS) and 1% penicillin-streptomycin (P/S). After 24 hours, the media was removed, followed by treatment with transforming growth factor (TGF)-β (5 ng/mL; R&D Systems, Minneapolis, MN, USA). After 24 hours, the RNA was isolated using the RNeasy mini kit (Qiagen, Hilden, Germany) according to the manufacturer’s instructions. The Next-generation RNA sequence results were analyzed using Multi Experiment Viewer (Mev; http:/www.tm4.org). The proteins were extracted using RIPA lysis buffer (Thermo Fisher Scientific, Rockford, IL, USA) supplemented with protease and phosphatase inhibitors, following the manufacturer’s instructions.
Quantitative real-time polymerase chain reaction (qRT-PCR)
Total RNA was extracted from the liver sample using TRIzol reagent (Invitrogen, Carlsbad, CA, USA), following the manufacturer’s instructions. RNA concentrations were measured using a Nanodrop ND-2000 spectrophotometer (Thermo Fisher Scientific Inc., Waltham, MA, USA), and the purity was determined by measuring the A260/A280 ratio. First-strand cDNA was synthesized using the PrimeScript 1st Strand cDNA Synthesis Kit (Takara Bio, Shiga, Japan). qRT-PCR was performed using the LightCycler 480 SYBR Green I Master Mix (Roche Diagnostics, Indianapolis, IN, USA) and analyzed on a LightCycler 480 II System (Roche Diagnostics). qPCR amplification was performed with incubation for 5 minutes at 95°C, followed by 45 cycles of 10 seconds at 95°C, 10 seconds at 60°C, 10 seconds at 72°C, and a final dissociation step at 65°C for 15 seconds. The crossing point of each sample was automatically determined using the LightCycler, and the relative change ratio was determined using the ratio of mRNA for the selected gene and glyceraldehyde-3-phosphate dehydrogenase (GAPDH). PCR transcript levels were normalized against those of GAPDH.
Western blot analysis
For western blot analysis, snap-frozen liver sample samples were washed with normal saline. The tissues were homogenized using PRO-PREP Protein Extraction Solution (iNtRON Biotechnology, Burlington, MA, USA). The protein extracts were quantified, and 25 μg of protein was transferred to a sample buffer, separated by 10% sodium dodecyl sulfate-polyacrylamide gel electrophoresis, and transferred to PVDF membranes (Immobilon-P; Millipore, Billerica, MA, USA). After blocking with 5% BSA solution for 1 hour, the membranes were incubated with primary antibodies against α-SMA, TGF-β, LOX, collagen1, FN-1, HO-1, NRF2, pNRF2, PARP1 (Abcam, Cambridge, MA, USA), and β-actin (Santa Cruz Biotechnology, Santa Cruz, CA, USA), followed by incubation with secondary antibodies. The bands were visualized with West-Q Chemiluminescent Substrate Kit Plus (GenDEPOT, Katy, TX, USA). The results were obtained with an image analyzer (Image lab 3.0; Bio-Rad, Hercules, CA, USA) and were quantified.
Immunofluorescence
LX-2 cells (1×10⁴) were seeded on a 24-well plate using DMEM containing 2% FBS and 1% P/S for immunofluorescence. After 24 hours, the media was removed, and cells were washed with Dulbecco’s phosphate buffered saline (DPBS), followed by treatment with TGF-β (10 ng/mL). After 24 hours treatment, LX-2 cells were fixed using 4% paraformaldehyde; cells were washed twice with DPBS, permeabilized using 0.1% Triton X-100 in PBS, and blocked with 10% normal goat serum and 1% BSA. NF-kB (Cell signaling, Danvers, MA, USA), IkBα, collagen1, NRF2, and phosphor-NRF2 (Abcam) primary and goat anti-Rabbit IgG H&L (Alexa Fluor 488) (Abcam, Cambridge, UK) and goat anti-mice IgG H&L (Alexa Fluor 594; Thermo Fisher Scientific) secondary antibodies were used.
Dual-Luciferase reporter assay
HepG2 ARE transfected with pGL4.37[luc2P/ARE/Hygromycin] plasmid cells were selected for resistant colonies by hygromycin treatment and checked for the expression of AREs increased by auranofin treatment. Measurements were made using Victor3 (PerkinElmer, Waltham, MA, USA).
Nile red staining analysis
HepG2 cell was seeded at 1×10⁴/well in 8 wells. Oleic acid (300 μM) and auranofin 100 nM and 500 nM were treated for 24 hours. Cells were washed with DPBS and fixed at room temperature for 15 minutes at 4% paraformaldehyde. After the wash, Nile red solution (1 μg/mL) was stained at room temperature for 30 minutes in the dark. The mount was a mounting medium with DAPI (VECTASHIEDLD® Antifade Mounting Medium with DAPI, H-1200; Vector laboratory, Newark, CA, USA). Nile red staining was visualized with a fluorescence microscope (Leica DMI4000B; Leica, Wetzlar, Germany).
Immunohistochemical analysis
The liver samples were fixed in 4% formaldehyde for 2 days and embedded in paraffin. Sections of blocks were cut at 4 μm thickness using a microtome (Leica RM2125; Leica Biosystems, Heidelberg, Germany). For hematoxylin and eosin (H&E) and Sirius red staining, the sections were deparaffinized, rehydrated, and washed with distilled water to allow penetration of the hydrophilic solution. After tissue watering, H&E staining was performed to observe histological changes in the liver sample. For immunohistochemistry analysis, the sections were deparaffinized, rehydrated, cooked in antigen retrieval solution (Abcam), and dipped in 3% hydrogen peroxide solution for 30 minutes. Specific primary antibodies were applied for 1 hour at room temperature, and the sections were incubated with secondary antibodies for 40 minutes. Immunoreactions were visualized with 3,3’-diaminobenzidine staining, and the sections were counterstained with Mayer’s hematoxylin. All data were normalized against the equivalent data in mice fed chow (control). Immunostaining was quantified using ImageJ software (ImageJ software, 1.52a; National Institutes of Health, Bethesda, MD, USA).
Statistical analysis
The values were expressed as the mean±standard error of mean and obtained from three independent replicates. Statistical analyses were performed using the GraphPad Prism 7 (GraphPad Software, San Diego, CA, USA). One-way analysis of variance and independent t-tests were performed to compare the means of different values. A P-value of less than 0.05 was considered statistically significant.
RESULTS
Comparison of gene expression patterns by auranofin treatment in TGF-β1-induced LX-2 cells
Hepatic stellate cells and LX-2 cells were treated with TGF-β1 and auranofin to evaluate the effect of auranofin on the liver, followed by transcriptome analysis. Fifteen genes were identified with contrasting regulations of TGF-β1/Cont, TGF-β1+AR50/Cont, and TGF-β1+AR50/TGF-β1 (Fig. 1A). Scatter plots of TGF-β1+AR50/TGF-β1 were performed to identify genes regulated by auranofin treatment. As a result, genes that were increased in the TGF-β1 alone treatment group but decreased more than 2-fold in TGF-β1+AR50 were additionally identified (Fig. 1B). The correlation of these genes was investigated using the string-data base tool. As a result, blood vessel morphogenesis (red), collagen binding (blue) in the biological process, and endoplasmic reticulum lumen (green) in the cellular component showed a significantly lower false discovery rate (Fig. 1C, D). We conducted a gene set enrichment analysis (GSEA) to determine the pathways involved in the overall genetic change. The genes increased from TGF-β1+AR50 compared to TGF-β1 showed many genes involved in the ROS pathway and P53 pathway. However, the genes decreased from TGF-β1+AR50 compared to TGF-β1 showed many genes involved in the epithelial-mesenchymal transition and inflammatory response (Fig. 1E, F). And showed heatmaps of genes involved in the ROS pathway and inflammatory response (Fig. 1G).
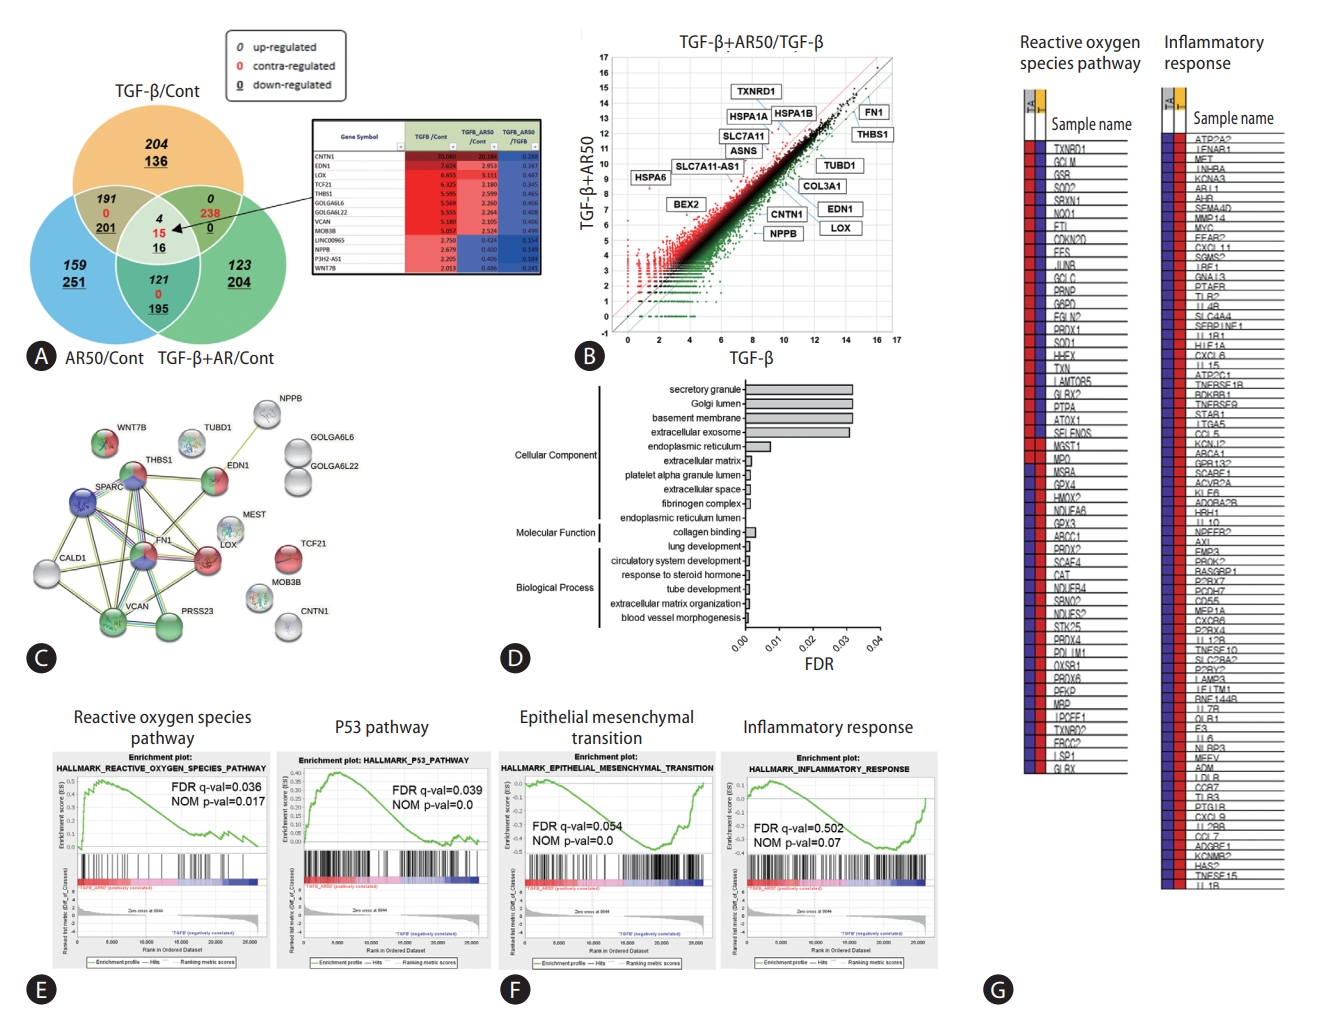
Transcriptome analysis of auranofin in LX-2 cells. (A) Venn diagram with contrasting regulation of TGF-β1/Cont, TGF-β1+AR50/Cont, TGF-β1+AR50/TGF-β1 from transcriptome analysis. Genes regulated by auranofin treatment were expressed as a (B) scatter plot of TGF-β1+AR50/TGF-β1. Gene correlation was performed using a (C, D) string database tool. (E, F) GSEA analysis results of transcriptomes and their (G) heatmaps. TGF, transforming growth factor; FDR, false discovery rate; NOM, normalized enrichment score.
Auranofin reduces fibrogenesis in LX-2 cells
Transcriptome analysis showed that fibrogenesis markers, thrombospondin 1 (THBS1), fibronectin 1 (FN-1), and endothelin 1 (ET-1) were reduced by auranofin (Fig. 1A-D). Therefore, we investigated whether auranofin inhibits the activation of LX-2 cells. Auranofin decreased TGF-β1, collagen type 1 alpha 1 chain (COL1A1), and platelet-derived growth factor A mRNA levels in TGF-β1-induced cells (Fig. 2A). Protein expression of FN-1 and COL1A1 was also significantly decreased, but LOX and TGF-β1 were only significant at auranofin 30 nM (Fig. 2B, C). Auranofin inhibited TGF-β1-induced cell proliferation and activation in LX-2 cells (Fig. 2D).
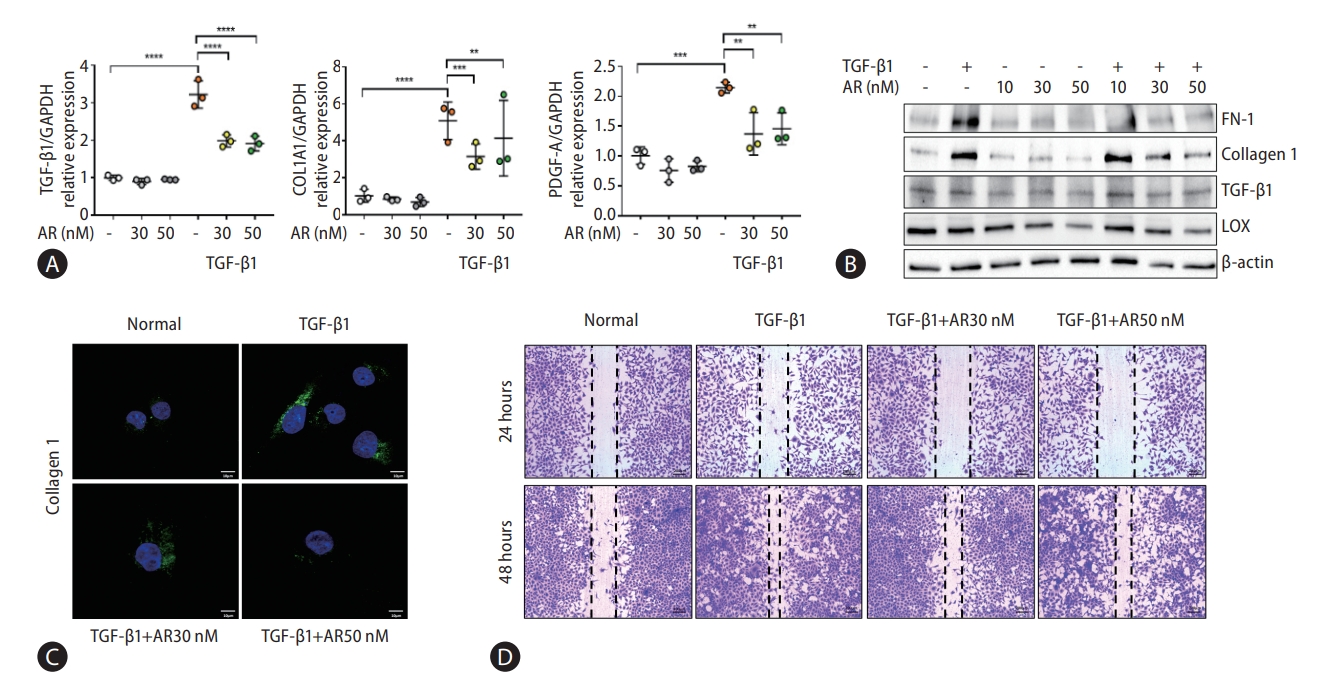
Auranofin reduces the fibrosis marker and cell proliferation of TGF-β1 induced LX-2 cells. (A) Quantitative comparison of fibrosis marker mRNA levels and (B) protein expression. Data shown in bar diagrams as mean±standard error of mean from three independent experiments. (C) Immunofluorescence staining of LX-2 cells with collagen1 (green) was shown as a confocal image (×630). (D) Wound healing assay using auranofin on TGF-β1-induced LX-2 cells (×100). TGF, transforming growth factor; GAPDH, glyceraldehyde-3-phosphate dehydrogenase; COL1A1, collagen type 1 alpha 1 chain; PDGF-A, platelet-derived growth factor A. *P<0.05. **P<0.01. ***P<0.001. ****P<0.0001.
Auranofin reduces NF-κB and IκBα in LX-2 cells
Transcript analysis showed that ET-1, a target gene of NF-κB, was significantly reduced by auranofin. Therefore, we evaluated the effect of auranofin on NF-κB and IκBα. Auranofin decreased overall NF-κB and IκB and inhibited nuclear pNF-κB expression (Fig. 3). This finding suggests that auranofin suppresses the expression of ET-1 by reducing overall NF-κB and IkBα expression and simultaneously inhibiting the transnuclear movement of pNF-κB.
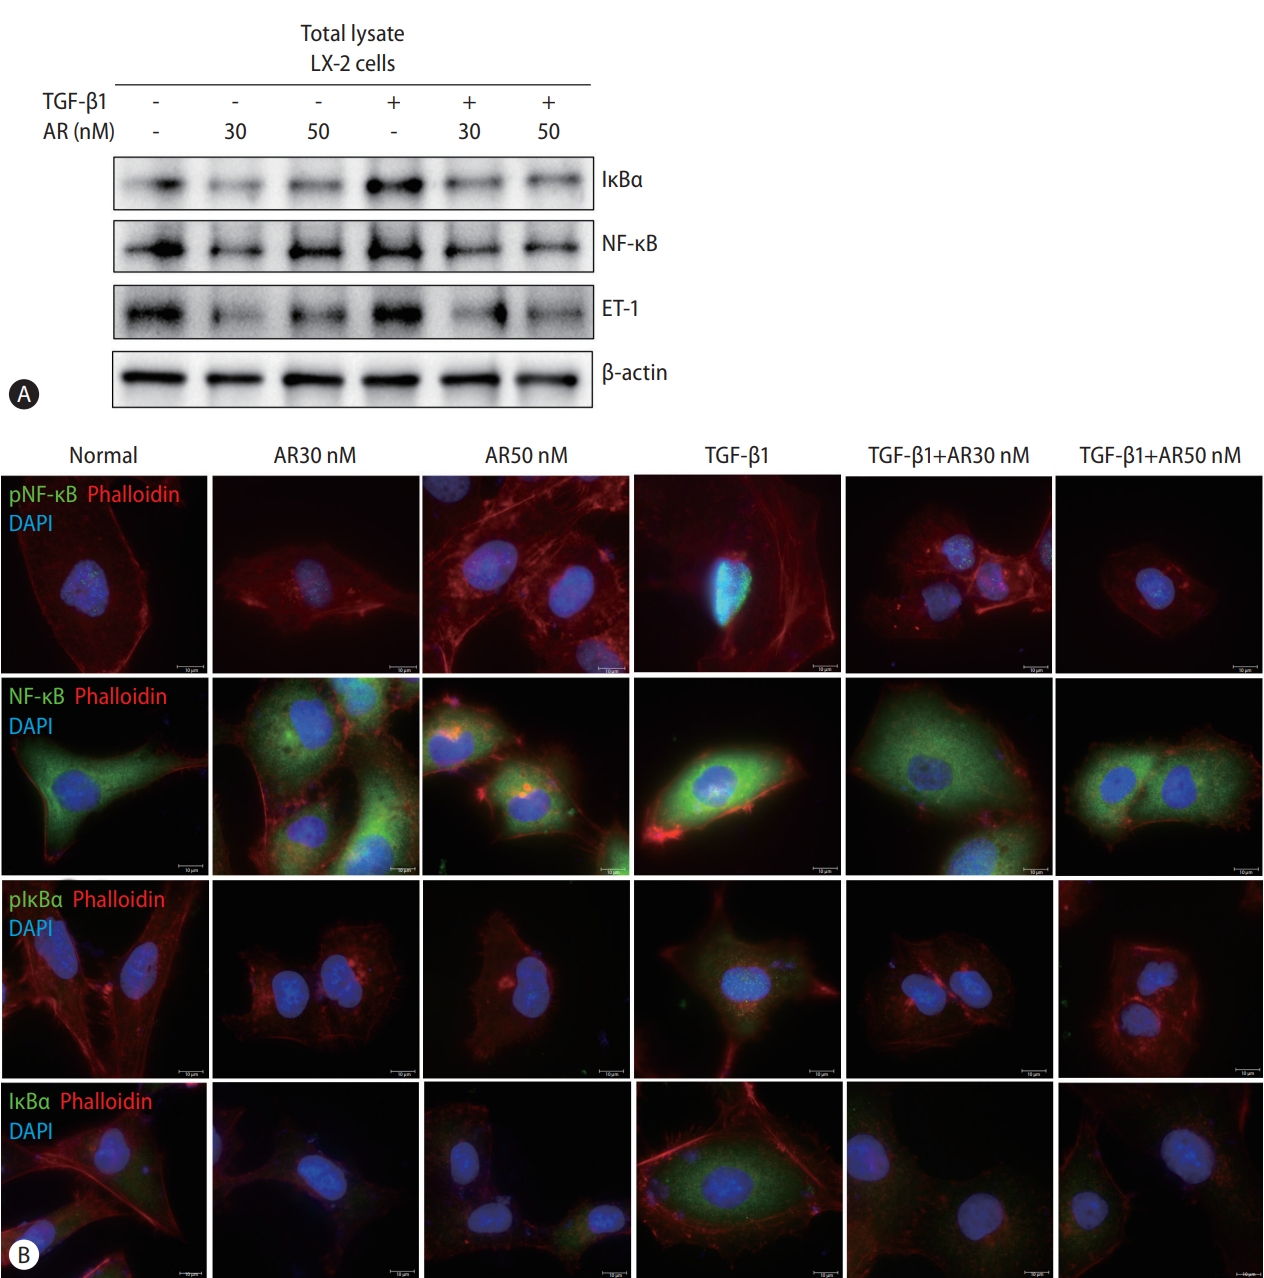
Auranofin decreases NF-κB and IκBα of TGF-β1 induced LX-2 cells. Comparison of protein expression using (A) Western blot and (B) immunofluorescence staining of NF-κB, IκBα, and ET-1 by auranofin in TGF-β1-induced LX-2 cells (×630). TGF, transforming growth factor; NF-κB, nuclear factor kappa B; ET-1, endothelin 1; DAPI, 4’,6-diamidino-2-phenylindole.
Auranofin attenuates liver fibrosis in the bile duct ligation (BDL) model
The antifibrotic effect of auranofin was evaluated in mice that underwent BDL for 21 days, and the survival rate was checked every 7 days (Fig. 4A). The BDL model mice showed that the bile duct was not unraveled until day 21 (Fig. 4B). Sirius red and H&E staining were performed to check the pathology and the degree of fibrosis in the liver sample of each group. Auranofin decreased fibronectin and intrahepatic fibrosis area (Fig. 4C, D). The mRNA expression of α-SMA and FN-1 decreased in the auranofin administered group compared to the vehicle (Fig. 4E). Furthermore, NF-κB was significantly lower than in vehicles (Fig. 4F). As for the survival rate in the BDL model, the vehicle showed the lowest survival rate at 57%, AR 1 mg showed 73%, AR 3 mg at 79%, and AR 10 mg at 80% showed a high survival rate depending on the concentration (Fig. 4G).

Auranofin reduces intrahepatic fibrosis in the BDL model. (A) Experimental schematic and (B) day 21 mice images in BDL model mice. (C) H&E, Sirius red staining and immunohistochemical images of FN-1 in a liver sample from BDL model mice (×100). (D) Quantitative comparison of fibrosis area based on Sirius red staining. (E) Hepatic α-SMA and FN-1 mRNA and (F) NF-κB protein expression in BDL model mice. (G) The survival rate of BDL model mice (vehicle, n=8; AR 1 mg, n=11; AR 3 mg, n=11; and AR 10 mg, n=12). H&E, hematoxylin and eosin; FN-1, fibronectin 1; NF-κB, nuclear factor kappa B; BDL, bile duct ligation. *P<0.05. **P<0.01.
Auranofin reduced palmitic acid (PA)-induced inflammation and adipogenesis in HepG2 cells
Transcriptome analysis revealed that auranofin-regulated genes were associated with antioxidants and inflammation (Fig. 1E-G). Therefore, we evaluated whether auranofin performed the same function in HepG2 cells. The gene expression was compared by treatment with PA and auranofin, which induce lipotoxicity. Auranofin significantly reduced interleukin-6 and MCP-1 mRNA levels in HepG2 cells with PA-induced lipotoxicity (Fig. 5A). NLRP3 and ASC were also significantly decreased in the auranofin-treated group (Fig. 5A). SREBP-1c, FAS, and SCD1 significantly decreased in PA+AR100 nM compared to the PA alone treatment group (Fig. 5B). The expression of antioxidant markers NQO1, GSTA1, and xCT mRNA significantly increased at PA+AR500 nM cosmpared to the PA alone group (Fig. 5C). These results were consistent with Nile red staining results (Fig. 5D).
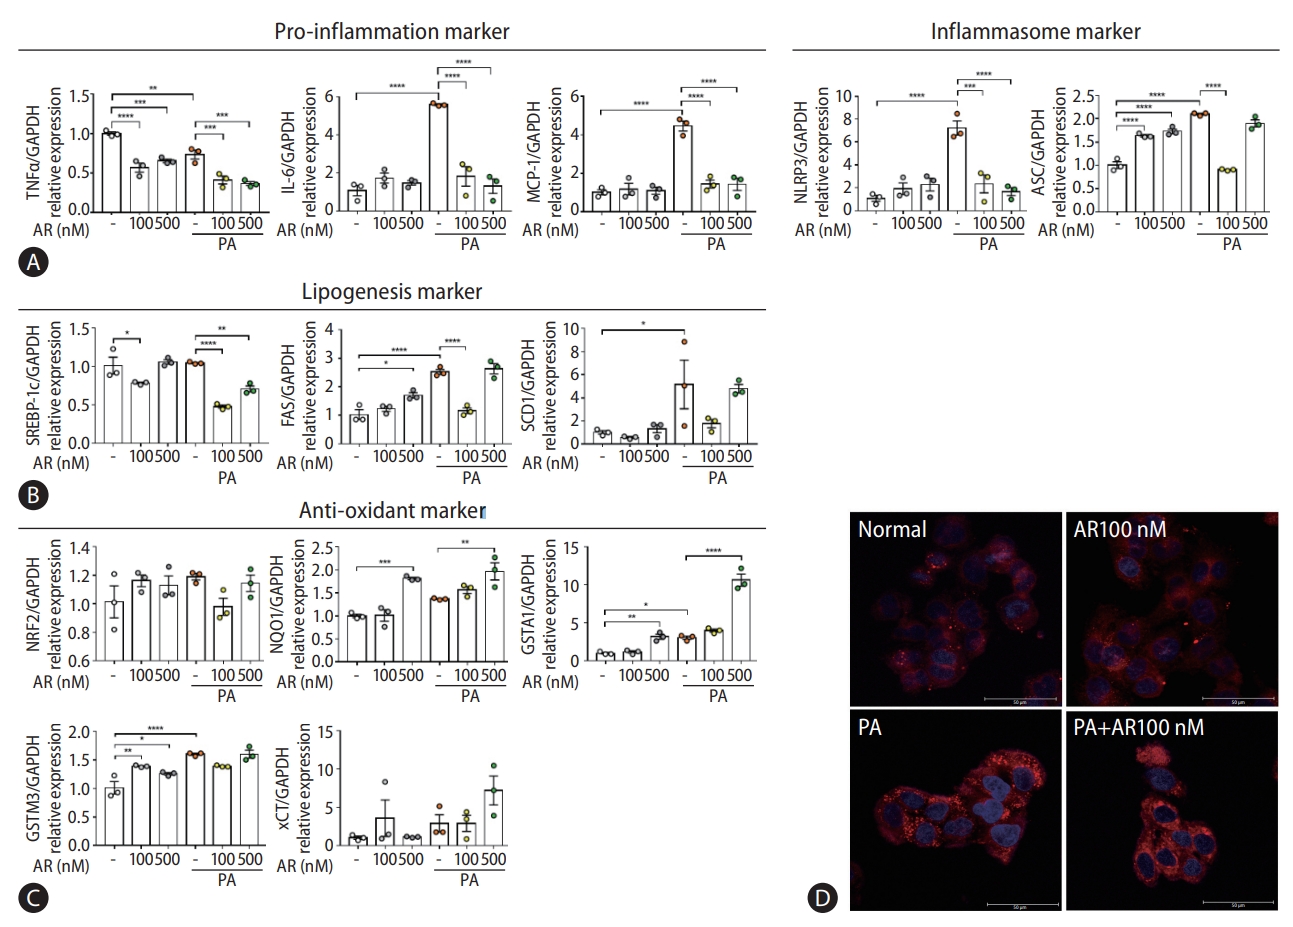
Auranofin reduced lipogenesis by generating inflammation reduction and antioxidants in PA-induced HepG2 cells. Quantitative comparison of mRNA levels of (A) inflammation, (B) lipogenesis markers, and (C) antioxidant in auranofin treatment results in PA-induced HepG2 cells. (D) Comparison of fat accumulation by auranofin treatment in PA-induced HepG2 cells with Nile-red O staining (×630). Data shown in bar diagrams as mean±standard error of mean from three independent experiments. TNF, tumor necrosis factor; GAPDH, glyceraldehyde-3-phosphate dehydrogenase; PA, palmitic acid; IL, interLeukin; MCP, monocyte chemoattractant protein. *P<0.05. **P<0.01. ***P<0.001. ****P<0.0001.
Auranofin recovered pNRF2 reduced due to palmitic acid
We investigated NRF2, a general upstream signal of antioxidants increased by auranofin. Results showed that ubiquitinated NRF2 increased and pNRF2 decreased by PA (Fig. 6A). Auranofin increased pNRF2 reduced by PA (Fig. 6B). Additionally, protein changes of pNRF2 and ubiquitinated NRF2 by auranofin were confirmed. Ubiquitinated NRF2 expression decreased in HepG2 cells treated with auranofin, and pNRF2 expression increased (Fig. 6C). A dual-luciferase assay was performed on NRF2/ARE Luciferase reporter HepG2 cells. Auranofin increased ARE-luciferase activity in a concentration-dependent manner and increased PA-induced attenuated activity. Thus, we demonstrated that auranofin increased NRF2 gene expression (Fig. 6D).

Auranofin inhibits lipid accumulation by increasing pNRF2. (A) Quantitative comparison of pNRF2 protein expression according to palmitic acid concentration. (B) pNRF2 (green), phalloidin (red), and DAPI (blue) immunofluorescence staining of PA and auranofin-treated HepG2 cells (×630). (C) Expression of pNRF2 and ubiquitinated NRF2 protein in HepG2 cells. (D) luciferase reporter activity in NRF2/ARE luciferase reporter HepG2 cells. (E) Expression of pNRF2, HO-1, and xCT proteins in HepG2 cells treated with ML385 and auranofin. (F) Comparison of lipid accumulation following oleic acid and auranofin administration in WT and ML385-treated HepG2 cells with Nile-red O staining (×630). NRF2, nuclear erythroid 2-related factor 2; GAPDH, glyceraldehyde-3-phosphate dehydrogenase; PA, palmitic acid; DAPI, 4’,6-diamidino-2-phenylindole; ARE, antioxidant response element; WT, wile type. *P<0.05. **P<0.01. ***P<0.001. ****P<0.0001.
The NRF2 inhibitor, ML385, decreased pNRF2, HO-1, and xCT protein expression. (Fig. 6E). We compared whether inhibition of NRF2 affects lipid accumulation. Oleic acid increased lipid accumulation, which was attenuated by auranofin. However, ML385-treated cells were masked (Fig. 6F). Collectively, auranofin regulates NRF2 and its downstream antioxidant genes, and NRF2 affects lipid accumulation.
Auranofin reduced hepatic steatosis and fibrosis in western diet-induced NASH model mice
The NASH model mice fed a WD diet were sacrificed at 20 weeks after oral administration of auranofin for 8 weeks (Fig. 7A). The amount of lipids and the degree of fibrosis in the mice liver samples of each group were compared (Fig. 7B). The amount of intrahepatic lipids was significantly reduced at AR 10 mg compared to vehicle, and the area of fibrosis also showed significant reduction (Fig. 7C, D). Moreover, TGF-β1 and COL1A1 mRNA levels significantly decreased in AR 10 mg, and lipogenesis markers, SREBF1, SCD1, FAS, and MTTP, showed a significant decrease (Fig. 7E). The mRNA levels of the antioxidant markers NRF2, NQO1, GPX, SOD3, and GSHRx, significantly increased in the auranofin administered group (Fig. 7F).
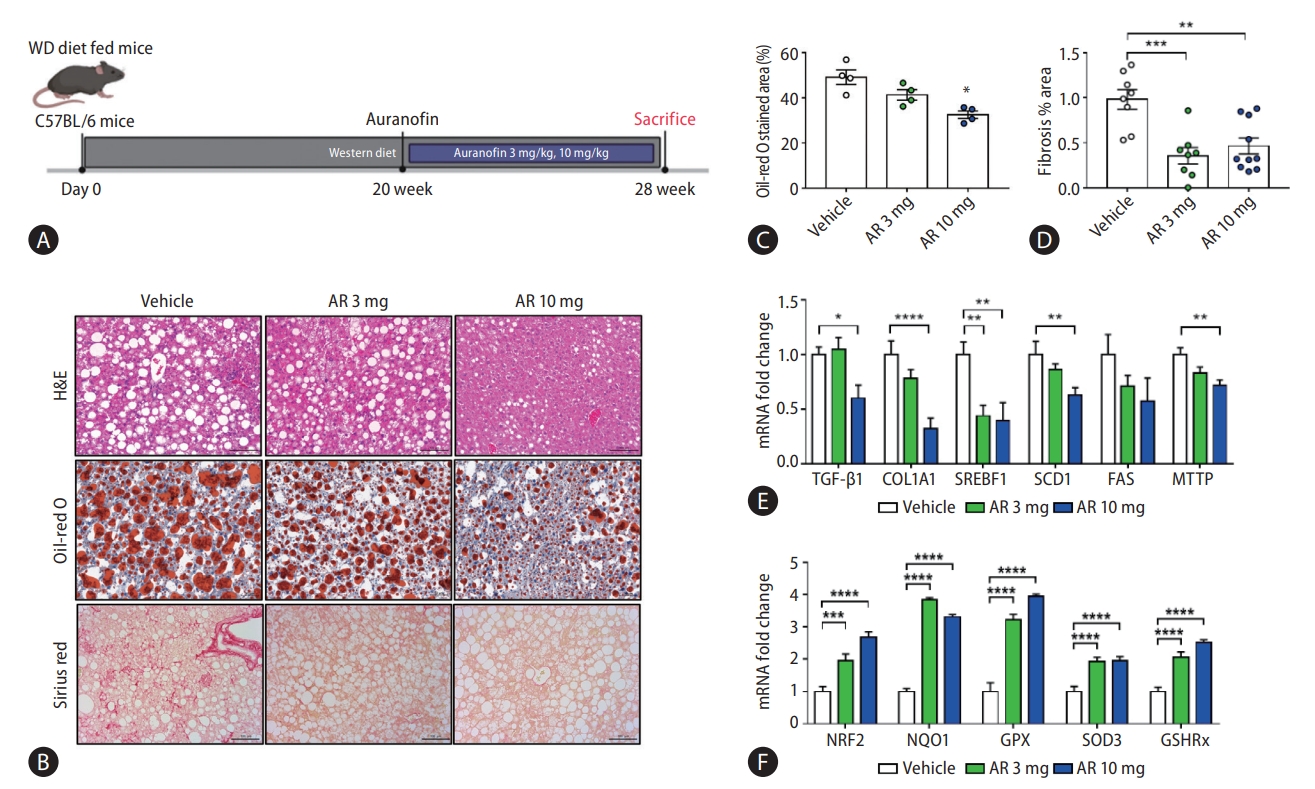
Auranofin reduced intrahepatic adipogenesis and fibrosis in WD-induced NASH model mice. (A) The experimental schematic in WD fed NASH model mice. (B) H&E, Sirius red, and Oil-red O staining image in NASH model liver sample (×200). Data quantified based on (C) Oil-red O staining images and (D) Sirius red staining images. (E) Quantitative comparison of mRNA levels of fibrosis and lipogenesis markers in liver samples from NASH model mice. (F) Quantification of mRNA levels of NRF2 and its downstream, an antioxidant marker (vehicle, n=10; AR 3 mg, n=10; and AR 10 mg, n=10). WD, western diet; H&E, hematoxylin and eosin; TGF, transforming growth factor; COL1A1, collagen type 1 alpha 1 chain; NRF2, nuclear erythroid 2-related factor 2; NASH, non-alcoholic steatohepatitis. *P<0.05. **P<0.01. ***P<0.001. ****P<0.0001.
DISCUSSION
Several hepatic disorders, such as viral hepatitis and alcoholic or NASH, involve free radicals/oxidative stress as agents that cause or exacerbate the liver injury, which can progress into chronic liver diseases (such as liver fibrosis and cirrhosis).
Auranofin is an inhibitor of NF-κB signaling and a potent activator of NRF2 [30,31]. However, it is still unknown whether NRF2 activation is involved in the mechanism of auranofinregulated NF-κB signaling. Immune and stress responses, inflammation, cell survival, and apoptosis are regulated via modulation of NRF2 levels. Inflammation is the most common feature of chronic liver diseases, triggering fibrosis, cirrhosis, and hepatocellular carcinoma. NRF2 counteracts the proinflammatory process by modulating the recruitment of inflammatory cells and inducing a cellular antioxidant response.
Only the classical pathway activated by the IκB kinase complex occurs in these hepatocytes. IκB triggers proteasome degradation, allowing NF-κB to translocate into the nucleus and activate the transcription of the target genes. Keap1 can also degrade IKKβ through ubiquitination, whereby NF-κB is inhibited [32]. NF-κB can interact with the NRF2 coactivator CREB-binding protein [33,34], stopping the transcription of genes regulated by NRF2 and leading to the inhibition of NF-κB activity [35]. The non-canonical activation of NF-κB is induced by cytokine TGF-β-activated kinase 1 and phosphatidylinositol 3-kinase/protein kinase B [36].
In addition to ROS levels, various chemokines and growth factors are also crucial for the onset and progression of fibrosis. Among the chemokines and growth factors secreted, TGF-β appears to be a key mediator of the fibrotic process. Fibrosis, a major hallmark of NASH originating from NAFLD, is strongly influenced by the activation of hepatic stellate cells. Cell activation proceeds by cytokines appearing under lipotoxic conditions and inflammation caused by continuous lipid accumulation in hepatocytes [37,38].
We found 15 genes upregulated by TGF-β1, a representative cytokine that activates hepatic stellate cells and LX-2 cells, and is downregulated by auranofin. Here, some genes identified in the scatterplot were additionally found, and string analysis was performed to determine the association between these genes (Fig. 1A-D). GSEA, performed to investigate the effects of auranofin, showed that genes involved in epithelial-mesenchymal transition and inflammatory responses were downregulated (Fig. 1E, F). Therefore, through transcriptomics analysis, we could screen for genes whose expression was affected by auranofin in LX-2 cells and subsequently infer that these genes can affect liver fibrosis and NASH [39,40]. Auranofin increased the survival rate of the BDL model, downregulated NF-κB, IκB, and ET-1, and decreased the fibrotic area. In the WD-fed NASH model, auranofin upregulated antioxidant genes by activating pNRF2 and suppressed lipid production and fibrosis. Pathogenesis of NAFLD is based on the multi-hit theory, including fat accumulation, oxidative stress, and cell death. One of the biggest challenges in developing new drugs for NAFLD is the enormous heterogeneity of the NAFLD phenotype. Therefore, a multiple target and/or combination treatment approach may be more effective than a single target approach for NAFLD treatment. Auranofin showed multifaceted anti-oxidative and anti-fibrosis effects in hepatocytes and hepatic stellate cells, respectively. Therefore, auranofin can be more effective by participating in multiple steps of NAFLD pathogenesis.
This study may have potential weaknesses in that we conducted all evaluations at a single time point in a mouse model of fibrosis and NASH. Acute liver inflammation and fibrosis in the BDL mouse model represent cholestatic liver disease. However, we demonstrated that auranofin attenuates steatosis, inflammation, and fibrosis in both in vitro and in vivo models; thus, this compound may be used for treating NASH in the future.
Notes
Authors’ contributions
Guarantor of the article: Dae Won Jun; Study concept and design: Dae Won Jun, Yoon Jin Roh; Data analysis and drafting of the manuscript: Seung Min Lee; Dong Hee Koh helped with data interpretation; Experiments and procedures of the study: Seung Min Lee, Hyunsung Kim, Ju Hee Oh, and Hyeon Tae Kang; Writing of the article: Seung Min Lee, Yoon Jin Roh. All authors read and approved the final manuscript.
Conflicts of Interest
The authors have no conflicts to disclose.
Acknowledgements
This work was supported by the research fund of Hanyang University (HY-2017) and National Research Foundation of Korea (2020R1A2C2009227).
Abbreviations
ARE
antioxidant response element
BDL
bile duct ligation
COL1A1
collagen type 1 alpha 1 chain
DMEM
using Dulbecco’s modified Eagle’s medium
DPBS
Dulbecco’s phosphate buffered saline
ET-1
endothelin 1
FBS
fetal bovine serum
FN-1
fibronectin 1
GAPDH
glyceraldehyde-3-phosphate dehydrogenase
GSEA
gene set enrichment analysis
H&E
hematoxylin and eosin
NAFLD
nonalcoholic fatty liver disease
NASH
non-alcoholic steatohepatitis
NF-κB
nuclear factor kappa B
NRF2
nuclear erythroid 2-related factor 2
P/S
penicillin-streptomycin
PA
palmitic acid
qRT-PCR
quantitative real-time polymerase chain reaction
ROS
reactive oxygen species
TGF
transforming growth factor
THBS1
thrombospondin 1
WD
western diet
References
Article information Continued
Notes
Study Highlights
• Auranofin reduces the genes involved in collagen-binding in TGF-β1-induced LX-2 cells.
• Auranofin decreases NF-κB and IκB in TGF-β1-induced LX-2 cells, thus, reducing ET-1 and fibrosis.
• Auranofin increases pNRF2 in PA-induced HepG2 cells, thereby increasing the expression of antioxidant markers and reducing lipid accumulation.
• In the BDL model mouse, auranofin decreases the area of fibrosis and increases survival.
• Auranofin reduces fibrosis and lipid accumulation in NASH model mice fed on a WD.