


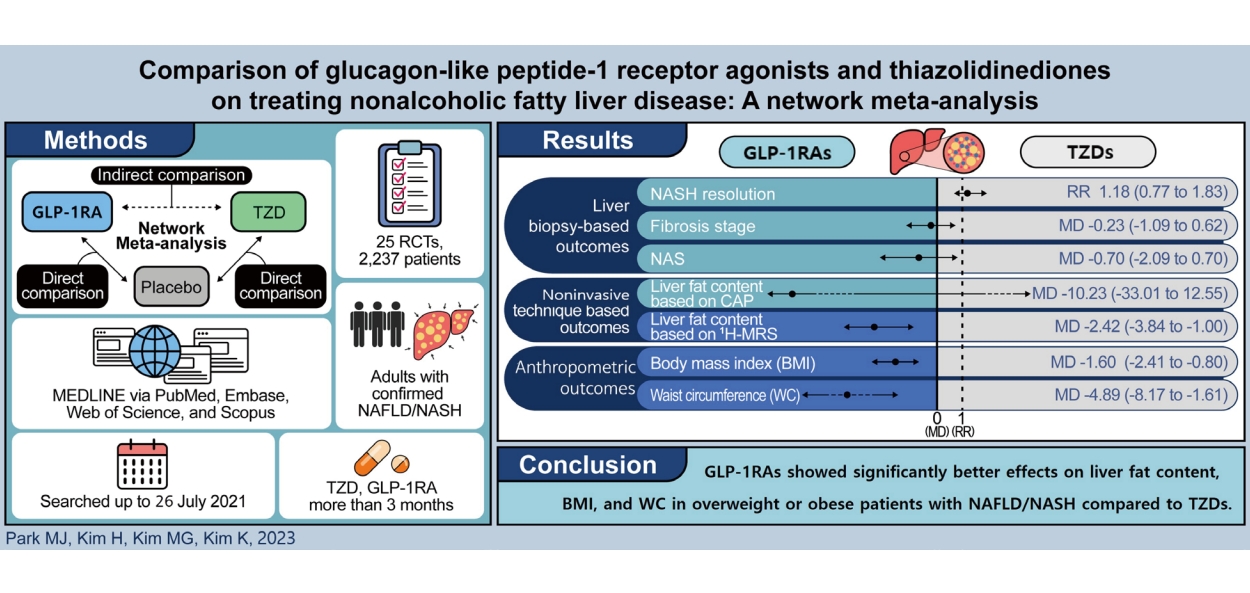
Graphical Abstract
INTRODUCTION
Nonalcoholic fatty liver disease (NAFLD) is a condition characterized by excessive fat build up in the liver, with a global prevalence of 25% [1,2]. Nonalcoholic steatohepatitis (NASH), a type of NAFLD, is accompanied by steatosis and inflammation. It can proceed to cirrhosis or even hepatocellular carcinoma, which is the third most prevalent reason for liver transplantation [3,4]. NASH is also known to be associated with not only a high incidence of liver-related complications but also an increased risk of cardiovascular-related mortality and vascular complications [5]. Considering the burden of disease and its healthcare costs, NAFLD and NASH have been recognized as global public health issues [6-8].
Currently, there is no US Food and Drug Administration (FDA)-approved treatment for NAFLD. Lifestyle modification and weight loss are recommended as the foundation for disease management [9]. However, this appears to have limited effects on NAFLD given that only 3ŌĆō6% of patients achieved weight loss with long-term lifestyle modification and most patients fail to maintain a healthy lifestyle and the body weight they had reduced [10]. Therefore, an effective and sustainable pharmacological treatment should be explored. It is known that the core pathogenic mechanism of NAFLD is insulin resistance, which is also a hallmark of type 2 diabetes mellitus (T2DM) and obesity [11]. Owing to the shared pathophysiological mechanism and close bidirectional impact between NAFLD and T2DM, antidiabetic medications have been evaluated as treatments for NAFLD. Metformin, which was initially expected to be a candidate drug for NAFLD treatment, did not significantly improve liver biopsy findings in several randomized controlled trials (RCTs) [12-17]. Several RCTs and meta-analyses, however, reported the benefit of thiazolidinedione (TZD) and glucagon-like peptide-1 receptor agonist (GLP-1RA) in the treatment of NAFLD or NASH. Pioglitazone has been found to be effective against NASH with or without diabetes [18,19]. Several large RCTs have shown that liraglutide and semaglutide are significantly more effective than controls in reducing liver fat content or resolving NASH [20-22]. However, few studies have compared the effects of TZD and GLP-1RA in the treatment of patients with NAFLD.
Network meta-analyses (NMAs) published so far have included only a few RCTs for GLP-1RA, or most have failed to find significant comparative estimates between TZD and GLP-1RA [23-27]. Furthermore, most of the articles are based on liver function tests or indirect indexes rather than liver biopsy-based outcomes, which is the gold standard for diagnosing NAFLD and NASH. Therefore, the current NMA study aimed to comprehensively compare the effects of GLP-1RA and TZD on NAFLD or NASH treatment based on liver biopsy-based, noninvasive technique-based, biological, and anthropometric outcomes.
MATERIALS AND METHODS
The current study was conducted following the Preferred Reporting Items for Systematic Reviews and Meta-Analyses (PRISMA) extension statement for the reporting of systematic reviews incorporating NMAs of Health Care Interventions (Supplementary Material 10) [28]. The study protocol was registered on the international prospective register of systematic reviews (PROSPERO, number CRD42022330299).
Search strategy and selection criteria
In this NMA study, relevant RCTs were retrieved in large databases including MEDLINE via PubMed, Embase, Web of Science, and Scopus, from inception to 26 July 2021. To address heterogeneity, the population, intervention, comparison, outcome, and study design (PICOS) framework was utilized in setting up a search strategy (Table 1). Supporting information depicts the detailed search terms (Supplementary Material 1). Search filters for sorting RCTs or clinical trials were applied to each database.
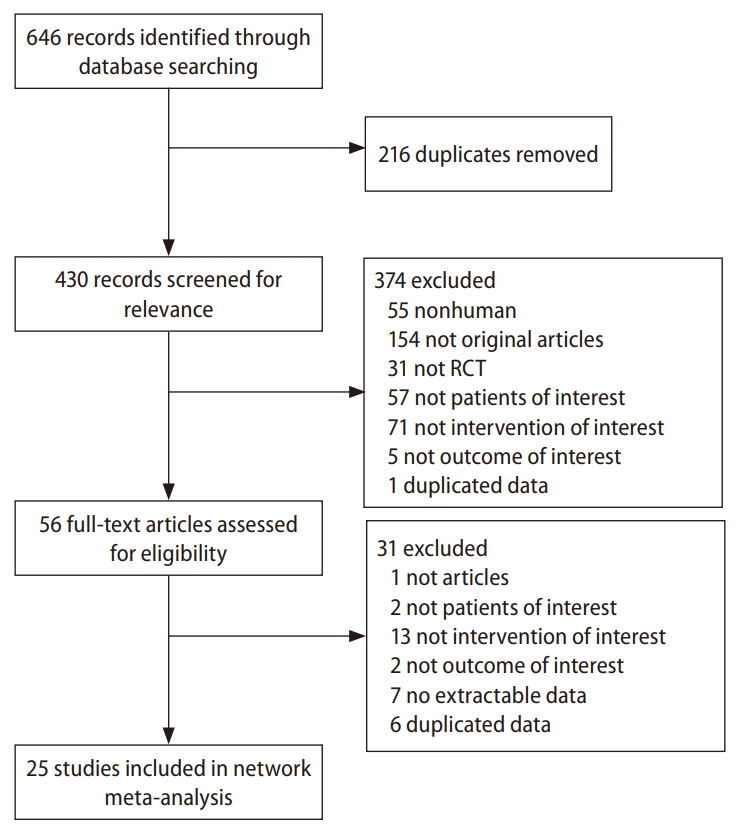
To identify the eligible RCTs, two researchers independently conducted article selection in two stages: initial title/abstract screening, then full-text review. Studies that met the following inclusion criteria were selected: 1) A study population consisting of NAFLD or NASH patients diagnosed with biopsy or other imaging methods, 2) adult participants, 3) GLP-1RA or TZD treatment as intervention group, 4) active or placebo control group, 5) at least 3 months of treatment duration, 6) liver biopsy-based, noninvasive technique-based, biological parameters, or anthropometric parameters as outcomes. Studies other than original research, such as review articles, editorials, letters, case reports, or conference abstracts, and those reporting nonextractable data were excluded. Any disagreement during the screening was resolved via either discussion between the two researchers or mediation with a third reviewer. The process of study selection is presented as a flow diagram based on PRISMA guidelines (Fig. 1).
Study outcomes
Liver biopsy-based outcomes, including NAFLD activity score (NAS), fibrosis stage, and NASH resolution were analyzed. NAS was expressed as the mean value of the sum score of steatosis, lobular inflammation, and ballooning, which were based on the standard staging criteria of the Clinical Research Network [29]. According to the same criteria, the mean fibrosis stage was estimated. To assess NASH resolution, the current study evaluated the number of patients who were free from fatty liver disease after treatment. As noninvasive technique-based outcomes, liver fat content measured by proton magnetic resonance spectroscopy (1H-MRS) and controlled attenuation parameter (CAP) were analyzed. In addition, biological outcomes (such as alanine aminotransferase [ALT], aspartate aminotransferase [AST], hemoglobin A1c [HbA1c], fasting plasma glucose [FPG], homeostasis model assessment of insulin resistance [HOMA-IR], total cholesterol [T-Chol], low-density lipoprotein-cholesterol [LDL-C], and triglycerides [TG]) and anthropometric outcomes (such as body mass index [BMI] and waist circumference [WC]) were analyzed for further comparison.
Data extraction and risk of bias assessment
Two researchers extracted data including the characteristics of the study population (number of patients per group, age, sex, diabetic status, liver disease status [NAFLD or NASH], and BMI per group), intervention(s) (TZD or GLP-1RA, treatment duration), control(s), outcome(s), and study results for each outcome according to a predefined Excel format. Because individual patient data were not available, summary statistics were extracted from the article. Mean and standard deviation was used directly for analysis. Mean with standard error or median with 95% confidence interval (CI) or range were converted to mean with standard deviation [30-32].
To evaluate the quality of the selected RCTs, risk of bias was assessed using the revised Cochrane risk of bias tool for randomized trials (RoB 2.0) [33]. Possible biases caused by the randomization process, deviations from intended interventions, missing data, outcome measurements, and selective reporting were rated as high risk, low risk, or some concerns. Two researchers independently completed a risk of bias assessment. After crosschecking, any disagreement was resolved through discussion between the two researchers or mediation with the supervising reviewer.
Statistical analysis
This NMA was conducted with the frequentist method using the netmeta package of R program version 4.1.1 (R Foundation, Vienna, Austria). The effect size was expressed as relative risk (RR) for categorical variables and mean difference (MD) for continuous variables, with 95% CIs. Drugs under the same class were regarded as one treatment node and pooled effect sizes were estimated regardless of drug dose. Statistical heterogeneity was assessed using CochranŌĆÖs Q and Higgins I2 statistics. If there is an issue of heterogeneity between studies, a random effects model was utilized to address it. CochranŌĆÖs Q statistic in a closed loop test was used to evaluate any inconsistencies. To examine the effect of small studies, publication bias was assessed using a comparison-adjusted funnel plot and EggerŌĆÖs test. If a P-value of the Egger test was less than 0.05, additional analysis was conducted after excluding the studies that caused asymmetry in the funnel plot. A P-score ranging from 0 to 1 was used to assess the mean extent of certainty that one treatment is better than another. And treatment ranking was determined by calculating the P-score of each treatment, including the placebo [34]. Based on basic NMA assumptions, only outcomes including those of head-to-head comparison studies were estimated as multiple treatment comparisons; otherwise, indirect treatment comparison was applied [35]. Table 2 shows all statistical data from multiple treatment comparisons and indirect treatment comparisons, and Figures 2 and 3 depict forest plots with P-scores.
Subgroup analyses were performed based on diabetic status (with T2DM or without diabetes), liver disease status (NAFLD or NASH), and treatment duration (Ōēź48 or <48 weeks). To evaluate the robustness of results, sensitivity analysis was performed after excluding studies with a high risk of bias.
RESULTS
In total, 646 articles were obtained from the database search. After initial title/abstract screening and subsequent full-text filtering, 25 RCTs consisting of 2,237 patients that satisfied the PICOS framework and the predefined inclusion criteria were included in this NMA (Fig. 1). Characteristics of the included studies are presented in Supplementary Material 2. Eight studies compared GLP-1RA (6 liraglutide, 1 semaglutide, and 1 dulaglutide) and placebo; 16 studies, TZD (13 pioglitazone, 3 rosiglitazone) and placebo; one study, GLP-1RA and TZD. Six of the 25 studies included only T2DM patients. Nine studies included only patients without diabetes, and the remaining studies included participants regardless of diabetic status. Participants in the included studies were either overweight or obese. All interventions were applied for at least 12 weeks, with a maximum duration of 96 weeks. All studies, except six studies, showed a mild to moderate risk of bias due to a risk of incomplete outcome data (Supplementary Material 3). Due to the lack of head-to-head comparisons, liver biopsy-based outcomes and CAP-based liver fat content were compared indirectly for GLP-1RAs versus TZDs. Meanwhile, the pooled data on biological outcomes, anthropometric outcomes, and liver fat content based on 1H-MRSwere evaluated via NMA. Supplementary Material 4 presents the network graphs of liver biopsy-based, noninvasive technique-based, biological, and anthropometric outcomes. Estimates of individual studies and pairwise meta-analysis of all outcomes are presented with forest plots in Supplementary Material 5.
Liver biopsy-based outcomes
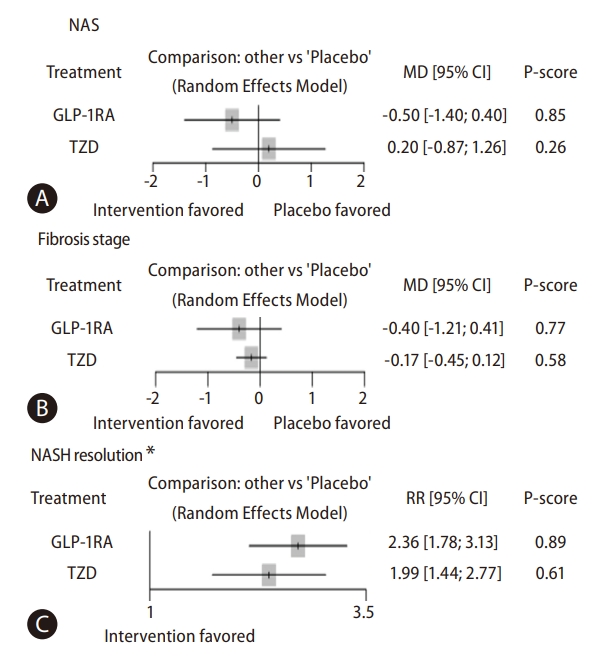
Figure 2 shows the forest plot of pooled estimates of GLP-1RA versus placebo and TZD versus placebo on the biopsy-based outcomes of NAFLD. Table 2 summarizes the number of studies included in each analysis (k), proportion of direct evidence (P), inconsistency between study designs (q), and pooled estimates obtained via direct and indirect analysis or NMA (if available) between GLP-1RA versus placebo, TZD versus placebo, and GLP-1RA versus TZD. Although statistical significance was not reached, GLP-1RA tended to surpass TZD in reducing NAS (MD: -0.70, 95% CI: -2.09 to 0.70) and fibrosis stage (MD: -0.23, 95% CI: -1.09 to 0.62), and resolving NASH (RR: 1.18, 95% CI: 0.77 to 1.83). Moreover, the P-score, which indicates treatment ranking, showed that GLP-1RA is superior to TZD in reducing NAS and fibrosis stage, and resolving NASH (Fig. 2).
Noninvasive technique-based outcomes
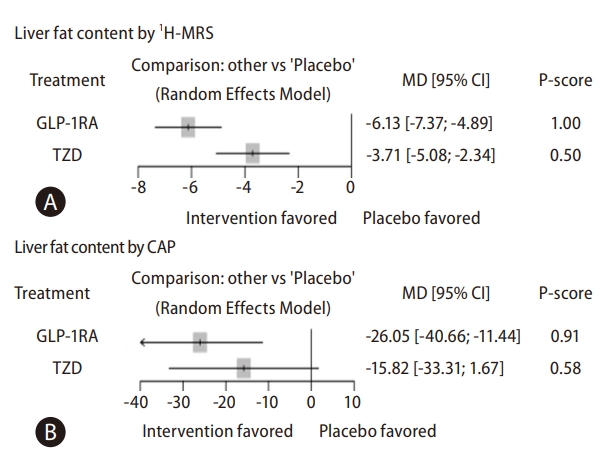
GLP-1RA was significantly superior to TZD in reducing liver fat content evaluated using 1H-MRS (MD: -2.42, 95% CI: -3.84 to -1.00) (Table 2). For the reduction of liver fat content as measured using CAP, GLP-1RA was more effective than TZD, albeit not significantly (MD: -10.23, 95% CI: -33.01 to 12.55). Compared with placebo, TZD treatments did not significantly reduce liver fat content measured using CAP, but GLP-1RA had a significant effect on reducing liver fat content (Fig. 3). In accordance with the results of a pooled analysis, GLP-1RA had a higher P-score than TZD in reducing liver fat content as measured using 1H-MRS and CAP.
Biological and anthropometric outcomes
As shown in Supplementary Material 6, GLP-1RA was significantly beneficial in reducing BMI (MD: -1.6, 95% CI: -2.41 to -0.80) and WC (MD: -4.89, 95% CI: -8.17 to -1.61) compared with TZD. In addition, GLP-1RA showed a tendency for increased efficacy than TZD in improving liver function parameters such as ALT and AST, glucose levels such as HbA1c and FPG, and lipid panels such as LDL-C and TG. On the other hand, TZD showed a better effect on HOMA-IR and T-Chol levels than GLP-1RA, but not significant. Forest plots with P-score for biological and anthropometric outcomes are presented in Supplementary Material 7.
Sensitivity analyses
After excluding six studies with a high risk of bias, sensitivity analyses were performed. The results of the sensitivity analyses for liver fat contents measured by 1H-MRS, BMI, and WC showed significant superiority of GLP-1RA, which was in accordance with the original NMAŌĆÖs results (Supplementary Material 8). For NASH resolution and liver fat content measured using CAP, all the included studies had a mild to moderate risk of bias, hence no additional sensitivity analysis was performed. In the case of NAS, sensitivity analysis could not be performed due to the small number of studies remaining after excluding the studies with a high risk of bias.
Subgroup analyses
Due to the limited number of studies, subgroup analyses were performed only for biological and anthropometric outcomes. As shown in Supplementary Material 6B, in a subgroup analysis according to diabetic status, GLP-1RA was significantly superior to TZD in reducing BMI in the T2DM subgroup (MD: -2.63, 95% CI: -3.77 to -1.49), but not in the nondiabetic group (MD: 0.36, 95% CI: -0.60 to 1.32). In a subgroup analysis by liver disease, GLP-1RA was more effective than TZD in reducing BMI (MD: -2.71, 95% CI: -3.86 to -1.56) and LDL-C levels (MD: -22.08, 95% CI: -43.67 to -0.49) in the NASH group, while more effective in reducing ALT levels (MD: -13.37, 95% CI: -26.35 to -0.39) and WC in the NAFLD group (MD: -4.13, 95% CI: -7.50 to -0.76) (Supplementary Material 6C). In a subgroup analysis by treatment duration (Ōēź48 or <48 weeks), it was discovered that GLP-1RA was more effective than TZD in lowering BMI regardless of the length of the treatment (Ōēź48 weeks, MD: -2.21, 95% CI: -3.64 to -0.79; <48 weeks, MD: -1.26, 95% CI: -2.33 to -0.19). However, for ALT levels and WC reduction, GLP-1 RA was significantly better than TZD only in the group treated for <48 weeks (ALT, MD: -17.44, 95% CI: -33.20 to -1.68; WC, MD: -4.7, 95% CI: -8.31 to -1.10) (Supplementary Material 6D).
Publication bias
Supplementary Material 9 presents the funnel plots of each outcome. Since more than 10 studies are needed for EggerŌĆÖs test, the P-value was estimated only for biological and anthropometric outcomes that were presented by a sufficient number of studies. EggerŌĆÖs test showed no strong evidence of publication bias (P-values >0.05) except for ALT and AST. However, when adjusting for publication bias found in ALT and AST, there was no significant difference in estimates between GLP-1RA and TZD for both ALT and AST.
DISCUSSION
In this NMA, GLP-1RA had a significantly better effect in reducing liver fat content and improving cardiometabolic risk parameters, including BMI and WC, in overweight or obese patients with NAFLD or NASH. Furthermore, GLP-1RA showed a tendency for increased efficacy than TZD in reducing NAS and fibrosis stage, resolving NASH, decreasing liver fat content measured using CAP, and improving liver function parameters and glucose levels. Positive liver biopsy-based and noninvasive technique-based outcomes were consistent even after excluding studies with a high risk of bias via sensitivity analysis.
Regarding the treatment of NAFLD or NASH, there are recent guidelines for NAFLD/NASH published by AASLD (2018) and AACE (2022) [36,37]. The guideline published by AASLD recommended only pioglitazone for the treatment of NAFLD or NASH, with no mention of a comparison of efficacy between GLP-1RA and TZD. The guideline from AACE recommended pioglitazone or GLP-1RA for patients with T2D and biopsy-proven NASH, however, also did not mention the comparison of efficacy between GLP-1RA and TZD. Differently, the AACE guideline recommended the use of obesity pharmacotherapy as adjunctive therapy for lifestyle modification in obese patients with NAFLD or NASH. And in terms of weight loss effect and cardiometabolic health, they gave preference to semaglutide or liraglutide for NASH or NAFLD patients with a BMI of Ōēź27 kg/m2. However, the guidelines did not mention liver-related outcomes for reasons preferring GLP-1RA over TZD in obese patients with NAFLD or NASH. The current study demonstrated that GLP-1RA is better at reducing liver fat content, BMI, and WC than TZD in overweight or obese patients with NAFLD or NASH. As a result, the findings of this NMA provide additional evidence for the current guideline recommendation to favor GLP-1RA over TZD in obese patients with NAFLD or NASH. In addition to the beneficial effect of GLP-1RA on hepatic steatosis, given that the most serious risk of death from NAFLD is cardiovascular disease, the findings indicating GLP-1RA is superior to TZD in reducing cardiometabolic risk parameters such as BMI and WC further emphasize the favorable role of GLP-1RA in the treatment of NAFLD [10]. Moreover, weight gain and peripheral edema are well-known side effects of TZD, which may limit the role of TZD in the treatment of patients with NAFLD.
Previous NMA studies have investigated the effect of various agents including antioxidants, statins, hypoglycemic medication, and vitamins on NAFLD, and reported the superiority based on the treatment rankings of these agents [38-43]. However, most previous NMA studies have compared specific drugs (e.g., pioglitazone and rosiglitazone) or combinations of drug regimens (e.g., rosiglitazone+losartan, rosiglitazone+ metformin) rather than drug classes [38,39,42]. This made it challenging to recognize the pure effect of each drug class based on the mechanism of action. This study compared the treatment effects of each drug class and the result provided a basis for selecting a drug class for NAFLD treatment. Additionally, some earlier NMA studies that compared the treatment effects of GLP-1RA and TZD have presented mixed results. For example, while some studies indicated that TZD ranked higher than liraglutide in improving NAS [38,42], another study indicated that liraglutide ranked higher than pioglitazone in treating fibrosis and NASH resolution [41]. This could be a result of the limited inclusion of RCTs investigating GLP-1RA in earlier NMA studies. Unlike prior NMA studies, the current study included numerous recent RCTs investigating GLP-1RA published after 2016, which may have resulted in findings that differed from earlier studies.
Although the precise mechanism of GLP-1RA effects in NAFLD treatment is not known, various studies have suggested several possible explanations. First, the lower levels of active incretin compared to healthy subjects due to the increased degradation by dipeptidyl peptidase-4 and reduced incretin production in patients with NAFLD may explain the beneficial effect of GLP-1RA in NAFLD treatment [44]. Furthermore, in human studies, GLP-1 infusion has been shown to slow gastric emptying and increase fasting and postprandial gastric volume [45]. Enhancement of satiety by GLP-1RA may promote weight loss, a cornerstone of NAFLD treatment [46]. Fan et al. revealed that GLP-1RA decreases inflammatory lesions in the liver and slows down the process of hepatic fibrosis, thereby improving liver function in an animal experiment [47]. Liu et al. reported that GLP-1RA alleviated endoplasmic reticulum oxidative stress and hepatic steatosis in mice even without weight loss [48]. Moreover, GLP-1RAs are known to reduce lipotoxicity and insulin resistance in the liver and improve metabolic dysfunction, which are the key pathogenetic factors of NAFLD. A recent study showed that the hepatic reninŌĆōangiotensin system activity can be modulated by GLP-1RA through the GLP-1/RAS axis, which may have beneficial effects in the amelioration of NAFLD [49].
The results of this study are valuable in terms of several strengths. First, to the best of our knowledge, this is the first NMA comparing GLP-1RA and TZD and is the most updated and largest comprehensive analysis encompassing recently published RCTs including dulaglutide and semaglutide. Second, unlike previous NMA studies that reported statistical significance only for indirect outcomes such as laboratory data, this study extensively reviewed studies investigating the effects of GLP-1RA and TZD, the two most promising agents, using invasive and noninvasive technique-based outcomes. Liver biopsy is the gold standard for the diagnosis of NAFLD, but the number of studies involving biopsy results is limited due to the risk of complications, cost, and sampling error. Therefore, noninvasive strategies such as 1H-MRS, a reliable and reproducible method for measuring the whole liver fat content, are gradually replacing liver biopsy.
Despite these strengths, the current study has several limitations that need to be acknowledged. First, because there were not many studies directly comparing TZD and GLP-1RA, liver biopsy-based outcomes and liver fat content confirmed via CAP were evaluated through indirect comparison. And the analysis included relatively few studies for GLP-1RA, particularly for liver biopsy-based outcomes. This is because, despite the diagnostic accuracy of liver biopsy, studies reporting liver biopsy as a diagnostic tool have been limited due to its invasive nature and high cost. Despite the small number of studies, however, the indirect analysis performed in this study satisfied the prerequisites of meta-analysis; transitivity and homogeneity. Nevertheless, caution is needed in interpreting the results of this study, and further RCT studies comparing the effects of TZD and GLP-1RA on NAFLD treatment are warranted. Second, there was heterogeneity among the included studies in terms of treatment duration, characteristics of the study population, and medication doses. To address the problem, we adopted a random effects model for analysis and conducted a sensitivity analysis excluding studies with a high risk of bias. Third, due to the inherent limitations of NMA, this study could not perform a subgroup analysis according to the confounding factors of NAFLD, such as race, BMI, or ALT, which could not be obtained from the original article. And, due to the limited number of studies, subgroup analyses were only undertaken for biological and anthropometric outcomes, and the results were inconclusive. These inconsistencies may be due to the small sample size of the included studies, differences in baseline characteristics of study participants, differences in study design such as follow-up duration or control group, and other factors. Further studies are needed to fully comprehend the effects of TZD and GLP-1RA in subgroup analysis.
The results of this study showed that GLP-1RA was superior to TZD in terms of reducing liver fat content and improving cardiometabolic risk parameters such as BMI and WC in overweight or obese patients with NAFLD or NASH. Based on the results, GLP-1RA can be considered over TZD for the treatment of overweight or obese patients with NAFLD or NASH in a clinical setting. However, further studies with direct comparative trials between TZD and GLP-1RA are needed to validate our results.
 PDF Links
 PubReader
 ePub Link
 Full text via DOI
 Download Citation
 Supplement1
 Print
Print