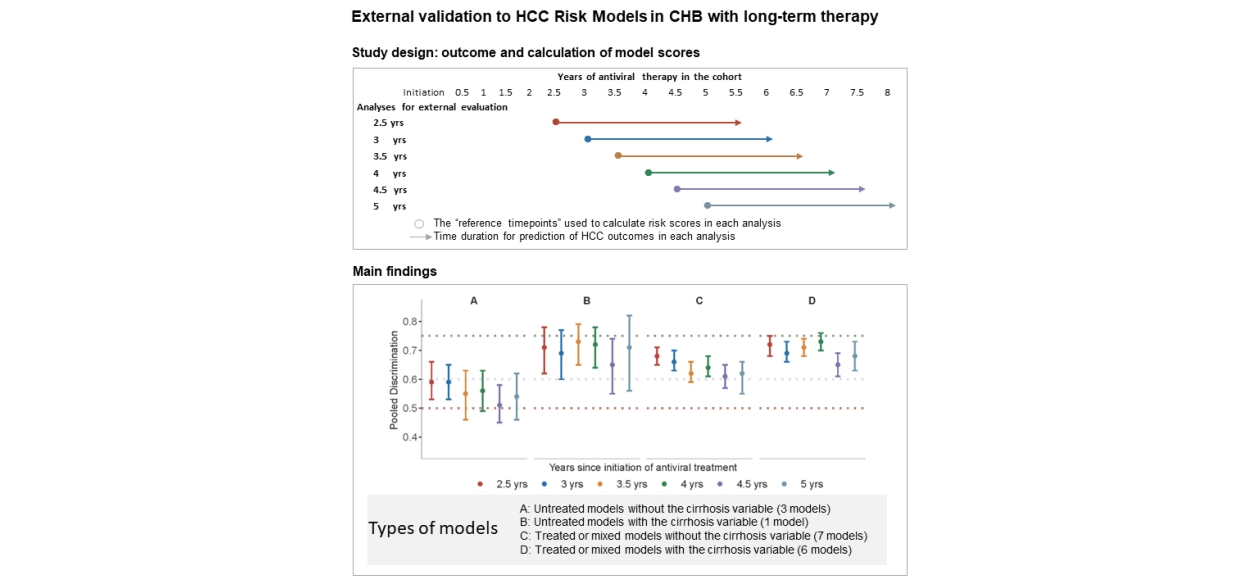
Clin Mol Hepatol > Volume 29(3); 2023 > Article
Wu, Xu, Zhou, Sun, Ding, Xie, Chen, Ma, Piao, Wang, Chen, Meng, Ou, Yang, Jia, Kong, and You: Hepatocellular carcinoma prediction model performance decreases with long-term antiviral therapy in chronic hepatitis B patients

ABSTRACT

Background/Aims

Existing hepatocellular carcinoma (HCC) prediction models are derived mainly from pretreatment or early on-treatment parameters. We reassessed the dynamic changes in the performance of 17 HCC models in patients with chronic hepatitis B (CHB) during long-term antiviral therapy (AVT).

Methods

Among 987 CHB patients administered long-term entecavir therapy, 660 patients had 8 years of follow-up data. Model scores were calculated using on-treatment values at 2.5, 3, 3.5, 4, 4.5, and 5 years of AVT to predict three-year HCC occurrence. Model performance was assessed with the area under the receiver operating curve (AUROC). The original model cutoffs to distinguish different levels of HCC risk were evaluated by the log-rank test.

Results

The AUROCs of the 17 HCC models varied from 0.51 to 0.78 when using on-treatment scores from years 2.5 to 5. Models with a cirrhosis variable showed numerically higher AUROCs (pooled at 0.65–0.73 for treated, untreated, or mixed treatment models) than models without (treated or mixed models: 0.61–0.68; untreated models: 0.51–0.59). Stratification into low, intermediate, and high-risk levels using the original cutoff values could no longer reflect the true HCC incidence using scores after 3.5 years of AVT for models without cirrhosis and after 4 years of AVT for models with cirrhosis.

Conclusions

The performance of existing HCC prediction models, especially models without the cirrhosis variable, decreased in CHB patients on long-term AVT. The optimization of existing models or the development of novel models for better HCC prediction during long-term AVT is warranted.

Graphical Abstract

INTRODUCTION

The hepatitis B virus (HBV) is the primary etiology of hepatocellular carcinoma (HCC) worldwide. Antiviral treatment (AVT) can profoundly suppress HBV DNA replication, attenuate hepatic necroinflammation and fibrosis, and halt the progression to HCC, thereby reducing liver-related mortality [1,2]. Nonetheless, AVT reduces but does not eliminate the development of HCC. Therefore, accurate risk prediction is needed to assist with optimized surveillance for the development of HCC.
The existing prediction models for HCC are mainly derived from untreated CHB patients or patients within 1–2 years of AVT initiation. We previously found that most HCC prediction models demonstrated acceptable performance using variable values within two years of AVT [3]. However, long-term AVT modifies the clinical course of CHB by significantly decreasing serum HBV DNA levels, improving liver functions (e.g., lowering alanine aminotransferase [ALT] and improving serum albumin [ALB]), and even regressing the cirrhosis status [4,5]. The model performances, especially those based mainly on pretreatment variables, are expected to decline as the duration of AVT increases. The retrieval of pretreatment or early on-treatment information for HCC prediction in treated patients is often not feasible in the clinical setting. Shifting the basis of calculating HCC risk using on-treatment variables would be an alternative approach. Therefore, it is still worth exploring any declining trajectories in the predictive performance of existing HCC models.
The validation of the existing HCC models with on-treatment variables during long-term AVT is essential for future model refinement and development. Therefore, in the present study, we comprehensively validated and reassessed the predictive performance of 17 HCC models in a multicenter cohort of CHB patients on long-term AVT.

MATERIALS AND METHODS

Study design

This is an external validation study for 17 HCC prediction models in CHB patients administered long-term AVT from a multicenter prospective cohort in China [6]. This cohort enrolled 987 treatment-naïve CHB patients aged 18–65 between 2013 and 2015 who were followed for nearly eight years until September 2022. Patients coinfected with the hepatitis C virus or human immunodeficiency virus were excluded. The inclusion criteria for the validation cohort were as follows: (1) men or women aged 18–70 years; (2) treatment-naïve with chronic HBV-induced fibrosis F2/F3 or with histological or clinical evidence of cirrhosis; (3) pretreatment HBV DNA >2,000 IU/mL for HBeAg-positive or >200 IU/mL for HBeAg-negative cirrhotic patients, and pretreatment HBV DNA >20,000 IU/mL for HBeAg-positive or >2,000 IU/mL for HBeAg-negative noncirrhotic patients. The study was approved by the ethics committee of Beijing Friendship Hospital, Capital Medical Universit y (IRB numbers BJFHEC/2013-027 and 2016-P2-021-01) and informed consent was signed for every patient.
At the initiation of the study, all participants were treated with entecavir at a dosage of 0.5 mg/day. During the follow-up period, ten patients (1%) shifted their therapy to tenofovir disoproxil fumarate or tenofovir alafenamide. Follow-up with liver biochemistry, HBV DNA, and liver stiffness measurement (LSM) was performed at baseline and every 26 weeks thereafter. HBeAg was tested at baseline and every 1–2 years. Liver histology was reviewed in patients with liver biopsies available at baseline, week 78, and week 260, to evaluate the stage of fibrosis.
The status of cirrhosis during AVT was defined by liver biopsy, presence of gastroesophageal varices on endoscopy, or by meeting at least two of the following four criteria: a) Liver surface irregularity and parenchymal nodularity on imaging (ultrasonography [US], contrast-enhanced computed tomography [CT], or magnetic resonance imaging [MRI]); b) Platelet (PLT) <100×109/L with no other causes; c) ALB <35.0 g/L, or international normalized ratio >1.3; and d) LSM >12.4 kPa (when ALT <5×upper limits of normal) [7].
HCC surveillance was conducted by alpha-fetoprotein (AFP) measurement and liver ultrasonography every 26 weeks. Diagnosis of HCC was performed in accordance with the recommendations of the American Association for the Study of Liver Diseases.

HCC prediction models evaluated in the present study

We externally validated 14 HCC prediction models identified in previous systematic review [8] and 3 other models (aMAP [9], CAGE-B [10], and SAGE-B10) published afterward, with an overview of the cohort characteristics of these models presented in Appendix 1.
We classified the models as “treated”, “untreated”, or “mixed” according to the treatment status of the derivative cohort of CHB patients (all treated, all untreated, or a mix of treated and untreated) in the original reports. Furthermore, we directed special attention to the inclusion of the variable “cirrhosis” in the original model scoring formula. Therefore, we stratified the models into four categories: 1) untreated models without the cirrhosis variable (REACH-B [11], NGM1-HCC [12], and NGM2-HCC [12]); 2) untreated models with the cirrhosis variable (GAG-HCC [13]); 3) treated or mixed models without the cirrhosis variable (mREACH-BI [14], mREACH-BII [14], LSM-HCC [15], SAGE-B, mPAGE-B [16], PAGE-B [17], and aMAP); 4) treated or mixed models with the cirrhosis variable (AASL-HCC [18], CAMD [19], REAL-B [20], CU-HCC [21], RWS-HCC [22], and CAGE-B).

Working definitions for predictors and outcomes used in the current study

For each model, six serial analyses were performed to predict the three-year HCC occurrence and 2.5, 3, 3.5, 4, 4.5, and 5 years of AVT were defined as the respective reference timepoints. In each analysis, on-treatment variable values at the corresponding reference timepoint were used as the “baseline inputs” in calculating model risk scores and model performances in predicting subsequent three-year HCC occurrence were evaluated (Appendix 2).
Patients were eligible for inclusion at a reference timepoint if they had never been diagnosed with HCC before that timepoint and had any clinical visits within the subsequent three years. Follow-up duration was defined as the interval between each “reference timepoint” and the date of the last clinical visit or HCC diagnosis, whichever came first, within the subsequent three years.

Statistical analysis

Model discriminations were assessed by the area under the receiver operating curve (AUROC) with 95% confidence intervals (CIs). The criteria used to judge the discrimination with AUROC values were: poor <0.60; possibly helpful between 0.60 and 0.75; and clearly useful >0.75 [23]. Head-to-head comparisons of AUROCs were performed using the Benjamini and Hochberg method to minimize the false discovery rate [24].
The association of the HCC risk score at every on-treatment timepoint with subsequent three-year HCC incidence was evaluated by Cox’s proportional hazards regression model. The model score was treated as a continuous variable. The hazard ratio (HR) of HCC due to every 10% increase in score for each model was calculated to ensure comparability. A lower limit of HR >1 means that the increase in risk score is consistent with the increased probability of HCC events.
To assess the performance of originally recommended score cutoffs in HCC risk stratification, cumulative HCC incidences in high, intermediate, and low-risk groups were calculated for each model at different on-treatment timepoints using the Kaplan‒Meier method. HCC differences between risk groups were compared using the log-rank test.
Calibration was evaluated both quantitatively using Brier scores and graphically using calibration plots for four models (REACH-B, REAL-B, mPAGE-B, and CAMD) with the projected three-year HCC risks for corresponding model scores reported in the original studies.
Missing values of variables including demographic variables (age and sex), medical history (family history of HCC and diabetes), lifestyle factors (alcohol consumption), and laboratory variables (HBeAg, HBV DNA, PLT, ALB, ALT, total bilirubin [TBIL], AFP, and LSM) were handled with multiple imputation. Rubin’s rule was adopted to combine the point estimates and standard errors based on the five imputation sets.
Sensitivity analyses were performed by using completecase and imputation datasets; and by using on-treatment cirrhosis and pretreatment cirrhosis when calculating scores for models involving the variable “cirrhosis”. Subgroup analyses were conducted in both cirrhotic patients and patients stratified as intermediate or high-risk according to each model score and cutoff when initiating AVT.
Statistical analyses were conducted using R version 4.2.1 (R package MICE, survival, psfmi, iterativeBMA, and ggplot2). All reported P-values are 2-sided, with <0.05 considered statistically significant.

RESULTS

Patient characteristics

Among the 987 patients with CHB receiving AVT, 660 who did not develop HCC until year 2.5 and with at least one visit after year 2.5 were included in the present study. At the time of recruitment, 75.3% of the included patients were males, 14.7% had a family history of HCC, 3.2% had diabetes mellitus, and 62.9% had pretreatment cirrhosis (Table 1).
At AVT year 2.5, 45.2% of the patients had cirrhosis, whereas the percentage was reduced to 35.8% at AVT year 5. On-treatment laboratory profiles significantly improved after the initiation of AVT and stabilized or slightly reduced during years 2.5 to 5, with the median levels of HBV DNA decreasing from 1.0 to 0.5 log IU/mL, ALT decreasing from 23.0 to 21.0 U/L, and the LSM decreasing from 7.9 to 7.4 kPa (Table 1).
During a median follow-up of 7.04 years (interquartile range [IQR], 6.97–7.25), 72 HCC cases were diagnosed. Specifically, from year 2.5, 45 HCC cases were diagnosed. With 2.5, 3, 3.5, 4, 4.5, and 5 years as the reference on-treatment timepoints, subsequent three-year HCC incidences were 33 (5.33%), 30 (4.65%), 28 (4.24%), 21 (3.38%), 20 (3.59%), and 16 (2.85%), respectively (Table 1).

On-treatment changes in HCC risk scores

After an early dramatic decline in the first two years, the HCC risk scores decreased slowly or were maintained steadily from years 2.5 to 5 in the total cohort (Table 2, Appendix 3). Model scores also declined with the prolongation of AVT in both patients with and without the development of HCC. However, the difference in scores between HCC and non-HCC patients was narrower in patients with pretreatment cirrhosis than in the total cohort (Appendix 3).

On-treatment changes in model discriminations predicting HCC development

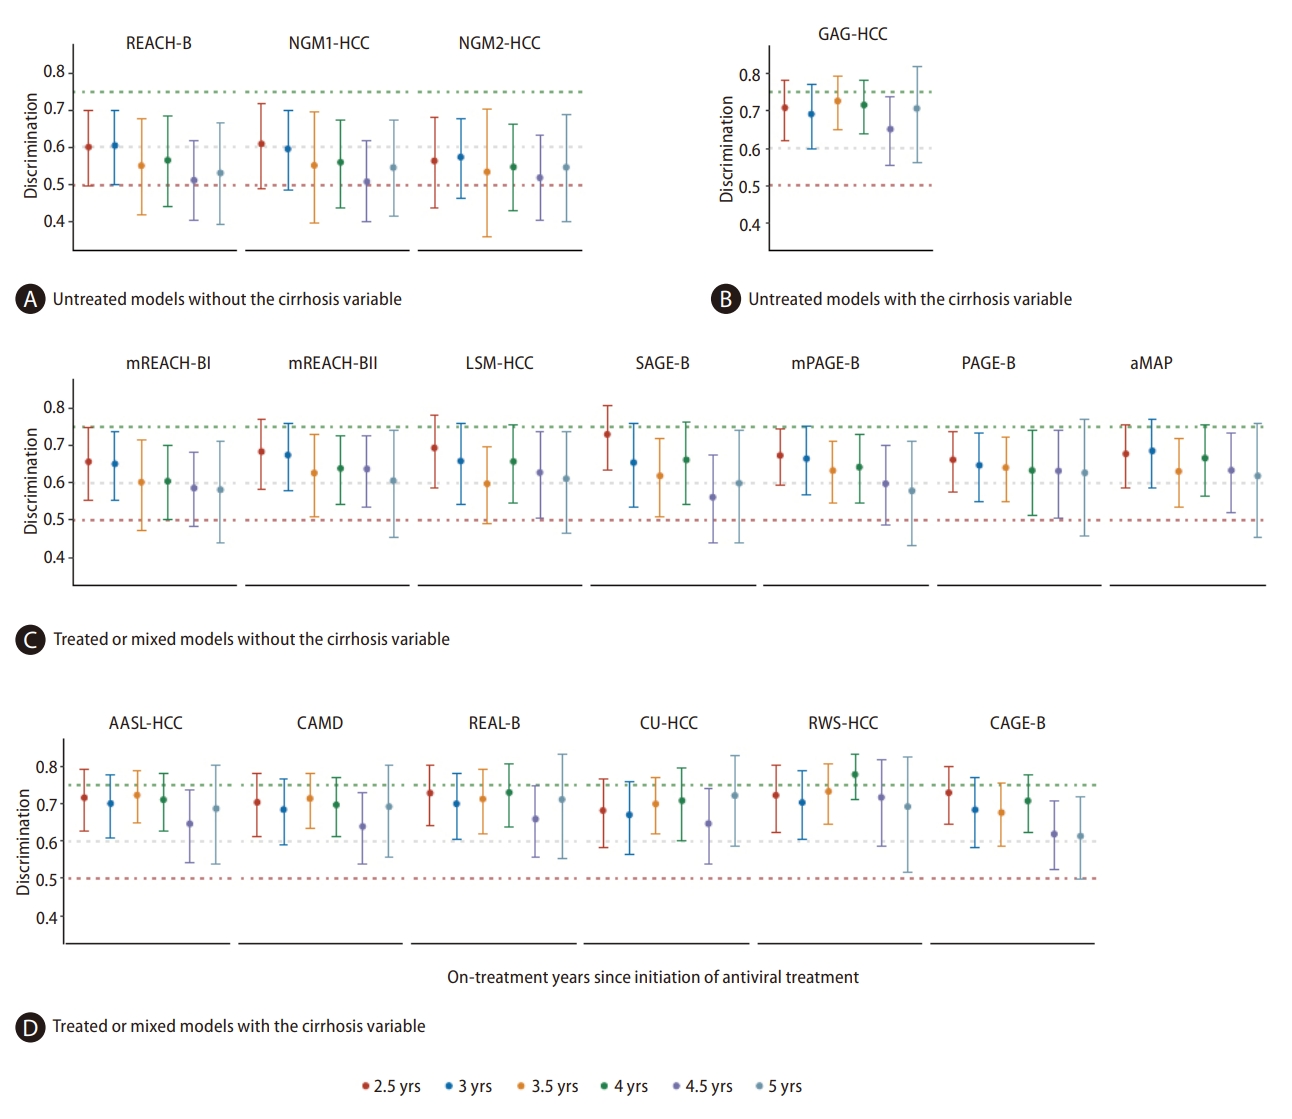
From the initiation of AVT until year 5, a steadily decreasing trend in AUROC was observed for all models when using serial on-treatment variables (Appendix 4). When using on-treatment scores from years 2.5 to 5, the AUROCs of the risk models varied from 0.51 to 0.78 (Fig. 1).
For all three untreated models without the cirrhosis variable, the AUROCs using on-treatment variable values were poor at years 2.5 to 5, and the pooled AUROC estimates varied from 0.51 to 0.59 (Table 3). All seven treated or mixed models without the cirrhosis variable showed possibly helpful AUROCs, with the pooled estimates varying from 0.61 to 0.68 (Table 3). Importantly, models with the cirrhosis variable (independent of untreated, treated, or mixed, excluding CAGE-B), showed numerically higher AUROCs, with the pooled estimates varying from 0.65 to 0.73 (Table 3).
Head-to-head comparison after adjustments of multiple testing showed significantly higher AUROCs in models with the cirrhosis variable than in models without when using on-treatment scores at years 3.5 and 4 (P-values from 0.0011 to 0.0495). No significant difference was found between two models with cirrhosis as a variable at all on-treatment timepoints (P-values from 0.0512 to 0.9996) (Appendix 5).

HR trends in HCC development were associated with changes in on-treatment risk scores

In the study period, the magnitude of increase in HCC risks associated with every 10% increase in model scores was lowered over time, with a decreasing trend in HR estimates observed for all models (Fig. 2).
In the three untreated models without the cirrhosis variable, on-treatment scores did not significantly correlate with HCC risks at either timepoint (all P-values >0.05). For all seven treated or mixed models without the cirrhosis variable, HCC incidence increased significantly with the increase in on-treatment scores at years 2.5 and 3 but then became gradually nonsignificant.
For most models with the cirrhosis variable derived from treated, mixed, or untreated CHB patients, scores remained significantly correlated with HCC incidence, even when using year 5 variable values. A 10% increase in scores signaled a parallel 47% increase in HCC risks for GAG-HCC: 1.47 (1.02, 2.10), 41% increase for REAL-B: 1.41 (1.01, 1.96), 34% increase for CU-HCC: 1.34 (1.03, 1.75), 32% increase for RWS-HCC: 1.32 (1.00, 1.74), and 29% increase for AASL-HCC: 1.29 (1.01, 1.65).

Performance of the score cutoffs originally recommended for HCC risk stratification

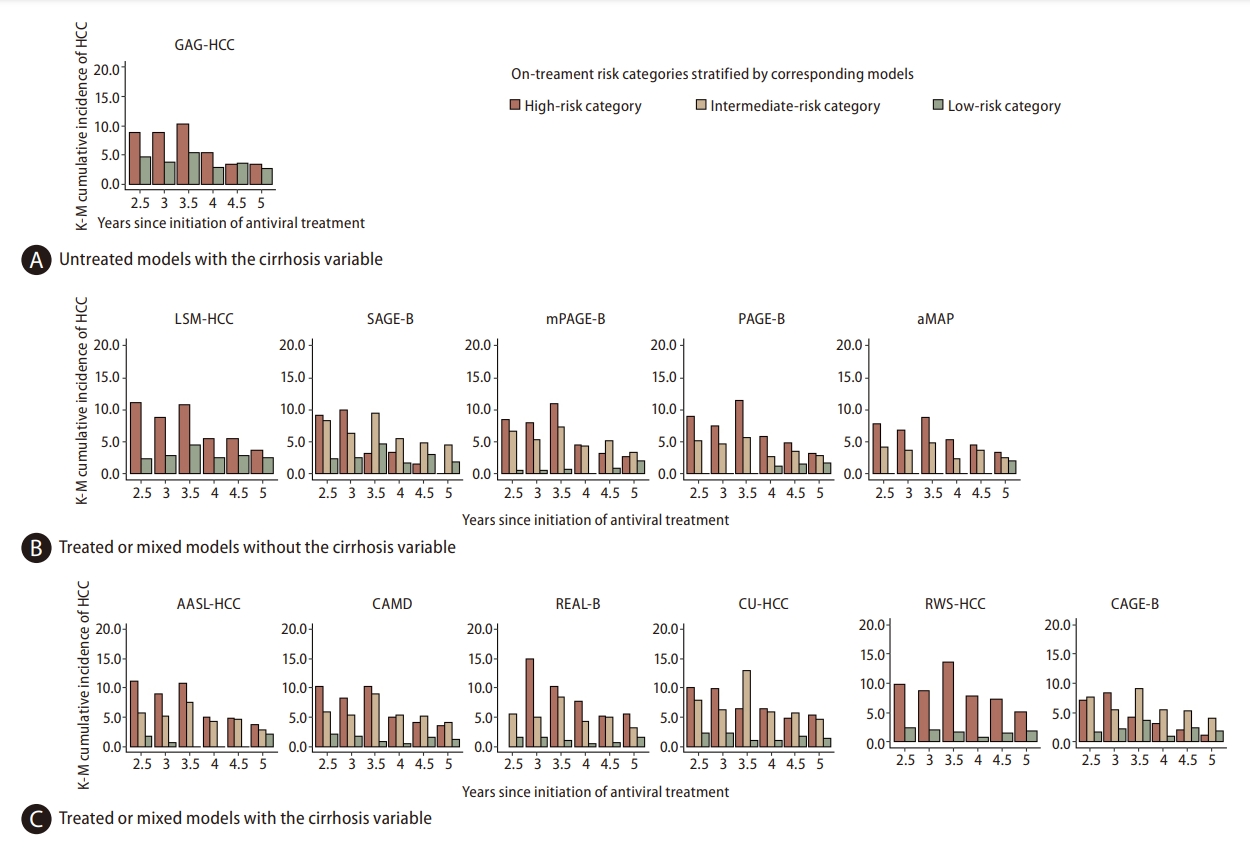
In the original reports, 12 models recommended score cutoffs that stratified patients into low, intermediate, and high-risk groups (Appendix 1, Fig. 3, Appendix 6). For treated or mixed models without the cirrhosis variable, HCC incidence did not significantly differ among the three risk groups according to on-treatment scores after year 3.5, except for mPAGE-B, which remained significant until year 4 (P-value=0.0481). For the untreated model with the cirrhosis variable, the recommended cutoff of 100 for model GAG-HCC failed to significantly stratify HCC risks between low and high-risk groups at most timepoints (P-values >0.05). For treated or mixed models with the cirrhosis variable, HCC risks remained significantly different across on-treatment risk groups until year 4 (P-values <0.05). The recommended cutoff value of 4.5 for the RWS-HCC model significantly distinguished risk groups even at 5 years of AVT (1.80% in the low-risk group and 5.15% in the high-risk group, P-value=0.0115).
However, the difference in HCC incidence between the high-risk and intermediate-risk groups gradually diminished with prolonged AVT (Fig. 3). For the mPAGE-B, CAMD, CAGE-B, and SAGE-B models, HCC risks were numerically higher in intermediate-risk groups than in high-risk groups according to on-treatment scores after year 4 (Fig. 3, Appendix 6).
HCC risk in patients stratified into low-risk groups was consistently found to be low for most models (ranging from 0.0% to 3.69%), except for GAG-HCC (2.72% to 4.61%) and LSM-HCC (2.32% to 4.58%). No HCC developed in the low-risk group defined by aMAP at a cutoff of 50 when using on-treatment scores from year 2.5 to year 4.5.

On-treatment model calibration for three-year HCC development

Models with the cirrhosis variable (CAMD and REAL-B) showed lower Brier scores than models without the cirrhosis variable (REACH-B and mPAGE-B). Irrespective of the on-treatment timepoint, REAL-B had the lowest Brier score, ranging from 0.022 to 0.046 (Appendix 7). The calibration plot revealed that REACH-B continuously underestimated HCC risks at all timepoints (Appendix 7). For mPAGE-B, CAMD, and REAL-B, the HCC risks were only well calibrated for patients within the low and relatively low-risk quantiles predicted by serial on-treatment model scores (Appendix 7).

Sensitivity and subgroup analysis

Sensitivity analysis with the complete-case datasets or using pretreatment cirrhosis rather than on-treatment cirrhosis showed similar results (Appendix 8). Subgroup analysis in patients with cirrhosis or patients stratified as intermediate or high-risk categories by the original models at the initiation of AVT demonstrated lower AUROCs than in the total cohort for most models (Appendix 9). The relative merits of models with the cirrhosis variable were not preserved in these high-risk subgroup patients (Appendix 9).

DISCUSSION

In this study, we validated and compared the predictive performance of 17 published HCC models in a prospective CHB cohort receiving long-term AVT. The predictability of all HCC risk models decreased with the prolongation of AVT, with modest to poor discriminations when using on-treatment values for AVT from years 2.5 to 5. However, models with the cirrhosis variable, derived from treated, untreated, or mixed CHB patients, achieved higher discrimination than models without the cirrhosis variable. We also found that the reported cutoffs for HCC risk stratification might require some amendment in the era of long-term AVT.
The key finding of the present study is that the predictability of the models attenuates when using serial on-treatment values in long-term AVT. A previous report on Caucasian patients with CHB also found that the performances were suboptimal when estimated at year 5 of AVT for PAGE-B, CU-HCC, or GAG-HCC [25]. Two possible reasons might explain this decreasing trend. First, long-term antiviral treatment modifies the baseline HCC risks evaluated by the values of key predictive variables such as HBV DNA, ALT, AST, PLT, and LSM before AVT [9,10]. Therefore, if calculated with on-treatment values, the prognostic significance of these predictive variables in existing HCC models was lowered after long-term AVT. Our study showed this by the diminishing trend in HR estimates of each variable (Appendix 10). Second, patient age, an independent risk factor for HCC, increases with the prolonged duration of AVT. This leads to an increase in the model score of HCC risk. The relative weights of these on-treatment predictors might change with long-term AVT. Thus, the model scores that were based on the relative weights of predictors at pretreatment or early on-treatment timepoints without including dynamic changes in the key predictors would perform suboptimally after long-term AVT. Future studies are required to investigate whether the adjustment of the relative weights of these predictors and the use of artificial intelligence might help to improve the predictability of model scores during long-term AVT.
Nevertheless, the performance of models containing cirrhosis as a variable generally descended more slowly than those of other models. Cirrhosis is a crucial risk factor for HCC development regardless of the use of antiviral drugs [26], but it could be regressed with long-term AVT. Indeed, the proportion of patients with cirrhosis in our validation cohort decreased from 62.9% at pretreatment to 35.8% at treatment year 5. Furthermore, cirrhosis is also a more stable factor and less susceptible to acute flares than other indicators [27]. Therefore, it is not surprising that the inclusion of cirrhosis would allow for better discrimination of HCC [28]. The inclusion of other on-treatment predictors that also gauged the severity of liver fibrosis (e.g., LSM, PLT, or ALB) [29-31] did not add significant value during long-term AVT in our cohort. Taken together, this evidence suggests that models that include the cirrhosis variable might be better options for HCC surveillance in CHB patients on long-term AVT [26].
Furthermore, an amendment to the original cutoffs for HCC risk stratification might be required when applying model scores in patients using AVT long-term. Accurate cutoff values are essential for stratifying HCC risks and optimizing HCC surveillance in patients with CHB. Using the originally recommended cutoffs, we found that the magnitude of the difference in HCC risks between the high and intermediate-risk groups was lessened with the prolongation of AVT. Therefore, further optimization for cutoffs to identify truly high-risk patients would be justified. On the other hand, the three-year HCC risk in the low-risk group defined by GAG-HCC and LSM-HCC was relatively higher (2.32% to 4.61%) in our validation cohort. These HCC risk values are far beyond the recommended surveillance threshold of 0.2%/year in hepatitis B carriers and near or exceeding the threshold of 1.5%/year in patients with cirrhosis [32]. In the late antiviral period, an amendment to these cutoffs might help to identify patients with minimal HCC risks, enable less intensive HCC surveillance, and spare patients from undue anxiety and unnecessary interventions.
In addition, subgroup analysis showed that the AUROCs of HCC prediction models decreased more profoundly with AVT in patients with pretreatment cirrhosis than in the total cohort. Our results are consistent with previous findings of numerically lower AUROCs in cirrhotic patients using pretreatment model scores [33-36]. In our study, we found that the difference in the risk scores between patients with HCC development and those without was less obvious in cirrhotic patients than in the total cohort and further narrowed with the length of AVT. It is probable that in this relatively “homogeneous” subgroup, the predictive value of conventional predictors themselves or the classification of the predictors might be attenuated in discriminating HCC development [23]. Future development of novel biomarkers is warranted to improve the predictability for these high-risk CHB patients [37].
With a follow-up of eight years after the initiation of AVT, our external validation conducted in patients from 22 tertiary medical centers provided meaningful results on the utility of the 17 HCC prediction models. In addition, the comprehensive statistical analysis, including sensitivity and subgroup analysis with multiple imputation, increased the robustness of the study results.
However, several limitations should be mentioned. First, our study population involved only a single ethnicity. Thus, these results cannot be generalized to other ethnic groups without further validation. Second, since the data were generated from a cohort treated with entecavir, it is not clear whether the conclusions may apply to patients treated with other nucleoside/nucleotide analogs. Third, the relatively small number of endpoints might result in a statistically insignificant difference in model comparisons. Fourth, calibrations were not evaluated for all models due to limited parameters reported in the original literature. Further external validation studies with larger sample sizes and broader population characteristics are needed to confirm the findings.
In conclusion, our study found that the performance of existing HCC prediction models in CHB patients with long-term AVT decreased to modest or poor levels. In addition to the baseline measurements, on-treatment modification of HCC risk factors should be emphasized in the future refinement and novel development of HCC prediction models for patients on long-term AVT.

ACKNOWLEDGMENTS

This work was supported by the National Major Science and Technology Projects of China (No. 2018ZX10302204, 2017ZX10203202-003), the High-level Public Health Technical Talents of the Beijing Municipal Health Commission (No. XUEKEGUGAN-010-018), and Beijing Municipal Administration of HospitalsIncubating Program (No. PX2023005).

FOOTNOTES

Authors’ contribution
Hong You, Yuanyuan Kong, and Jidong Jia designed the study. Xiaoning Wu and Xiaoqian Xu drafted the manuscript and prepared the figures and tables. Xiaoqian Xu performed the data analysis. Hong You, Yuanyuan Kong, Jidong Jia and Hwai-I Yang revised the manuscript. Jialing Zhou, Yameng Sun, Huiguo Ding, Wen Xie, Guofeng Chen, Anlin Ma, Hongxin Piao, Bingqiong Wang, Shuyan Chen, Tongtong Meng, and Xiaojuan Ou collected the data and interpreted the results. All authors approved the final version of the paper.
Conflicts of Interest
The authors have no conflictsto disclose.

SUPPLEMENTAL MATERIAL

Supplementary material is available at Clinical and Molecular Hepatology website (http://www.e-cmh.org).
Appendix 1.
Overview of predicting variables, scores and/or formulas in 17 HCC risk prediction models
cmh-2023-0121-Supplementary-1.pdf
Appendix 2.
Study design
cmh-2023-0121-Supplementary-2.pdf
Appendix 3.
Dynamic change of on-treatment scores of risk prediction models
cmh-2023-0121-Supplementary-3.pdf
Appendix 4.
Dynamic change on discriminations of risk predicting models since initiation of AVT until on-treatment year 5. The figure revealed that from the initiation of AVT until year 5, a steadily decreasing trend on AUROC was observed for all models when using serial on-treatment variables.
Note: Data using baseline (Year 0)1 and on-therapy variables2 during the first two years (Year 0.5 to year 2) have been ever published on: Reference 1: Wu S, Zeng N, Sun F, Zhou J, Wu X, Sun Y, et al. Hepatocellular carcinoma prediction models in chronic hepatitis B: A systematic review of 14 models and external validation. Clin Gastroenterol Hepatol 2021;19:2499-2513. Reference 2: Wu S, Zhou J, Wu X, Sun Y, Wang B, Kong Y, et al. Comparative performance of 14 HCC prediction models in CHB: A dynamic validation at serial on-treatment timepoints. Am J Gastroenterol 2022;117:1444-1453.
cmh-2023-0121-Supplementary-4.pdf
Appendix 5.
Head-to-head comparison of 17 HCC risk prediction models’ discrimination using on-treatment values at different timepoints
cmh-2023-0121-Supplementary-5.pdf
Appendix 6.
K-M cumulative incidence of HCC in low/intermediate/high risk groups according to each risk prediction model cut-off values using different on treatment values
cmh-2023-0121-Supplementary-6.pdf
Appendix 7.
Calibration of REACH-B, mPAGE-B, CAMD and REAL-B models at different on-treatment timepoints
cmh-2023-0121-Supplementary-7.pdf
Appendix 8.
Discrimination of risk predicting models in complete-case analysis or using cirrhosis at initiation of AVT in calculation of on-treatment scores
cmh-2023-0121-Supplementary-8.pdf
Appendix 9.
Discrimination of risk predicting models in subgroup of high-risk CHB patients
cmh-2023-0121-Supplementary-9.pdf
Appendix 10.
Dynamic change on HR for each individual predictor since initiation of AVT until on-treatment year 5. The figure revealed that the HR estimates of each individual variable diminished with the prolongation of AVT. This indicated the predictability of a single indicator constituting the scoring formula attenuated over time.
Notes: The Reference group for HRs of ALT 15–45 U/L, ALT >45 U/L, ALB<35 g/dL, TBIL>18 μmol/L, PLT<150*109/L, LSM 8–13 kPa, LSM >13 kPa, AFP 4.1–20 μg/L, AFP >20 μg/L, log HBV DNA 4–6 IU/mL, log HBV DNA >6 IU/mL were: AL<15 U/L, ALB>35 g/dL, TBIL ≤18 μmol/L, PLT ≥150 * 109/L,LSM <8 kPa, AFP <4.1 μg/L, log HBV DNA ≤4 IU/mL respectively. Missing HR estimates mean that calculations for HR were not applicable due to zero endpoints in the reference group or in the estimated group.
cmh-2023-0121-Supplementary-10.pdf

Figure 1.
AUROCs of risk prediction modelscores at different on-treatment timepoints. The AUROCs demonstrated the predictability of model scores for the three-year development of HCC after each on-treatment timepoint. The dotted lines represent criteria generally accepted to judge the discrimination: less than 0.50 (red dotted line) indicates that the predictions are no better than chance; less than 0.60 (gray dotted line) reflects poor discrimination; 0.60 to 0.75 (green dotted line), indicates possibly helpful discrimination; and greater than 0.75, indicates clearly useful discrimination. During long-term AVT, the AUROCs were poor for untreated models without the cirrhosis variable (A), were possibly helpful for treated or mixed models without the cirrhosis variable (C), and were numerically higher for models with the cirrhosis variable derived from treated, mixed, or untreated CHB patients (B and D) compared with other models (A and C). AUROC, area under receiver operating curve; HCC, hepatocellular carcinoma; CHB, chronic hepatitis B; AVT, antiviral therapy.

cmh-2023-0121f1.jpg
Figure 2.
Hazard ratios of risk prediction modelscores at different on-treatment timepoints. The hazard ratio (HR) estimates demonstrate the magnitude of increase in three-year hepatocellular carcinoma (HCC) risks associated with every 10% increase in model scores at each on-treatment timepoint. The 95% confidence interval (CI) covering the value of 1.0 demonstrated a nonsignificant correlation of on-treatment scores with HCC incidence. The HRs were nonsignificant at either timepoint for untreated models without the cirrhosis variable (A), became nonsignificant after antiviral therapy (AVT) year 3.5 for treated or mixed models without the cirrhosis variable (C), and remained significant until AVT year 5 for most models with cirrhosis as a variable derived from treated, mixed, or untreated CHB patients (B and D). For all models, the HR estimateslessened over time.

cmh-2023-0121f2.jpg
Figure 3.
Cumulative three-year HCC incidence by risk group stratified by on-treatment model scores using original cutoffs. At each ontreatment timepoint, the subsequent three-year HCC incidence for high-risk (red bars), intermediate-risk (yellow bars), and low-risk categories (green bars) classified using on-treatment model scores were calculated for each model. The differences in HCC incidence between the high-risk and intermediate-risk groups gradually diminished with prolonged AVT. With the original cutoffs, the true HCC incidence across low-, intermediate-, and high-risk levels became non-significant using scores after AVT year 3.5 for untreated models with the cirrhosis variable (A) and treated or mixed models without cirrhosis (B), and became non-significant using scores after AVT year 4 for treated or mixed models with cirrhosis (C). HCC, hepatocellular carcinoma; AVT, antiviral therapy.

cmh-2023-0121f3.jpg

cmh-2023-0121f4.jpg
Table 1.
Patient characteristics at different on-treatment timepoints
Variables Before AVT (n=660) On-treatment timepoints
Year 2.5 (n=660) Year 3 (n=640) Year 3.5 (n=622) Year 4 (n=603) Year 4.5 (n=589) Year 5 (n=562)
Demographic characteristics
Age (yr)* 43.0±10.8 45.5±10.8 46.0±10.7 46.5±10.7 46.9±10.6 47.4±10.6 48.0±10.6
Male (%) 497 (75.3) 497 (75.3) 482 (75.3) 470 (75.6) 456 (75.6) 446 (75.7) 426 (75.8)
Alcohol (%) 151 (22.9) 151 (22.9) 148 (23.1) 146 (23.5) 142 (23.5) 137 (23.3) 136 (24.2)
Medical history
Diabetes mellitus (%) 21 (3.2) 21 (3.2) 18 (2.8) 17 (2.7) 17 (2.8) 15 (2.5) 14 (2.5)
HCC family history (%) 97 (14.7) 97 (14.7) 95 (14.8) 94 (15.1) 90 (14.9) 89 (15.1) 83 (14.8)
Cirrhosis (%) 415 (62.9) 298 (45.2) 291 (45.5) 276 (44.4) 266 (44.1) 246 (41.8) 201 (35.8)
Laboratory markers
HBeAg positive (%) 368 (55.8) 214 (32.4) 184 (28.7) 189 (30.4) 188 (31.2) 115 (19.5) 102 (18.1)
HBV DNA (log IU/mL) 5.8 (4.3, 6.8) 1.0 (0.0, 1.0) 1.0 (0.0, 1.0) 1.0 (0.0, 1.0) 1.0 (0.0, 1.0) 1.0 (0.0, 1.0) 0.5 (0.0, 1.0)
ALT (U/L) 57.5 (37.0, 110.0) 23.0 (17.0, 32.0) 22.0 (16.0, 31.0) 23.0 (16.4, 31.0) 22.0 (16.0, 29.0) 22.0 (15.4, 29.0) 21.0 (16.0, 29.0)
AST (U/L) 48.0 (34.0, 79.0) 23.0 (19.6, 28.0) 23.0 (19.0, 28.0) 22.8 (19.0, 27.8) 22.0 (19.0, 26.6) 22.0 (18.0, 26.2) 22.0 (18.2, 26.0)
PLT (109/L) 123.5 (83.0, 170.3) 146.6 (101.0, 192.3) 152.0 (106.0, 197.0) 157.9 (114.0, 203.0) 158.0 (113.5, 201.5) 165.0 (117.0, 206.0) 162.0 (118.0, 201.0)
ALB (g/dL) 42.7 (38.7, 45.5) 46.4 (44.2, 48.6) 46.6 (44.3, 49.0) 46.5 (44.0, 49.0) 47.0 (44.6, 49.3) 47.0 (44.9, 49.9) 46.9 (44.7, 49.0)
TBIL (μmol/L) 16.7 (12.1, 23.0) 15.4 (11.7, 21.9) 15.3 (11.6, 21.4) 15.7 (11.6, 20.0) 15.3 (11.7, 19.9) 15.4 (11.8, 21.4) 15.6 (11.7, 20.2)
LSM (kPa) 14.6 (10.1, 22.3) 7.9 (5.6, 11.7) 7.6 (5.4, 10.4) 7.5 (5.5, 10.5) 7.5 (5.3, 10.3) 6.8 (5.4, 10.3) 7.4 (5.5, 10.3)
AFP (μg/L) 5.5 (2.9, 16.1) 2.5 (1.7, 3.7) 2.5 (1.8, 3.6) 2.4 (1.6, 3.3) 2.2 (1.5, 3.2) 2.2 (1.5, 3.2) 2.1 (1.3, 2.9)
HCC events in subsequent three years
- 33 30 28 21 20 16
Median time of follow-up in subsequent three years (yr)
- 2.98 2.98 2.98 2.99 2.97 2.94

AFP, alpha-fetoprotein; ALB, albumin; ALT, alanine aminotransferase; AST, aspartate aminotransferase; AVT, antiviral treatment; HBeAg, hepatitis B e antigen; HBV, hepatitis B virus; HCC, hepatocellular carcinoma; LSM, liver stiffness measurement; PLT, platelet; TBIL, total bilirubin.

* Age was expressed as mean±standard deviation.

Continuous laboratory markers were expressed as median (25% quartile, 75% quartile).

Table 2.
Dynamic change of risk prediction model scores at different on-treatment timepoints
Models Before AVT (n=660) On-treatment timepoints
Year 2.5 (n=660) Year 3 (n=640) Year 3.5 (n=622) Year 4 (n=603) Year 4.5 (n=589) Year 5 (n=562)
Untreated models without the cirrhosis variable
REACH-B 10.14±2.48 5.93±2.14 5.87±2.07 6.13±2.12 6.07±2.05 5.98±2.03 5.97±2.00
NGM1 8.32±2.48 6.66±2.51 6.69±2.39 6.77±2.45 6.94±2.47 6.60±2.37 6.73±2.34
NGM2 11.20±2.67 7.87±3.41 7.81±3.17 7.95±3.31 8.13±3.34 7.43±3.08 7.51±2.97
Untreated models with the cirrhosis variable
GAG-HCC 92.92±22.05 75.88±22.43 76.49±21.69 76.55±21.57 76.88±21.82 76.20±21.13 74.73±20.98
Treated or mixed models without the cirrhosis variable
mREACH-BI 8.03±2.18 6.55±2.34 6.38±2.23 6.60±2.26 6.60±2.25 6.47±2.21 6.49±2.19
mREACH-BII 9.48±2.64 7.23±2.82 6.98±2.68 7.17±2.71 7.20±2.69 7.02±2.63 7.07±2.60
LSM-HCC 16.36±7.41 9.02±8.13 8.41±7.98 8.45±7.98 8.56±7.76 8.57±7.89 8.85±7.84
SAGE-B 7.04±3.47 5.30±3.31 5.20±3.15 5.23±3.15 5.37±3.08 5.44±3.11 5.56±3.00
mPAGE-B 10.33±3.24 9.98±3.18 10.08±3.07 10.00±2.99 10.22±3.05 10.15±2.98 10.36±2.93
PAGE-B 14.49±4.57 14.00±4.88 14.03±4.78 13.79±4.71 14.09±4.77 13.90±4.72 14.22±4.69
aMAP 60.36±7.56 58.74±7.52 58.58±7.44 58.47±7.44 58.51±7.43 58.43±7.37 58.79±7.30
Treated or mixed models with the cirrhosis variable
AASL-HCC 13.25±6.69 11.37±6.51 11.60±6.43 11.46±6.37 11.67±6.52 11.41±6.29 10.93±6.19
CAMD 10.10±5.14 9.30±5.21 9.57±5.11 9.49±5.07 9.70 ±5.22 9.60±5.02 9.40±4.94
REAL-B 5.11±2.13 4.57±2.07 4.64±2.04 4.57±1.97 4.69±2.05 4.59±1.96 4.54±1.91
CU-HCC 16.12±11.15 8.68±8.51 8.74±8.54 8.50±8.18 8.52±8.49 8.30±8.29 7.36±8.18
RWS-HCC 4.57±2.07 3.26±1.86 3.28±1.80 3.22±1.74 3.17±1.74 3.14±1.73 2.91±1.74
CAGE-B 7.32±3.91 6.66±3.56 6.69±3.46 6.70±3.44 6.86±3.41 6.90±3.43 7.03±3.34

Model scores were expressed as mean±standard deviation.

AVT, antiviral treatment; HCC, hepatocellular carcinoma; LSM, liver stiffness measurement.

Table 3.
Pooled AUROCs by type of models and on-treatment timepoints
On-treatment timepoints Untreated models without the cirrhosis variable AUROC (95% CI) Untreated models with the cirrhosis variable AUROC (95% CI) Treated or mixed models without the cirrhosis variable AUROC (95% CI) Treated or mixed models with the cirrhosis variable AUROC (95% CI)
Year 2.5 0.59 (0.53, 0.66) 0.71 (0.62, 0.78) 0.68 (0.65, 0.71) 0.72 (0.68, 0.75)
Year 3 0.59 (0.53, 0.65) 0.69 (0.60, 0.77) 0.66 (0.63, 0.70) 0.69 (0.66, 0.73)
Year 3.5 0.55 (0.46, 0.63) 0.73 (0.65, 0.79) 0.62 (0.59, 0.66) 0.71 (0.68, 0.74)
Year 4 0.56 (0.49, 0.63) 0.72 (0.64, 0.78) 0.64 (0.61, 0.68) 0.73 (0.70, 0.76)
Year 4.5 0.51 (0.45, 0.58) 0.65 (0.55, 0.74) 0.61 (0.57, 0.65) 0.65 (0.61, 0.69)
Year 5 0.54 (0.46, 0.62) 0.71 (0.56, 0.82) 0.62 (0.55, 0.66) 0.68 (0.63, 0.73)

AUROC, area under receiver operating curve; CI, confidence interval.

Abbreviations

AFP
alpha fetoprotein
ALT
alanine aminotransferase
AVT
antiviral therapy
AUROC
area under the receiver operating curve
CHB
chronic hepatitis B
CI
confidence intervals
HBV
Hepatitis B virus
HCC
hepatocellular carcinoma
HR
hazard ratio
LSM
liver stiffness measurement

REFERENCES

1. Yip TC, Wong GL, Chan HL, Tse YK, Lam KL, Lui GC, et al. HBsAg seroclearance further reduces hepatocellular carcinoma risk after complete viral suppression with nucleos(t)ide analogues. J Hepatol 2019;70:361-370.
crossref pmid
2. Su TH, Hu TH, Chen CY, Huang YH, Chuang WL, Lin CC, et al. Four-year entecavir therapy reduces hepatocellular carcinoma, cirrhotic events and mortality in chronic hepatitis B patients. Liver Int 2016;36:1755-1764.
crossref pmid pdf
3. Wu S, Zhou J, Wu X, Sun Y, Wang B, Kong Y, et al. Comparative performance of 14 HCC prediction models in CHB: A dynamic validation at serial on-treatment timepoints. Am J Gastroenterol 2022;117:1444-1453.
crossref pmid
4. Chan HL, Fung S, Seto WK, Chuang WL, Chen CY, Kim HJ, et al. Tenofovir alafenamide versus tenofovir disoproxil fumarate for the treatment of HBeAg-positive chronic hepatitis B virus infection: a randomised, double-blind, phase 3, non-inferiority trial. Lancet Gastroenterol Hepatol 2016;1:185-195. Erratum in: Lancet Gastroenterol Hepatol 2016;1:e2.

5. Wong GL, Wong VW. Risk prediction of hepatitis B virus-related hepatocellular carcinoma in the era of antiviral therapy. World J Gastroenterol 2013;19:6515-6522.
crossref pmid pmc
6. Wu S, Kong Y, Piao H, Jiang W, Xie W, Chen Y, et al. On-treatment changes of liver stiffness at week 26 could predict 2-year clinical outcomes in HBV-related compensated cirrhosis. Liver Int 2018;38:1045-1054.
crossref pmid pdf
7. Wu X, Zhou J, Sun Y, Ding H, Chen G, Xie W, et al. Prediction of liver-related events in patients with compensated HBV-induced cirrhosis receiving antiviral therapy. Hepatol Int 2021;15:82-92.
crossref pmid pdf
8. Wu S, Zeng N, Sun F, Zhou J, Wu X, Sun Y, et al. Hepatocellular carcinoma prediction models in chronic hepatitis B: A systematic review of 14 models and external validation. Clin Gastroenterol Hepatol 2021;19:2499-2513.
crossref pmid
9. Fan R, Papatheodoridis G, Sun J, Innes H, Toyoda H, Xie Q, et al. aMAP risk score predicts hepatocellular carcinoma development in patients with chronic hepatitis. J Hepatol 2020;73:1368-1378.
crossref pmid
10. Papatheodoridis GV, Sypsa V, Dalekos GN, Yurdaydin C, Van Boemmel F, Buti M, et al. Hepatocellular carcinoma prediction beyond year 5 of oral therapy in a large cohort of Caucasian patients with chronic hepatitis B. J Hepatol 2020;72:1088-1096.
crossref pmid
11. Yang HI, Yuen MF, Chan HL, Han KH, Chen PJ, Kim DY, et al. Risk estimation for hepatocellular carcinoma in chronic hepatitis B (REACH-B): development and validation of a predictive score. Lancet Oncol 2011;12:568-574.
crossref pmid
12. Yang HI, Sherman M, Su J, Chen PJ, Liaw YF, Iloeje UH, et al. Nomograms for risk of hepatocellular carcinoma in patients with chronic hepatitis B virus infection. J Clin Oncol 2010;28:2437-2444.
crossref pmid
13. Yuen MF, Tanaka Y, Fong DY, Fung J, Wong DK, Yuen JC, et al. Independent risk factors and predictive score for the development of hepatocellular carcinoma in chronic hepatitis B. J Hepatol 2009;50:80-88.
crossref pmid
14. Lee HW, Yoo EJ, Kim BK, Kim SU, Park JY, Kim DY, et al. Prediction of development of liver-related events by transient elastography in hepatitis B patients with complete virological response on antiviral therapy. Am J Gastroenterol 2014;109:1241-1249.
crossref pmid pdf
15. Wong GL, Chan HL, Wong CK, Leung C, Chan CY, Ho PP, et al. Liver stiffness-based optimization of hepatocellular carcinoma risk score in patients with chronic hepatitis B. J Hepatol 2014;60:339-345.
crossref pmid
16. Kim JH, Kim YD, Lee M, Jun BG, Kim TS, Suk KT, et al. Modified PAGE-B score predicts the risk of hepatocellular carcinoma in Asians with chronic hepatitis B on antiviral therapy. J Hepatol 2018;69:1066-1073.
crossref pmid
17. Papatheodoridis G, Dalekos G, Sypsa V, Yurdaydin C, Buti M, Goulis J, et al. PAGE-B predicts the risk of developing hepatocellular carcinoma in Caucasians with chronic hepatitis B on 5-year antiviral therapy. J Hepatol 2016;64:800-806.
crossref pmid
18. Yu JH, Suh YJ, Jin YJ, Heo NY, Jang JW, You CR, et al. Prediction model for hepatocellular carcinoma risk in treatment-naive chronic hepatitis B patients receiving entecavir/tenofovir. Eur J Gastroenterol Hepatol 2019;31:865-872.
crossref pmid
19. Hsu YC, Yip TC, Ho HJ, Wong VW, Huang YT, El-Serag HB, et al. Development of a scoring system to predict hepatocellular carcinoma in Asians on antivirals for chronic hepatitis B. J Hepatol 2018;69:278-285. Erratum in: J Hepatol 2019;70:581.

20. Yang HI, Yeh ML, Wong GL, Peng CY, Chen CH, Trinh HN, et al. Real-World effectiveness from the Asia Pacific Rim Liver Consortium for HBV risk score for the prediction of hepatocellular carcinoma in chronic hepatitis B patients treated with oral antiviral therapy. J Infect Dis 2020;221:389-399.
crossref pmid pdf
21. Wong VW, Chan SL, Mo F, Chan TC, Loong HH, Wong GL, et al. Clinical scoring system to predict hepatocellular carcinoma in chronic hepatitis B carriers. J Clin Oncol 2010;28:1660-1665.
crossref pmid
22. Poh Z, Shen L, Yang HI, Seto WK, Wong VW, Lin CY, et al. Real-world risk score for hepatocellular carcinoma (RWS-HCC): a clinically practical risk predictor for HCC in chronic hepatitis B. Gut 2016;65:887-888.
crossref pmid
23. Alba AC, Agoritsas T, Walsh M, Hanna S, Iorio A, Devereaux PJ, et al. Discrimination and calibration of clinical prediction models: Users’ guides to the medical literature. JAMA 2017;318:1377-1384.
crossref pmid
24. Benjamini Y, Hochberg Y. Controlling the false discovery rate: a practical and powerful approach to multiple hypothesis testing. J R Stat Soc Series B Stat Methodol 1995;57:289-300.

25. Papatheodoridis GV, Idilman R, Dalekos GN, Buti M, Chi H, van Boemmel F, et al. The risk of hepatocellular carcinoma decreases after the first 5 years of entecavir or tenofovir in Caucasians with chronic hepatitis B. Hepatology 2017;66:1444-1453.
crossref pmid pdf
26. Yu JH, Cho SG, Jin YJ, Lee JW. The best predictive model for hepatocellular carcinoma in patients with chronic hepatitis B infection. Clin Mol Hepatol 2022;28:351-361.
crossref pmid pmc pdf
27. Croagh CM, Lubel JS. Natural history of chronic hepatitis B: phases in a complex relationship. World J Gastroenterol 2014;20:10395-10404.
crossref
28. Abu-Amara M, Cerocchi O, Malhi G, Sharma S, Yim C, Shah H, et al. The applicability of hepatocellular carcinoma risk prediction scores in a North American patient population with chronic hepatitis B infection. Gut 2016;65:1347-1358.
crossref pmid
29. Marcellin P, Ziol M, Bedossa P, Douvin C, Poupon R, de Lédinghen V, et al. Non-invasive assessment of liver fibrosis by stiffness measurement in patients with chronic hepatitis B. Liver Int 2009;29:242-247.
crossref pmid
30. Karasu Z, Tekin F, Ersoz G, Gunsar F, Batur Y, Ilter T, et al. Liver fibrosis is associated with decreased peripheral platelet count in patients with chronic hepatitis B and C. Dig Dis Sci 2007;52:1535-1539.
crossref pmid pdf
31. Hsu YC, Tseng CH, Huang YT, Yang HI. Application of risk scores for hepatocellular carcinoma in patients with chronic hepatitis B: Current status and future perspective. Semin Liver Dis 2021;41:285-297.
crossref pmid
32. Bruix J, Sherman M. Management of hepatocellular carcinoma. Hepatology 2005;42:1208-1236.
crossref pmid
33. Lee JS, Lee HW, Lim TS, Min IK, Lee HW, Kim SU, et al. External validation of the FSAC model using on-therapy changes in noninvasive fibrosis markers in patients with chronic hepatitis B: A multicenter study. Cancers (Basel) 2022;14:711.
crossref pmid pmc
34. Yip TC, Wong GL, Wong VW, Tse YK, Liang LY, Hui VW, et al. Reassessing the accuracy of PAGE-B-related scores to predict hepatocellular carcinoma development in patients with chronic hepatitis B. J Hepatol 2020;72:847-854.
crossref pmid
35. Papatheodoridis GV, Dalekos GN, Yurdaydin C, Buti M, Goulis J, Arends P, et al. Incidence and predictors of hepatocellular carcinoma in Caucasian chronic hepatitis B patients receiving entecavir or tenofovir. J Hepatol 2015;62:363-370.
crossref pmid
36. Lee JS, Lim TS, Lee HW, Kim SU, Park JY, Kim DY, et al. Suboptimal performance of hepatocellular carcinoma prediction models in patients with hepatitis B virus-related cirrhosis. Diagnostics (Basel) 2022;13:3.
crossref pmid pmc
37. Kim SJ, Kim JM. Prediction models of hepatocellular carcinoma recurrence after liver transplantation: A comprehensive review. Clin Mol Hepatol 2022;28:739-753.
crossref pmid pmc pdf

Editorial Office
The Korean Association for the Study of the Liver
Room A1210, 53 Mapo-daero(MapoTrapalace, Dowha-dong), Mapo-gu, Seoul, 04158, Korea
TEL: +82-2-703-0051   FAX: +82-2-703-0071    E-mail: kasl@kams.or.kr
Copyright © The Korean Association for the Study of the Liver.         
COUNTER
TODAY : 1842
TOTAL : 1778988
Close layer