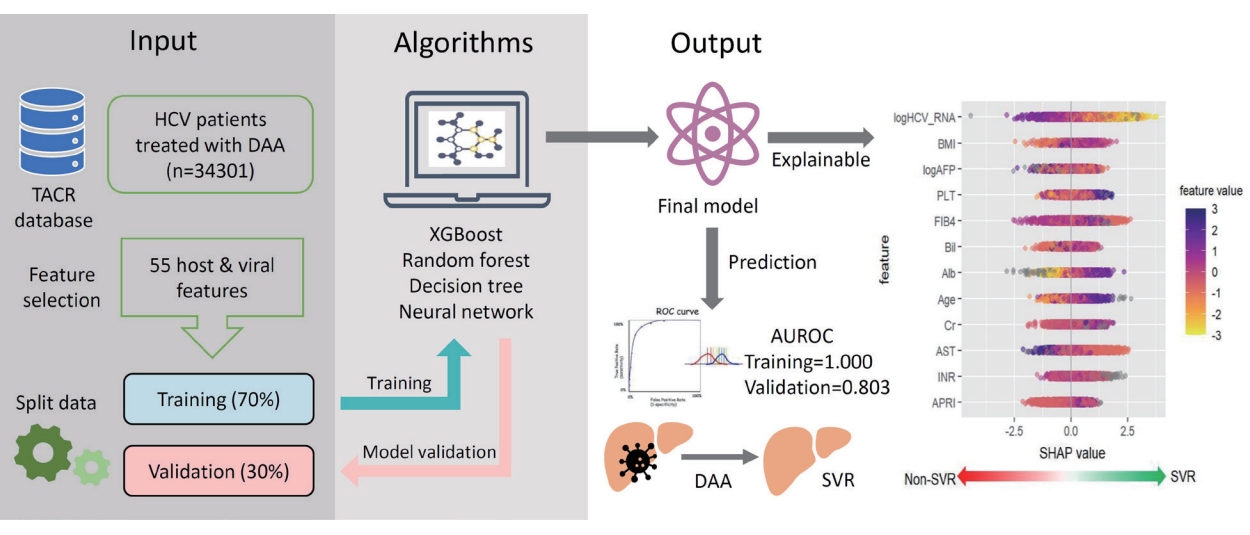
Clin Mol Hepatol > Volume 30(1); 2024 > Article
Lu, Huang, Hung, Tai, Mo, Kuo, Tseng, Lo, Bair, Wang, Huang, Yeh, Chen, Tsai, Huang, Lee, Yang, Huang, Chong, Chen, Yang, Yang, Cheng, Hsieh, Hu, Wu, Cheng, Chen, Zhou, Tsai, Kao, Lin, Wang, Lin, Lin, Su, Lee, Chang, Liu, Dai, Kao, Lin, Chuang, Peng, Tsai, Chen, Yu, and TACR Study Group: Artificial intelligence predicts direct-acting antivirals failure among hepatitis C virus patients: A nationwide hepatitis C virus registry program

ABSTRACT

Background/Aims

Despite the high efficacy of direct-acting antivirals (DAAs), approximately 1–3% of hepatitis C virus (HCV) patients fail to achieve a sustained virological response. We conducted a nationwide study to investigate risk factors associated with DAA treatment failure. Machine-learning algorithms have been applied to discriminate subjects who may fail to respond to DAA therapy.

Methods

We analyzed the Taiwan HCV Registry Program database to explore predictors of DAA failure in HCV patients. Fifty-five host and virological features were assessed using multivariate logistic regression, decision tree, random forest, eXtreme Gradient Boosting (XGBoost), and artificial neural network. The primary outcome was undetectable HCV RNA at 12 weeks after the end of treatment.

Results

The training (n=23,955) and validation (n=10,346) datasets had similar baseline demographics, with an overall DAA failure rate of 1.6% (n=538). Multivariate logistic regression analysis revealed that liver cirrhosis, hepatocellular carcinoma, poor DAA adherence, and higher hemoglobin A1c were significantly associated with virological failure. XGBoost outperformed the other algorithms and logistic regression models, with an area under the receiver operating characteristic curve of 1.000 in the training dataset and 0.803 in the validation dataset. The top five predictors of treatment failure were HCV RNA, body mass index, α-fetoprotein, platelets, and FIB-4 index. The accuracy, sensitivity, specificity, positive predictive value, and negative predictive value of the XGBoost model (cutoff value=0.5) were 99.5%, 69.7%, 99.9%, 97.4%, and 99.5%, respectively, for the entire dataset.

Conclusions

Machine learning algorithms effectively provide risk stratification for DAA failure and additional information on the factors associated with DAA failure.

Graphical Abstract

INTRODUCTION

Direct-acting antivirals (DAA) have changed the treatment landscape for patients infected with hepatitis C virus (HCV). However, despite the DAA efficacy being up to 97% across all HCV genotypes, approximately 1–3% of HCV patients fail to achieve a sustained virological response (SVR) [1,2]. Factors associated with DAA failure generally include decompensated liver cirrhosis, resistance-associated substitutions (RASs), the presence of hepatocellular carcinoma (HCC), prior treatment failures, and poor drug adherence [3,4]. As comprehensive HCV elimination programs are advocated worldwide, an increasing number of patients with HCV infection are expected to require DAA salvage therapy. Thus, all the risk factors associated with DAA failure must be considered simultaneously to reduce the retreatment burden.
Artificial intelligence (AI) emerged as a powerful tool for disease diagnosis and risk assessment in healthcare. Factors contributing to treatment failure vary among individuals, making such heterogeneous data and complex interactions difficult to evaluate through regression methods. Moreover, conventional statistical methods can only handle linear data. Alternatively, machine-learning (ML) approaches can process both linear and nonlinear information and recognize the hidden relationships between variables and outcomes in big data [5]. ML algorithms can be classified into supervised and unsupervised algorithms. Supervised ML is suitable for handling annotated data, whereas unsupervised ML can process datasets that lack class labels. Common supervised ML algorithms include decision trees (DT), random forest (RF), eXtreme Gradient Boosting (XGBoost), and artificial neural network (ANN) [6,7]. Thus, AI provides a new approach to understanding diseases by integrating multidimensional data with “automatic learning” [8]. Advances in AI have made it possible to serve as a decision-support tool and improve diagnostic quality in healthcare.
We conducted a real-world, multicenter study using the Taiwan HCV Registry (TACR) database, aiming to explore the risk factors associated with DAA failure using artificial intelligence. We applied artificial intelligence to quickly distinguish HCV patients prone to virological failure.

MATERIALS AND METHODS

Subjects

The TACR Program is a nationwide HCV-registered platform implemented by the Taiwan Association for the Study of the Liver since 2020 [9]. The TACR conducted a real-world, multicenter, prospective cohort study of DAA therapy. A total of 34301 chronic hepatitis C patients >=18 years old who received DAAs with available SVR12 data were enrolled in this study. Patients with HCV who died during treatment or were lost to follow-up within 12 weeks after the completion of therapy were excluded from our study. The baseline demographics and virological characteristics before and after antiviral therapy were recorded in the TACR database. The primary outcome was the achievement of sustained virological response (SVR12), defined as undetectable HCV RNA in the serum after 12 weeks of end-of-treatment. The choice of antiviral regimens followed the international HCV treatment guidelines [10,11] and the reimbursement criteria of the Taiwan National Health Insurance Administration [2]. This study was approved by the Institutional Review Board of Kaohsiung Medical University Hospital and adhered to the Declaration of Helsinki. Written informed consent was obtained from all the participants.

Machine learning models

The subjects were randomly assigned to a 70% training dataset (n=23,955) and a 30% validation dataset (n=10,346). Fifty-five host, virological, and on-treatment features were input into the ML models (Supplementary Table 1). The algorithms included DT, RF, XGBoost, and ANN. ML analysis was performed using the rpart, randomForest, xgboost, and neural network packages of R software (https://www.r-project.org/). As some algorithms cannot handle missing data, missing data (14.3%) were imputed using the k-nearest neighbor method before generating predictions [12]. The best model was used for risk stratification of patients with DAA treatment failure. Patients were further divided into subgroups using deciles of predicted risk probability to allow for more granular management of high-risk patients.
The performances of the ML models were assessed using the area under the receiver operating characteristic curve (AUROC), accuracy of the confusion matrix, precision-recall curve, and F1-score [13]. A precision-recall curve closer to the upper-right corner indicates better performance. The F1-score is the weighted average of precision and recall and is favorable under class imbalance in the dataset. The F1-score ranged from 0 to 1; the predictive model with an F1-score closer to 1 is considered better. The Delong test was used to compare the differences in the AUC of the ROC curves [14]. The codes for the ML models are presented in the Supplementary Materials.

Statistical analyses

Student’s t-test was used to compare continuous variables. Categorical variables were evaluated using the chi-square (X2) or Fisher’s exact test. Multivariate logistic regression analysis was performed to determine independent risk factors associated with treatment failure. Data were analyzed using the Statistical Package for the Social Sciences software (SPSS, version 26; IBM Co., Armonk, NY, USA). Statistical significance was defined as a two-tailed P-value <0.05.

RESULTS

Baseline demographics

The baseline demographics of the study participants are presented in Table 1, with no significant differences in age, sex, body mass index (BMI), biochemical data, cirrhosis, HCV genotypes, viral load, DAA regimens, HBV coinfection, or presence of HCC between the training and validation datasets.

Logistic regression analysis of the factors associated with DAA treatment failure

The overall DAA failure rate was 1.6%. In the univariate analysis, female, fibrosis-4 index (FIB-4), cirrhosis, decompensation, presence of HCC, HCV genotypes, higher HCV viral load, protease inhibitor-based DAA regimens, treatment experience, less DAA/ribavirin adherence, and severe adverse effects significantly increased the risk of DAA treatment failure. In biochemical examinations, lower albumin, platelet, and creatinine levels significantly increased the probability of non-SVR. Elevated aspartate aminotransferase (AST), bilirubin, prothrombin time, and hemoglobin A1c (HbA1c) levels significantly increase the likelihood of virological failure. In the multivariate analysis, the presence of cirrhosis and HCC, higher HbA1c, and less DAA adherence were independent risk factors for DAA treatment failure after adjustment for the variables with P-value <0.05 in the univariate analysis (Table 2).
We developed a conventional prediction model using logistic regression as follows:
Logistic regression (LR) model=3×Liver cirrhosis (yes=1, no=0)+4×HCC (yes=1, no=0)+1×HbA1c+33×DAA adherence (<20%=5, 20–40%=4, 40–60%=3, 60–80%=2, >80%=1)
The components of the LR model were the four independent risk factors in the multivariate logistic regression analyanalysis. The coefficient for each variable was derived from the odds ratio of the multivariate logistic regression analysis. The cutoff value for discriminating DAA failure was set at 40 using Youden’s index in the ROC curve analysis.

Performance of the predictive models

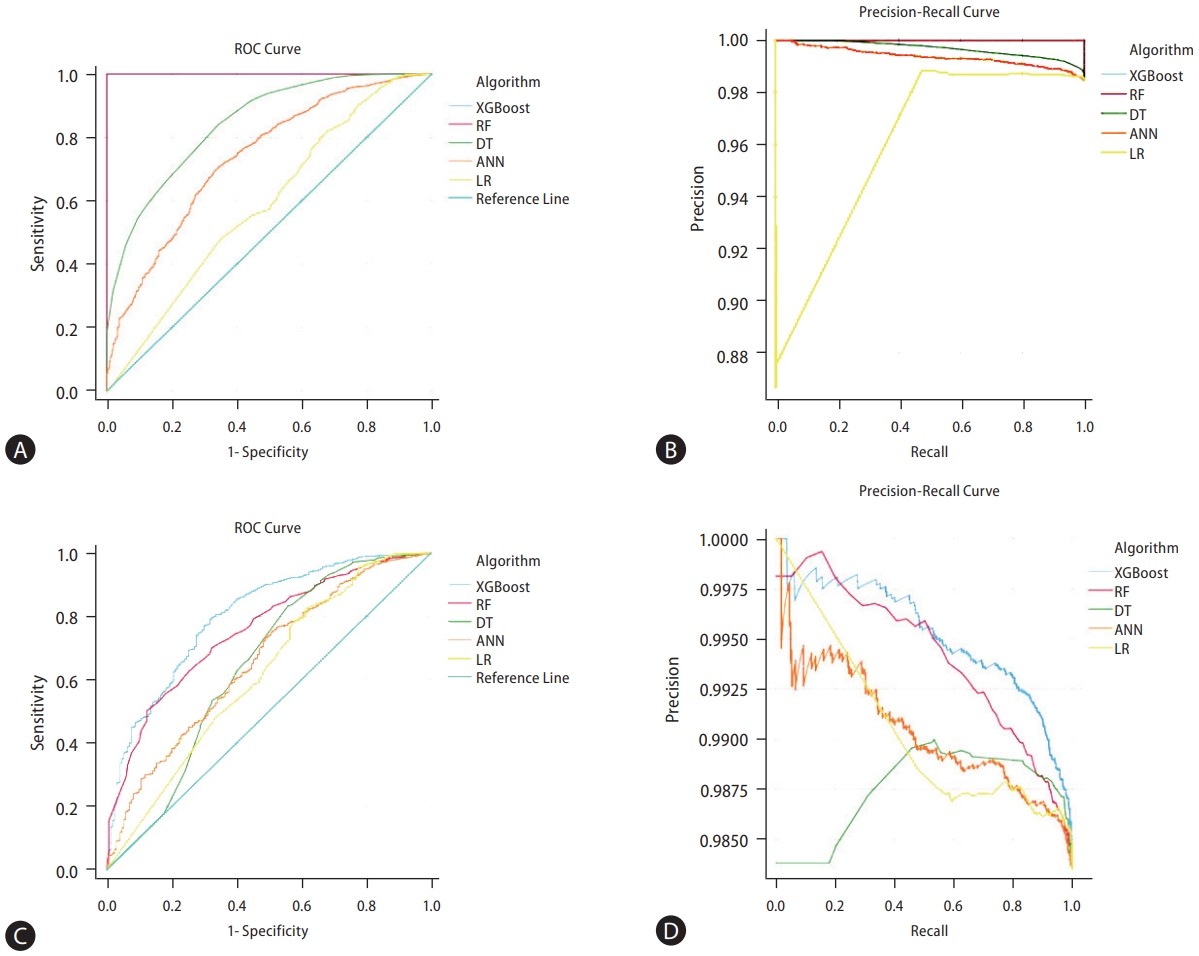
In the training dataset, the AUROC was 1.000, 1.000, 0.845, 0.736, and 0.588 for the XGBoost, random forest, decision tree, artificial neural network, and logistic regression models, respectively. The accuracy, precision, and recall rates of the prediction were 100% for both XGBoost and random forest. The F1 score achieved 1.00 in both the XGBoost and random forest algorithms (Fig. 1A, B, and Table 3).
In the validation dataset, the AUROC was 0.803, 0.756, 0.644, 0.658, and 0.616 for the XGBoost, random forest, decision tree, artificial neural network, and logistic regression models, respectively (Fig. 1C, D, and Table 3). The Delong test revealed the performance of XGBoost was superior to the random forest (P=0.021), decision tree (P=4.4×10⁻⁸), artificial neural network (P=5.4×10⁻⁹), and logistic regression model (P=2.5×10⁻¹⁰) (Table 4). The accuracy, precision, recall, and F1-score of XGBoost are 98.3%, 98.4%, 99.9%, and 0.992, respectively.

Risk stratification based on the XGBoost algorithm

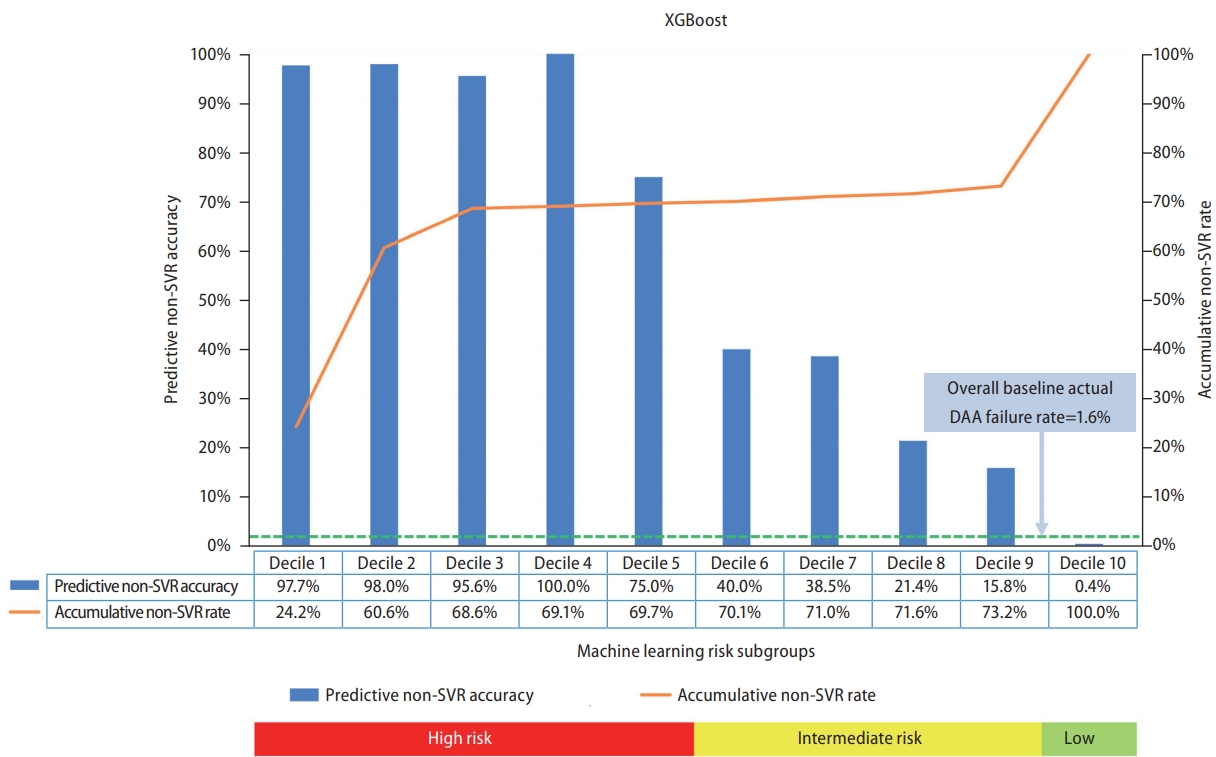
The overall HCV patients receiving DAA treatment were further stratified according to the XGBoost prediction results. XGBoost provides a risk coefficient between 0 and 1 for each case. The higher the coefficient, the higher the chance of achieving SVR. DAA efficacy was divided into ten subgroups based on risk coefficient deciles. Figure 2 shows the predicted non-SVR accuracy for each subgroup using the XGBoost algorithm. The participants were stratified into high-risk (decile 1–5), intermediate-risk (decile 6–9), and low-risk (decile 10) populations based on the risk coefficients. The DAA failure rate was 75–100% in the high-risk, 15.8–40.0% in the intermediate-risk, and 0.4% in the low-risk populations. The DAA failure rate among the top five deciles was substantially higher than that at baseline (1.6%). The accumulative non-SVR rate was 69.7% in the high-risk population. Among the 538 subjects for whom DAA treatment failed, 375 (69.7%) were successfully detected using the XGBoost model among the top five deciles (Fig. 2). When the cutoff value of the risk coefficient was set at 0.5, the accuracy, sensitivity, specificity, positive predictive value, and negative predictive value were 99.5%, 69.7%, 99.9%, 97.4%, and 99.5%, respectively (Supplementary Table 2).

Importance of predictors

The relative importance of DAA failure predictors was evaluated using the XGBoost algorithm in all cases. The x-axis represents the ratio of the number of times a variable is applied to the total number of trees. The top 12 predictors were body mass index, viral load, α-fetoprotein, bilirubin, platelets, FIB-4 index, creatinine, ALT, albumin, age, prothrombin time, and AST level (Supplementary Fig. 1).

SHAP summary plot

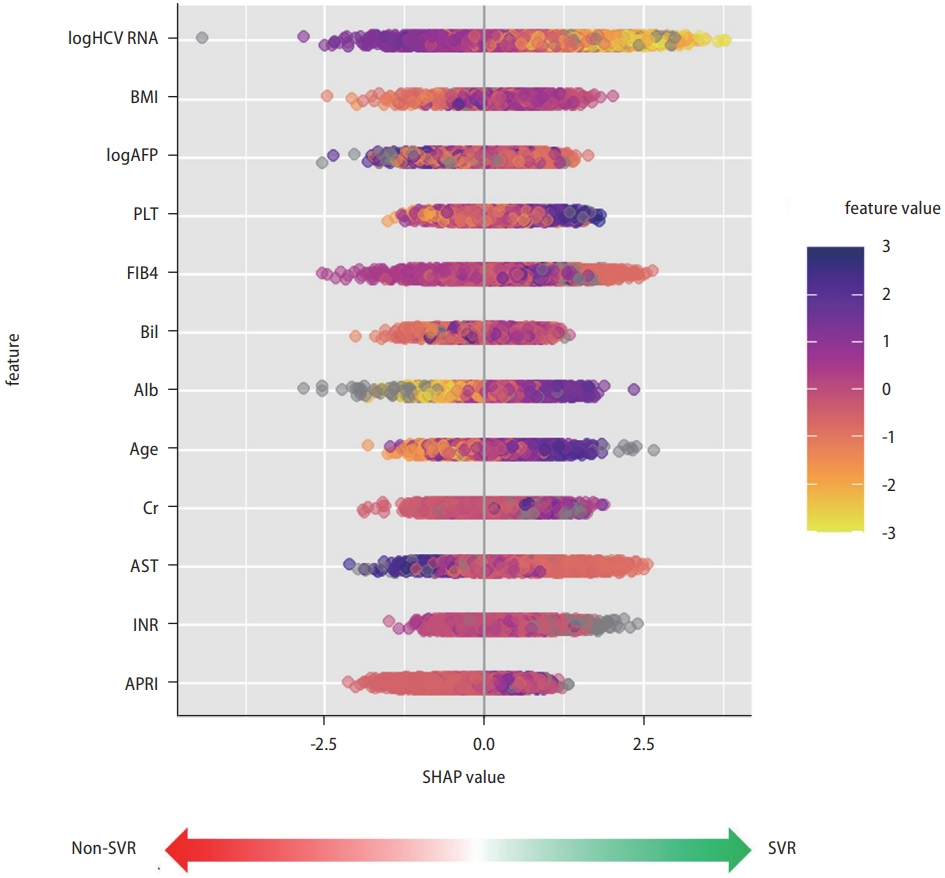
Shapley Additive exPlanations (SHAP) was used to separately measure the contributions to the outcome from each feature [15]. Figure 3 shows the summary of the XGBoost model explainability with SHAP in all cases. SHAP>0 indicated a higher probability of SVR, while SHAP<0 indicated a higher chance of non-SVR. A dot represents a sample, and the colors represent feature values ranging from low (yellow) to high (purple). From the color distribution of the dots, we can deduce the effect of this feature on the DAA efficacy. For example, the purple dots for HCV RNA are concentrated at SHAP<0, indicating that a higher viral load increases the probability of treatment failure, whereas the yellow dots for albumin are concentrated at SHAP<0, indicating that subjects with low albumin levels are prone to treatment failure. In brief, elevated viral load, α-fetoprotein, FIB-4 index, bilirubin, and AST levels increase the risk of DAA failure. Subjects with a lower body mass index, platelets, albumin, and younger age had a lower probability of SVR.
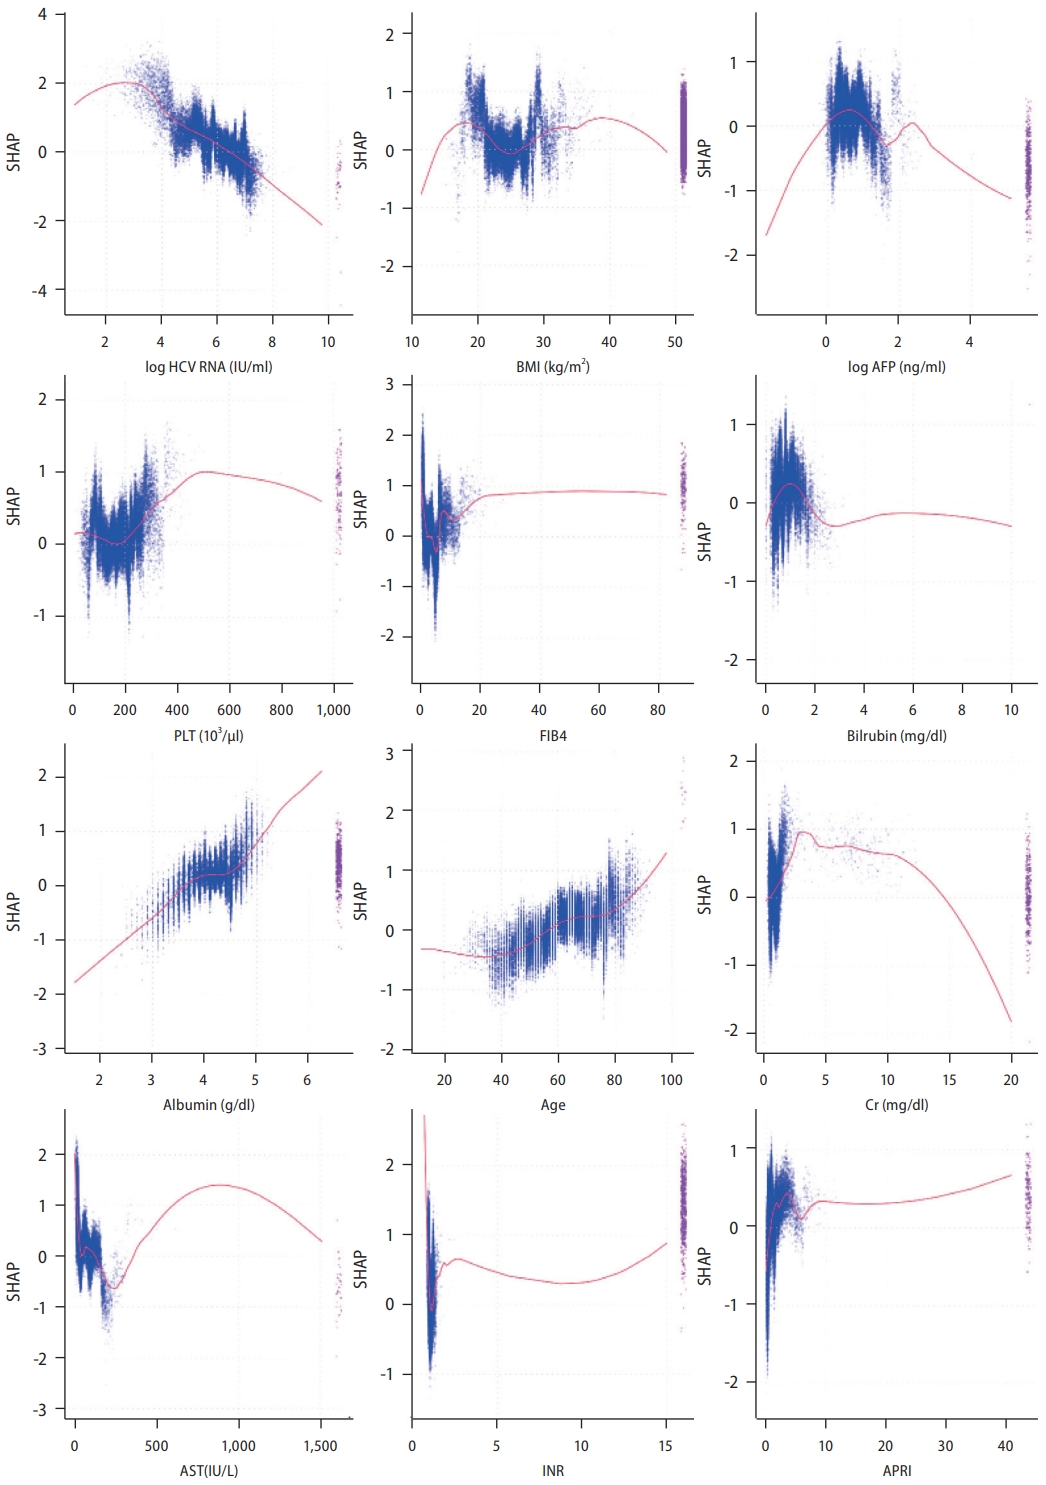
The detailed relationships between the features and the SVR are shown in Figure 4, revealing nonlinear relationships between the predictors and DAA efficacy. For example, HCV RNA levels <106 IU/mL increased the likelihood of SVR, and HCV RNA >2×10⁶ IU/mL increased the risk of virological failure. Approximately, subjects aged <60 years, with serum bilirubin level >2 g/dL, albumin <3.5 g/dL, and creatinine level >15 mg/dL were prone to treatment failure. When AST ranges between 200–300 IU/L, treatment failure is more likely; in contrast, AST <100 or AST >400 IU/L implies a higher chance of achieving SVR.

DISCUSSION

The nationwide TACR study investigated the risk factors for DAA treatment failure in Taiwanese patients. Multivariate regression analysis revealed that liver cirrhosis, HCC, poor DAA adherence, and high HbA1c levels were significantly associated with virologic failure. We developed an ML-based predictive model to identify potential treatment failure populations. The performance of the XGBoost model was superior to the other algorithms and the conventional logistic regression model. The AUROC of the XGBoost algorithm is 1.000 and 0.803 for the training and validation datasets, respectively. The AI predictive model successfully detected 69.7% of the subjects who failed to achieve SVR among the top five decile subgroups, thus implying that an AI-based model can effectively strengthen the decision-making process for antiviral therapy.
The AI model showed that subjects with features of liver cirrhosis prone to decompensation (i.e., higher FIB-4 index, bilirubin, and AST levels; lower albumin and platelets) were less likely to achieve SVR. Elevated AFP levels and decreased BMI (i.e., weight loss) are hallmarks of active HCC and predispose patients to treatment failure. In addition, HCV patients with a high baseline viral load had more difficulty in clearing the virus than those with a low viral load. These AI findings are consistent with those of the multivariate regression analysis. DAA adherence and HbA1c were not incorporated into the top 12 predictors in the AI model, possibly owing to collinearity between the above factors and other variables. Comorbid diabetes in HCV-infected patients is well-known to increase the risk of HCC [16,17]. A substantial proportion of decompensated patients who do not achieve SVR may experience adverse events or death-related early discontinuation [18]. Body mass index had J- or U-shaped associations with overall and all-cancer mortality rates. Compared with healthyweight individuals, life expectancy is shorter in underweight subjects [19,20]. Liver cirrhosis and HCC were not classified as significant risk factors using the XGBoost algorithm. Liver cirrhosis vs. FIB-4 index or HCC vs. AFP levels showed a certain degree of collinearity. In contrast, the viral load was not an independent risk factor using multivariate logistic analysis but became a significant predictor using the XGBoost approach, possibly resulting from the appropriate cutoff value of HCV RNA not being embedded in the regression model. Previous studies have shown that the SVR12 rate significantly decreased in the high baseline viral load group compared to that in the low viral load group. However, the optimal cutoff values for high vs. low viral loads vary across studies [21,22]. While pan-genotypic DAAs can be safely administered in traditionally difficult-to-treat HCV populations, managing patients with active HCC, decompensated liver cirrhosis, RASs, or prior DAA failure requires special attention [3]. There are substantial amounts of nonlinear data in clinical practice that are difficult to evaluate using conventional statistical methods. The SHAP dependence plot showed the relationship between SVR and the predictors (Fig. 4). Clinicians can realize the optimal range of significant variables that contribute to SVR. The AI predictive model can assist in discriminating high-risk patients and alert clinicians to identify risk factors before initiating DAA therapy.
The advantages of ML include flexibility and scalability, making it preferable for processing nonlinear big data [5]. The HCV-TARGET study in the United States and Europe (n=6,525) applied multiple algorithms (elastic net, neural network, random forest, and gradient boosting) to predict DAA treatment failure (C-index=0.64–0.69), superior to the multivariate logistic regression model (C-index=0.51) [23]. The HCV-TARGET study revealed that the top ten predictors were albumin, liver enzymes, bilirubin, sex, HCV RNA, sodium, HCC, platelet count, and tobacco use. The TACR and HCV-TARGET studies highlighted the vital roles of HCC and cirrhosis-related risk factors in DAA treatment failure. AI approaches confirmed the viewpoints of traditional statistics and further improved predictive performance compared with conventional statistical methods.
A meta-analysis revealed that patients with active HCC had a significantly lower SVR rate (73.1%) than those with inactive HCC (92.6%) or those without HCC (93.3%) [24]. The REAL-C study enrolled propensity score-matched HCV patients and confirmed that SVR rates were reduced in patients with active HCC but not those with inactive HCC (85.5% vs. 93.7%; P=0.03) [25]. Patients with active HCC may experience more adverse effects and early DAA discontinuation [26], which partially explains the suboptimal DAA response in this population. The mechanisms underlying suboptimal antiviral efficacy in patients with active HCC remain unclear, possibly attributed to the ineffective blood delivery of DAA to target sites [27] and impairment of host immunity in HCC patients [28]. HCC Patients with curative potential should be treated aggressively before DAA administration to ensure a greater chance of viral clearance. However, the optimal timing of DAA initiation in patients with incurable HCC remains controversial. Viral eradication significantly reduces mortality in patients with HCC receiving either curative or palliative HCC therapy [29], thus suggesting that antiviral therapy should not hesitate on those subjects not eligible for curative HCC treatment [30].
Previous studies have reported that the SVR rate is lower in HCV patients with decompensated cirrhosis than in patients with compensated cirrhosis [9,31]. The probability of achieving SVR varies based on the reserved liver function [32]. Patients with higher Model for End-Stage Liver Disease (MELD) scores (>20, Child-Turcotte-Pugh class C) had lower SVR rates, more adverse effects, and a lower likelihood of liver function improvement [33-35]. For patients with a MELD score ≥20, posttransplant HCV treatment is recommended, unless the expected waitlist time is more than six months. Patients with MELD scores <15 should be treated promptly. The grey zone of a MELD score, i.e., 15–19, requires tailored therapy on a case-by-case basis [11,36]. Our study provided information to identify patients with high risk of treatment failure. Selection of proper DAA regimens with high efficacy and safety profiles and enhancing DAA adherence might help to ensure treatment efficacy [9].
XGBoost is a supervised ML algorithm under a gradient boosting framework. The ensemble method combines multiple models to produce more accurate predictions. Gradient boosting is an ensemble technique that corrects mistakes in existing models by creating new models, which are sequentially added until no further improvement can be achieved [37]. This process is called gradient boosting because it utilizes a gradient descent method to minimize loss when creating new models [38]. Moreover, XGBoost supports both regression and classification tasks. XGBoost indeed exhibits an outstanding predictive ability compared to the other algorithms in our study.
ML models are usually considered “black boxes” because their prediction process is too complex for humans to interpret. To overcome this problem, explainable AI methods have been developed based on the Shapley methods [39]. SHAP is derived from the concept of cooperative game theory, which can calculate the contribution of each feature to the prediction. SHAP provides insight into the inner workings of a “black box” by generating quantitative visualizations of the prediction process. SHAP can reflect the influence of the features in each sample and show a positive or negative impact on the outcome [15]. Through the transformation of SHAP, users can better understand how the model makes predictions. Moreover, it provides feedback on the key factors contributing to the outcome and allows for the identification of potential biases. This transparency is crucial for convincing clinicians to rely on AI-based decision support systems [40]. “Explainable AI” may help bridge the gap between the medicine and AI-predictive models.
The current study has several limitations. Some patients (e.g., hepatic decompensation, HCC) may not survive long enough to obtain SVR12 data. This population may have relatively unfavorable prognostic factors, leading to a suboptimal treatment response. Although RASs have been confirmed to be associated with viral resistance [2,41], RAS testing is not recommended in routine clinical practice [42]. Considering only 7.0% of the RASs were available in the TACR database, this predictive model may underestimate the impact of RASs on the DAA response. The performance of the validation dataset is inferior to that of the training dataset. Potential overfitting and heterogeneity in the training dataset may affect model generalizability. However, avoiding overfitting may reduce the accuracy of ML models. In such an imbalanced dataset (non-SVR rate=1.6%), we expect the accuracy of the training dataset to be at least >98.4%. Under this premise, the hyperparameter tuning of each AI model was relatively limited, making it difficult to avoid overfitting. As the generalization is suboptimal, the present AI model should be further further modified before being applied to other independent cohorts. A relatively small number of DAA failure events may limit the development of a robust model. There is no universal approach to missing data imputation—a fundamental concern in real-world clinical datasets. The input data for the AI analysis contained only clinical and virological data in the current study. A combination of genomics, proteomics, and metabolomics may improve the predictive accuracy of the validation datasets in the future.
In conclusion, this nationwide TACR study applied ML algorithms for risk stratification in DAA failure. The performance of the AI model is superior to that of the conventional logistic regression model. The XGBoost model showed that subjects with features such as higher HCV RNA levels, active HCC, or decompensated liver cirrhosis were less likely to achieve SVR. This model captured 69.7% of patients who failed to achieve SVR among the top five decile subgroups. ML algorithms facilitate risk stratification in DAA failure and provide additional information on factors associated with DAA failure.

ACKNOWLEDGMENTS

This work was supported partially by the “ Center For Intelligent Drug Systems and Smart Bio-devices (IDS2B) “ and the “ Center of Excellence for Metabolic Associated Fatty Liver Disease, National Sun Yat-sen University, Kaohsiung” from The Featured Areas Research Center Program within the framework of the Higher Education Sprout Project by the Ministry of Education (MOE) in Taiwan, and grants from MOST 111-2314-B-037-069-MY2, MOHW111-TDU-B-221-114007, KMUH-DK(B)111002-1, KMHK-DK(C)111004, and KMHKDK(C)111006, KMU-TC111B04, KMU-TC111A04, NSTC 112-2321-B-001-006 and MOHW112-TDU-B-221-124007.

FOOTNOTES

Authors’ contribution
M.Y.L analyzed the data and wrote the manuscript. C.F.H, C.H.H, C.M.T, L.R.M, H.T.K, K.C.T, C.C.L, M.J.B, S.J.W, J.F.H, M.L.Y, C.T.C, M.C.T, C.W.H, P.L.L, T.H.Y, Y.H.H, L.W.C, C.L.C, C.C.Y, S.S.Y, P.N.C, T.Y.H, J.T.H, W.C.W, C.Y.C, G.Y.C, G.X.Z, W.L.T, C.N.K, C.L.L, C.C.W, T.Y.L, C.L.L, W.W.S, T.H.L, T.S.C, C.J.L, C.Y.D, J.H.K, H.C.L, W.L.C, C.Y.P, and C.Y.C collected the clinical data. C.W.T confirmed the machine learning analysis. M.L.Y designed the study, interpreted data, and supervised the manuscript. All authors have approved the final version of the manuscript.
Conflicts of Interest
Ming-Lung Yu disclosed the following: research grant from Abbvie, Gilead, Merck, and Roche diagnostics; consultant for Abbvie, BMS, Gilead, Roche, and Roche diagnostics; and speaker for Abbvie, BMS, Eisai, Gilead, Roche, and Roche diagnostics.

SUPPLEMENTAL MATERIAL

Supplementary material is available at Clinical and Molecular Hepatology website (http://www.e-cmh.org).
Supplementary Table 1.
The input features in the machine learning model
cmh-2023-0287-Supplementary-Table-1.pdf
Supplementary Table 2.
Performance of XGBoost for predicting DAA treatment response in the overall cases
cmh-2023-0287-Supplementary-Table-2.pdf
Supplementary Figure 1.
Importance of predictors. “Frequency” represents the ratio of the number of times a variable is used to the number of trees. BMI, body mass index; HCV, hepatitis C virus; AFP, α-fetoprotein; PLT, platelets; FIB-4, fibrosis-4 index; ALT, alanine aminotransferase; INR, international normalized ratio; AST, aspartate aminotransferase; APRI, aminotransferase to platelet ratio index; LDL, low-density lipoprotein; DAA, direct-acting antivirals; HbA1c, hemoglobin A1c; TG, triglyceride; rGT, gamma-glutamyltransferase; HDL, high-density lipoprotein; RVR, rapid virologic response; HBsAg, hepatitis B surface antigen; HIV, human immunodeficiency virus; HTN, hypertension; CKD, chronic kidney disease; RBV, ribavirin; HCC, hepatocellular carcinoma; LC, liver cirrhosis; HLD, hyperlipidemia; DM, diabetes; SAE, serious adverse event; RAS, resistance-associated substitutions; PWID, persons who inject drugs; CAD, coronary artery disease; DLC, decompensated liver cirrhosis; CLD, chronic liver disease; CVA, cerebrovascular accident.
cmh-2023-0287-Supplementary-Fig-1.pdf
Supplementary Materials
Machine learning code
cmh-2023-0287-Supplementary-1.pdf

Figure 1.
Performance of the predictive models. Figure 1 shows the ROC curves and precision-recall curves of the eXtreme Gradient Boosting (XGBoost), random forest (RF), decision tree (DT), artificial neural network (ANN) algorithms, and logistic regression (LR) models in the training dataset (A, B) and validation dataset (C, D). A precision-recall curve closer to the upper-right corner indicates better performance.

cmh-2023-0287f1.jpg
Figure 2.
DAA treatment failure rate by decile risk subgroups assessed using the XGBoost model among overall cases. The overall HCV patients were further divided into ten subgroups using the deciles of risk coefficients obtained from the XGBoost model. Patients with risk coefficients ranging from 0 to 0.1 belong to decile 1, from 0.1 to 0.2 were decile 2, …, and so on. The bars represent the predictive non-SVR accuracy in each subgroup. The red line represents the accumulated non-SVR rate. DAA, direct-acting antivirals; XGBoost, eXtreme Gradient Boosting; HCV, hepatitis C virus; SVR, sustained virological response.

cmh-2023-0287f2.jpg
Figure 3.
SHAP summary plot. The SHAP summary plot combined the feature importance and effects on DAA efficacy in all cases. The x-axis represents the SHAP value of the feature. A SHAP value >0 represents a positive correlation with SVR, and a SHAP value <0 represents a negative correlation with SVR. The overlapping points jittered along the x-axis represent the samples; the colors represent feature values ranging from low (yellow) to high (purple). SHAP, Shapley additive explanations; DAA, direct-acting antivirals; SVR, sustained virological response; BMI, body mass index; AFP, α-fetoprotein; PLT, platelets; FIB-4, fibrosis-4 index; AST, aspartate aminotransferase; INR, international normalized ratio; APRI, aminotransferase to platelet ratio index.

cmh-2023-0287f3.jpg
Figure 4.
SHAP dependence plot. SHAP dependence plot revealed that global model interpretations depend on the given features. SHAP, Shapley additive explanations; HCV, hepatitis C virus; BMI, body mass index; AFP, α-fetoprotein; PLT, platelets; FIB-4, fibrosis-4 index; AST, aspartate aminotransferase; INR, international normalized ratio; APRI, aminotransferase to platelet ratio index.

cmh-2023-0287f4.jpg

cmh-2023-0287f5.jpg
Table 1.
Baseline demographics
Variable Total Training Validation P-value
Number (%) 34,301 (100) 23,955 (70) 10,346 (30)
Age 61.9±12.7 61.9±12.6 61.9±12.8 0.710
Male 17,972 (52.4) 12,562 (52.4) 5,410 (52.3) 0.799
BMI (kg/m2) 24.7±4.04 24.7±4.06 24.7±4.01 0.285
FIB-4 3.31±3.37 3.30±3.37 3.33±3.36 0.438
Cirrhosis 7,051 (20.6) 4,903 (20.5) 2,148 (20.8) 0.542
Decompensated liver cirrhosis 932 (2.7) 637 (2.7) 295 (2.9) 0.316
HCC 2,822 (8.2) 1,967 (8.2) 855 (8.3) 0.874
Liver transplant 84 (0.2) 62 (0.3) 22 (0.2) 0.427
Genotype
 1 16,638 (48.5) 11,577 (48.3) 5,061 (48.9) 0.924
 2 13,298 (38.8) 9,332 (39.0) 3,966 (38.3)
 3 543 (1.6) 381 (1.6) 162 (1.6)
 4 17 (0.0) 13 (0.1) 4 (0.0)
 5 6 (0.0) 5 (0.0) 1 (0.0)
 6 2,478 (7.2) 1,730 (7.2) 748 (7.2)
 Mixed 1,073 (3.1) 748 (3.1) 325 (3.1)
 Unclassified 247 (0.7) 168 (0.7) 79 (0.8)
HCV RNA (log IU/mL) 5.90±1.02 5.90±1.02 5.90±1.02 0.623
HBsAg (+) 2,381 (7.3) 1,654 (7.3) 727 (7.4) 0.668
AST (IU/L) 60.7±54.1 60.4±53.9 61.3±54.5 0.165
ALT (IU/L) 73.0±77.0 72.8±77.7 73.3±75.4 0.635
Albumin (g/dL) 4.18±0.43 4.18±0.43 4.17±0.43 0.755
Total bilirubin (g/dL) 0.83±0.51 0.82±0.51 0.84±0.51 0.078
Platelet (x103/μL) 181.4±72.1 181.8±72.3 180.5±71.5 0.122
Prothrombin time (INR) 1.05±0.31 1.05±0.30 1.05±0.34 0.174
HbA1c (%) 6.06±1.24 6.1±1.3 6.0±1.2 0.308
DAA regimens
 Daclatasvir/Asunaprevir 981 (2.9) 682 (2.8) 299 (2.9) 0.986
 Viekirax/Exviera 3,394 (9.9) 2,377 (9.9) 1,017 (9.8)
 Elbasvir/grazoprevir 3,933 (11.5) 2,720 (11.4) 1,213 (11.7)
 Ledipasvir/sofosbuvir 7,592 (22.1) 5,301 (22.1) 2,291 (22.1)
 Sofosbuvir 2,549 (7.4) 1,770 (7.4) 779 (7.5)
 Sofosbuvir/daclatasvir 726 (2.1) 512 (2.1) 214 (2.1)
 Glecaprevir/pibrentasvir 7,568 (22.1) 5,300 (22.1) 2,268 (21.9)
 Sofosbuvir/velpatasvir 7,415 (21.6) 5,196 (21.7) 2,219 (21.5)
 Sofosbuvir/velpatasvir/voxilaprevir 90 (0.3) 60 (0.3) 30 (0.3)
 Others 42 (0.1) 28 (0.1) 14 (0.1)
Ribavirin (+) 4,346 (12.7) 3,019 (12.6) 1,327 (12.8) 0.572
Treatment naive 29,540 (86.1) 20,616 (86.1) 8,924 (86.3) 0.663

Values are presented as number (%).

BMI, body mass index; FIB-4, fibrosis index-4; HCC, hepatocellular carcinoma; HBsAg, hepatitis B surface antigen; AST, aspartate aminotransferase; ALT, alanine aminotransferase; HbA1c, hemoglobin A1c; DAA, direct-acting antivirals.

Table 2.
Multivariate logistic regression analysis of the factors associated with DAA treatment failure
Variable Univariate
Multivariate
SVR Non-SVR P-value adj. OR (95% CI) P-value
Number (%) 33,763 (98.4) 538 (1.6)
Age 61.9±12.7 61.6±12.9 0.624
Male 17,722 (52.5) 250 (46.5) 0.006 0.53 (0.26–1.11) 0.091
BMI (kg/m2) 24.7±4.0 24.9±4.2 0.381
FIB-4 3.30±3.36 3.94±3.85 1.7×10⁻⁴ 0.95 (0.85–1.06) 0.331
Cirrhosis 6,870 (20.4) 181 (33.6) 3.8×10⁻¹⁴ 2.60 (1.13–5.97) 0.025
Decompensated LC 907 (2.7) 25 (4.6) 0.006 0.92 (0.31–2.69) 0.877
HCC 2,715 (8.0) 107 (19.9) 3.4×10⁻²³ 4.43 (2.17–9.02) 4.2×10⁻⁴
Liver transplant 82 (0.2) 2 (0.4) 0.380
Genotype
 1 16,429 (48.7) 209 (38.8) 1.2×10⁻¹⁵ 0.99 (0.74–1.33) 0.949
 2 13,057 (38.7) 241 (44.8)
 3 516 (1.5) 27 (5.0)
 4 14 (0.0) 3 (0.6)
 5 6 (0.0) 0 (0.0)
 6 2,440 (7.2) 38 (7.1)
 Mixed 1,056 (3.1) 17 (3.2)
 Unclassified 244 (0.7) 3 (0.6)
HCV RNA (log IU/mL) 5.90±1.02 6.16±0.87 2.2×10⁻¹¹ 1.48 (0.99–2.20) 0.056
HBsAg (+) 2345 (7.3) 36 (7.0) 0.785
Albumin (g/dL) 4.18±0.43 4.07±0.51 4.9×10⁻⁷ 1.23 (0.57–2.66) 0.592
AST (IU/L) 60.6±54.1 67.4±54.2 0.004 1.01 (1.00–1.01) 0.068
ALT (IU/L) 72.9±77.1 76.0±73.6 0.351
Total bilirubin (mg/dL) 0.83±0.51 0.90±0.55 0.003 0.90 (0.56–1.43) 0.645
Platelet (x103/μL) 181.6±72.0 169.4±74.9 9.9×10⁻⁵ 1.00 (0.99–1.01) 0.889
Prothrombin time (INR) 1.05±0.31 1.08±0.44 0.036 0.86 (0.18–4.14) 0.846
Cr (mg/dL) 1.17±1.54 1.05±1.30 0.028 0.21 (0.04–1.05) 0.058
HbA1c (%) 6.1±1.2 6.3±1.5 0.012 1.28 (1.05–1.56) 0.014
DAA regimens
 Daclatasvir/Asunaprevir 936 (2.8) 45 (8.4) 1.4×10⁻³⁴ 0.99 (0.76–1.29) 0.933
 Viekirax/Exviera 3,353 (9.9) 41 (7.6)
 Elbasvir/grazoprevir 3,888 (11.5) 45 (8.4)
 Ledipasvir/sofosbuvir 7,470 (22.1) 122 (22.7)
 Sofosbuvir 2,448 (7.3) 101 (18.8)
 Sofosbuvir/daclatasvir 714 (2.1) 12 (2.2)
 Glecaprevir/pibrentasvir 7,467 (22.1) 101 (18.8)
 Sofosbuvir/velpatasvir 7,344 (21.8) 71 (13.2)
 Sofosbuvir/velpatasvir/voxilaprevir 90 (0.3) 0 (0)
 Others 42 (0.1) 0 (0)
Treatment naive 29,113 (86.2) 427 (79.4) 4.6×10⁻⁶ 0.85 (0.58–2.40) 0.654
DAA adherence
 >80% 33,656 (99.7) 492 (91.8) 2.0×10-259 33.48 (2.46–456.7) 0.008
 60-80% 44 (0.1) 10 (1.9)
 40-60% 21 (0.1) 7 (1.3)
 20-40% 19 (0.1) 11 (2.1)
 <20% 5 (0.0) 16 (3.0)
Ribavirin adherence
 >80% 3,910 (93.2) 117 (87.3) 0.004 0.75 (0.43–1.31) 0.313
 60-80% 125 (3.0) 7 (5.2)
 40-60% 77 (1.8) 6 (4.5)
 20-40% 49 (1.2) 0 (0)
 <20% 35 (0.8) 4 (3.0)
Severe adverse effects 365 (1.3) 13 (2.9) 0.003 1.10 (0.35–3.48) 0.876

Values are presented as number (%).

DAA, direct-acting antivirals; BMI, body mass index; LC, liver cirrhosis; FIB-4, fibrosis index-4; HCC, hepatocellular carcinoma; HBsAg, hepatitis B surface antigen; AST, aspartate aminotransferase; ALT, alanine aminotransferase; Cr, creatinine; HbA1c, hemoglobin A1c; adj.

OR, adjusted odds ratio; CI, confidence interval.

Table 3.
Performance of the predictive models for the response of direct-acting antivirals
Model AUC (95% CI) P-value Accuracy Precision Recall F1-score
Training dataset
 XGBoost 1.000 (1.000–1.000) 2.2×10-238 100% 100% 100% 1.000
 Random Forest 1.000 (1.000–1.000) 2.2×10-238 100% 100% 100% 1.000
 Decision tree 0.845 (0.825–0.865) 1.1×10-114 98.6% 98.6% 100% 0.993
 Neural network 0.736 (0.711–0.762) 8.3×10-55 98.5% 98.5% 100% 0.992
 Logistic regression 0.588 (0.558–0.619) 1.3×10⁻⁸ 81.6% 98.7% 82.3% 0.898
Validation dataset
 XGBoost 0.803 (0.769–0.837) 4.9×10-42 98.3% 98.4% 99.9% 0.992
 Random Forest 0.756 (0.722–0.790) 1.6×10⁻³⁰ 98.4% 98.4% 100% 0.992
 Decision tree 0.644 (0.594–0.695) 9.8×10⁻¹¹ 98.2% 98.4% 99.8% 0.991
 Neural network 0.658 (0.616–0.700) 1.6×10⁻¹² 98.4% 98.4% 100% 0.992
 Logistic regression 0.616 (0.571–0.662) 6.2×10⁻⁷ 82.1% 98.8% 82.8% 0.901

CI, confidence interval; XGBoost, eXtreme Gradient Boosting.

Table 4.
Delong test
P-value (z-score) Random Forest Decision tree Neural network Logistic regression
Training
 XGBoost 1.000 (0.0) <0.0001 (15.5) <0.0001 (19.9) <0.0001 (26.5)
 Random Forest <0.0001 (15.5) <0.0001 (19.9) <0.0001 (26.5)
 Decision tree <0.0001 (8.0) <0.0001 (15.0)
 Neural network <0.0001 (8.7)
Validation
 XGBoost 0.021 (2.3) 4.4×10⁻⁸ (5.5) 5.4×10⁻⁹ (5.8) 2.5×10⁻¹⁰ (6.3)
 Random Forest 3.9×10⁻⁵ (4.1) 6.6×10⁻⁷ (5.0) 2.5×10⁻⁸ (5.6)
 Decision tree 0.643 (–0.5) 0.354 (0.9)
 Neural network 0.102 (1.6)

XGBoost, eXtreme Gradient Boosting.

Abbreviations

AFP
α-fetoprotein
AI
artificial intelligence
ALT
alanine aminotransferase
ANN
artificial neural network
AST
aspartate aminotransferase
AUROC
area under the receiver operator characteristic curve
BMI
body mass index
DAA
direct-acting antivirals
DT
decision tree
FIB-4
fibrosis-4 index
HbA1c
hemoglobin A1c
HBV
hepatitis B virus
HCC
hepatocellular carcinoma
HCV
hepatitis C virus
INR
international normalized ratio
KNN
k-nearest neighbor
LC
liver cirrhosis
ML
machine learning
RAS
resistance-associated substitutions
RF
random forest
SHAP
Shapley additive explanations
SVR
sustained virological response
TACR
Taiwan HCV registry program
XGBoost
eXtreme Gradient Boosting

REFERENCES

1. Hayes CN, Imamura M, Tanaka J, Chayama K. Road to elimination of HCV: Clinical challenges in HCV management. Liver Int 2022;42:1935-1944.
crossref pmid pdf
2. Hong CM, Lin YY, Liu CJ, Lai YY, Yeh SH, Yang HC, et al. Drug resistance profile and clinical features for hepatitis C patients experiencing DAA failure in Taiwan. Viruses 2021;13:2294.
crossref pmid pmc
3. Solitano V, Plaz Torres MC, Pugliese N, Aghemo A. Management and treatment of hepatitis C: Are there still unsolved problems and unique populations? Viruses 2021;13:1048.
crossref pmid pmc
4. Huang CF, Yu ML. Unmet needs of chronic hepatitis C in the era of direct-acting antiviral therapy. Clin Mol Hepatol 2020;26:251-260.
crossref pmid pmc pdf
5. Hassabis D, Kumaran D, Summerfield C, Botvinick M. Neuroscience-inspired artificial intelligence. Neuron 2017;95:245-258.
crossref pmid
6. Su TH, Wu CH, Kao JH. Artificial intelligence in precision medicine in hepatology. J Gastroenterol Hepatol 2021;36:569-580.
crossref pmid pdf
7. Le Berre C, Sandborn WJ, Aridhi S, Devignes MD, Fournier L, Smaïl-Tabbone M, et al. Application of artificial intelligence to gastroenterology and hepatology. Gastroenterology 2020;158:76-94.e2.
crossref
8. Topol EJ. High-performance medicine: the convergence of human and artificial intelligence. Nat Med 2019;25:44-56.
crossref pdf
9. Chen CY, Huang CF, Cheng PN, Tseng KC, Lo CC, Kuo HT, et al. Factors associated with treatment failure of direct-acting antivirals for chronic hepatitis C: A real-world nationwide hepatitis C virus registry programme in Taiwan. Liver Int 2021;41:1265-1277.
crossref pmid pmc pdf
10. Yu ML, Chen PJ, Dai CY, Hu TH, Huang CF, Huang YH, et al. 2020 Taiwan consensus statement on the management of hepatitis C: part (I) general population. J Formos Med Assoc 2020;119:1019-1040.
crossref pmid
11. Yu ML, Chen PJ, Dai CY, Hu TH, Huang CF, Huang YH, et al. 2020 Taiwan consensus statement on the management of hepatitis C: Part (II) special populations. J Formos Med Assoc 2020;119:1135-1157.
crossref pmid
12. Petrazzini BO, Naya H, Lopez-Bello F, Vazquez G, Spangenberg L. Evaluation of different approaches for missing data imputation on features associated to genomic data. BioData Min 2021;14:44.
crossref pmid pmc pdf
13. Dankers FJWM, Traverso A, Wee L, van Kuijk SMJ. Prediction modeling methodology. In: Kubben P, Dumontier M, Dekker A, eds. Fundamentals of clinical data science. Cham (CH): Springer, 2019:101-120.

14. DeLong ER, DeLong DM, Clarke-Pearson DL. Comparing the areas under two or more correlated receiver operating characteristic curves: a nonparametric approach. Biometrics 1988;44:837-845.
crossref
15. Belle V, Papantonis I. Principles and practice of explainable machine learning. Front Big Data 2021;4:688969.
crossref pmid pmc
16. Davila JA, Morgan RO, Shaib Y, McGlynn KA, El-Serag HB. Diabetes increases the risk of hepatocellular carcinoma in the United States: a population based case control study. Gut 2005;54:533-539.
crossref pmid pmc
17. Tsai PC, Kuo HT, Hung CH, Tseng KC, Lai HC, Peng CY, et al. Metformin reduces hepatocellular carcinoma incidence after successful antiviral therapy in patients with diabetes and chronic hepatitis C in Taiwan. J Hepatol 2023;78:281-292.
crossref pmid
18. Charlton M, Everson GT, Flamm SL, Kumar P, Landis C, Brown RS Jr, et al. Ledipasvir and sofosbuvir plus ribavirin for treatment of HCV infection in patients with advanced liver disease. Gastroenterology 2015;149:649-659.
pmid
19. Bhaskaran K, Dos-Santos-Silva I, Leon DA, Douglas IJ, Smeeth L. Association of BMI with overall and cause-specific mortality: a population-based cohort study of 3·6 million adults in the UK. Lancet Diabetes Endocrinol 2018;6:944-953.
crossref pmid pmc
20. Global BMI Mortality Collaboration, Di Angelantonio E, Bhupathiraju ShN, Wormser D, Gao P, Kaptoge S, et al. Body-mass index and all-cause mortality: individual-participant-data meta-analysis of 239 prospective studies in four continents. Lancet 2016;388:776-786.
pmid pmc
21. Chen WM, Wei KL, Tung SY, Shen CH, Chang TS, Yen CW, et al. High viral load predicts virologic failure in chronic genotype 2 hepatitis C virus-infected patients receiving glecaprevir/pibrentasvir therapy. J Formos Med Assoc 2020;119:1593-1600.
crossref pmid
22. Salmon D, Bani-Sadr F, Gilbert C, Rosenthal E, Valantin MA, Simon A, et al. HCV viral load at baseline and at week 4 of telaprevir/boceprevir based triple therapies are associated with virological outcome in HIV/hepatitis C co-infected patients. J Clin Virol 2015;73:32-35.
crossref pmid
23. Park H, Lo-Ciganic WH, Huang J, Wu Y, Henry L, Peter J, et al. Machine learning algorithms for predicting direct-acting antiviral treatment failure in chronic hepatitis C: An HCV-TARGET analysis. Hepatology 2022;76:483-491.
crossref pmid pmc pdf
24. Ji F, Yeo YH, Wei MT, Ogawa E, Enomoto M, Lee DH, et al. Sustained virologic response to direct-acting antiviral therapy in patients with chronic hepatitis C and hepatocellular carcinoma: A systematic review and meta-analysis. J Hepatol 2019;71:473-485.
pmid
25. Ogawa E, Toyoda H, Iio E, Jun DW, Huang CF, Enomoto M, et al. Hepatitis C virus cure rates are reduced in patients with active but not inactive hepatocellular carcinoma: A practice implication. Clin Infect Dis 2020;71:2840-2848.
crossref pmid pdf
26. Huang CF, Yeh ML, Huang CI, Liang PC, Lin YH, Hsieh MY, et al. Equal treatment efficacy of direct-acting antivirals in patients with chronic hepatitis C and hepatocellular carcinoma? A prospective cohort study. BMJ Open 2019;9:e026703.
crossref pmid pmc
27. Konjeti VR, John BV. Interaction between hepatocellular carcinoma and hepatitis C eradication with direct-acting antiviral therapy. Curr Treat Options Gastroenterol 2018;16:203-214.
crossref pmid pdf
28. Sachdeva M, Chawla YK, Arora SK. Immunology of hepatocellular carcinoma. World J Hepatol 2015;7:2080-2090.
crossref pmid pmc
29. Dang H, Yeo YH, Yasuda S, Huang CF, Iio E, Landis C, et al. Cure with interferon-free direct-acting antiviral is associated with increased survival in patients with hepatitis C virus-related hepatocellular carcinoma from both East and West. Hepatology 2020;71:1910-1922.
crossref pmid pdf
30. Lee SW, Chen LS, Yang SS, Huang YH, Lee TY. Direct-acting antiviral therapy for hepatitis C virus in patients with BCLC stage B/C hepatocellular carcinoma. Viruses 2022;14:2316.
crossref pmid pmc
31. Huang CF, Iio E, Jun DW, Ogawa E, Toyoda H, Hsu YC, et al. Direct-acting antivirals in East Asian hepatitis C patients: realworld experience from the REAL-C Consortium. Hepatol Int 2019;13:587-598.
crossref pmid pdf
32. Curry MP, O’Leary JG, Bzowej N, Muir AJ, Korenblat KM, Fenkel JM, et al. Sofosbuvir and velpatasvir for HCV in patients with decompensated cirrhosis. N Engl J Med 2015;373:2618-2628.
crossref pmid
33. Modi AA, Nazario H, Trotter JF, Gautam M, Weinstein J, Mantry P, et al. Safety and efficacy of simeprevir plus sofosbuvir with or without ribavirin in patients with decompensated genotype 1 hepatitis C cirrhosis. Liver Transpl 2016;22:281-286.
crossref pmid pdf
34. Belli LS, Duvoux C, Berenguer M, Berg T, Coilly A, Colle I, et al. ELITA consensus statements on the use of DAAs in liver transplant candidates and recipients. J Hepatol 2017;67:585-602.
crossref pmid
35. Bunchorntavakul C, Reddy RK. HCV therapy in decompensated cirrhosis before or after liver transplantation: A paradoxical quandary. Am J Gastroenterol 2018;113:449-452.
crossref pmid
36. Ekpanyapong S, Reddy KR. Hepatitis C virus therapy in advanced liver disease: Outcomes and challenges. United European Gastroenterol J 2019;7:642-650.
crossref pmid pmc pdf
37. Mayr A, Binder H, Gefeller O, Schmid M. The evolution of boosting algorithms. From machine learning to statistical modelling. Methods Inf Med 2014;53:419-427.
crossref pmid
38. Ilboudo WEL, Kobayashi T, Sugimoto K. Robust stochastic gradient descent with student-t distribution based first-order momentum. IEEE Trans Neural Netw Learn Syst 2022;33:1324-1337.
crossref pmid
39. Bussmann N, Giudici P, Marinelli D, Papenbrock J. Explainable AI in fintech risk management. Front Artif Intell 2020;3:26.
crossref pmid pmc
40. Calderaro J, Seraphin TP, Luedde T, Simon TG. Artificial intelligence for the prevention and clinical management of hepatocellular carcinoma. J Hepatol 2022;76:1348-1361.
crossref pmid pmc
41. Sarrazin C. Treatment failure with DAA therapy: Importance of resistance. J Hepatol 2021;74:1472-1482.
crossref pmid
42. Ridruejo E, Pereson MJ, Flichman DM, Di Lello FA. Hepatitis C virus treatment failure: Clinical utility for testing resistanceassociated substitutions. World J Hepatol 2021;13:1069-1078.
crossref pmid pmc

Editorial Office
The Korean Association for the Study of the Liver
Room A1210, 53 Mapo-daero(MapoTrapalace, Dowha-dong), Mapo-gu, Seoul, 04158, Korea
TEL: +82-2-703-0051   FAX: +82-2-703-0071    E-mail: kasl@kams.or.kr
Copyright © The Korean Association for the Study of the Liver.         
COUNTER
TODAY : 1718
TOTAL : 1797169
Close layer