JCAD deficiency attenuates activation of hepatic stellate cells and cholestatic fibrosis
Article information

Abstract
Background/Aims
Cholestatic liver diseases including primary biliary cholangitis (PBC) are associated with active hepatic fibrogenesis, which ultimately progresses to cirrhosis. Activated hepatic stellate cells (HSCs) are the main fibrogenic effectors in response to cholangiocyte damage. JCAD regulates cell proliferation and malignant transformation in nonalcoholic steatoheaptitis-associated hepatocellular carcinoma (NASH-HCC). However, its participation in cholestatic fibrosis has not been explored yet.
Methods
Serial sections of liver tissue of PBC patients were stained with immunofluorescence. Hepatic fibrosis was induced by bile duct ligation (BDL) in wild-type (WT), global JCAD knockout mice (JCAD-KO) and HSC-specific JCAD knockout mice (HSC-JCAD-KO), and evaluated by histopathology and biochemical tests. In situ-activated HSCs isolated from BDL mice were used to determine effects of JCAD on HSC activation.
Results
In consistence with staining of liver sections from PBC patients, immunofluorescent staining revealed that JCAD expression was identified in smooth muscle α-actin (α-SMA)-positive fibroblast-like cells and was significantly up-regulated in WT mice with BDL. JCAD deficiency remarkably ameliorated BDL-induced hepatic injury and fibrosis, as documented by liver hydroxyproline content, when compared to WT mice with BDL. Histopathologically, collagen deposition was dramatically reduced in both JCAD-KO and HSC-JCAD-KO mice compared to WT mice, as visualized by Trichrome staining and semi-quantitative scores. Moreover, JCAD deprivation significantly attenuated in situ HSC activation and reduced expression of fibrotic genes after BDL.
Conclusions
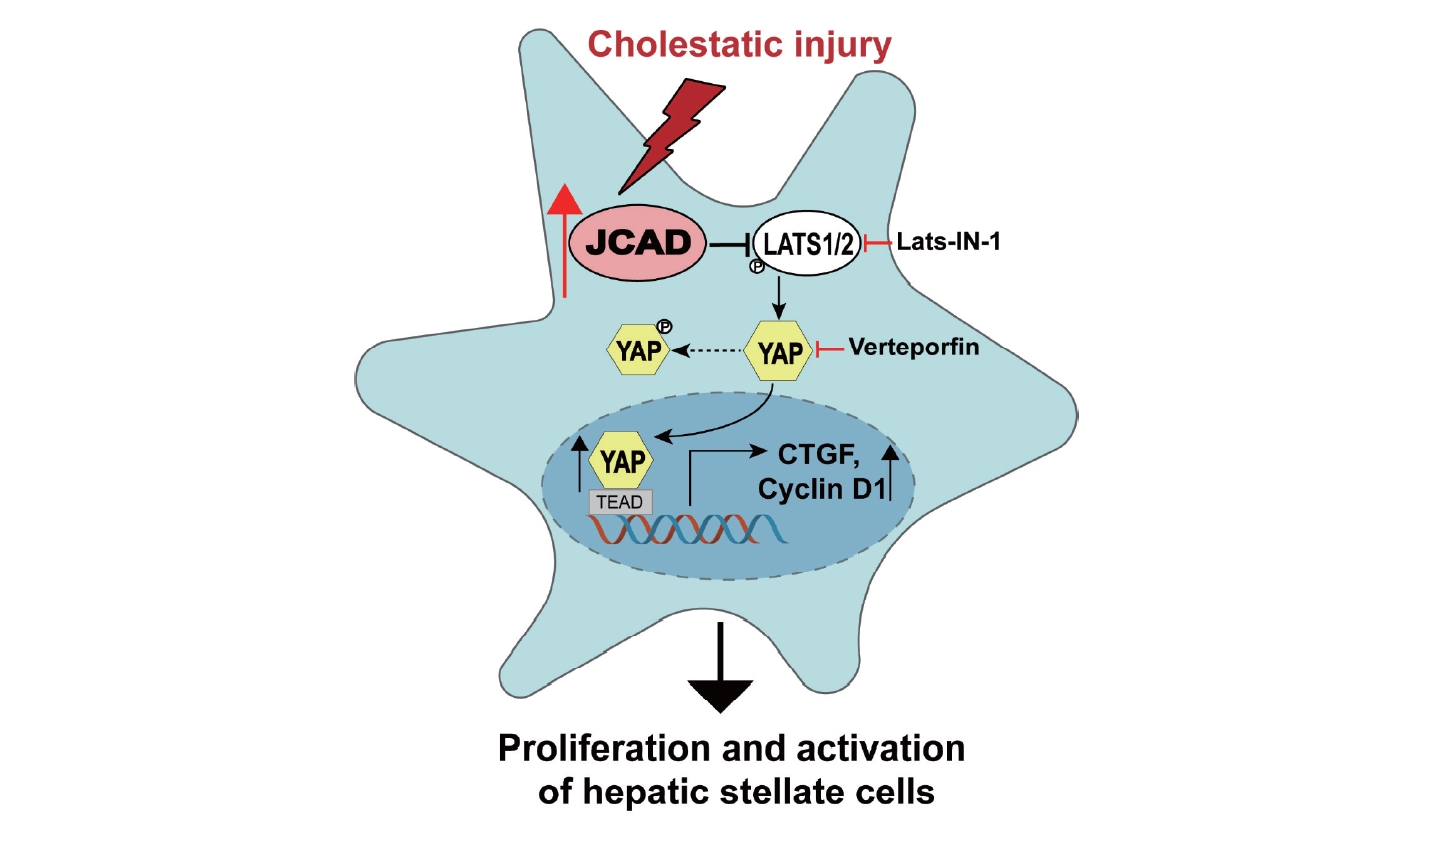
JCAD deficiency effectively suppressed hepatic fibrosis induced by BDL in mice, and the underlying mechanisms are largely through suppressed Hippo-YAP signaling activity in HSCs.
Graphical Abstract
INTRODUCTION
Primary biliary cholangitis (PBC), a classic representative of chronic cholestatic hepatobiliary cell injury, is an autoimmune disease primarily affecting the intrahepatic small bile ducts. The 5-year accumulative incidence of decompensation, HCC and death/liver transplantation in PBC patients was 6.95%, 1.54% and 4.02%, respectively [1]. Cholestatic liver disease/cirrhosis cases represented 1,758 of 9,473 liver transplantations done in the United States until 2023, according to the Organ Procurement and Transplantation Network (OPTN) (www.hrsa.gov). Despite not being a leading indication for liver transplantation, the true incidence of PBC is rising as more screening tests are performed in otherwise healthy persons. PBC is more common than men among women of middle age worldwide. The disease ratio among females to males is 10:1. The incidence and prevalence are widely variable across different countries. The prevalence of PBC in the United States per million persons is 654 for women and 121 for men [2]. The overall prevalence of PBC was 118.75 cases per million in the Asia-Pacific region [1].
Hepatic fibrosis is a wound-healing process responding to various modes of chronic liver injury, including cholestasis [3]. A variety of etiologies, such as toxicity of medications, viral infection, even pregnancy or contraceptives, may lead to cholangiocyte injury and cholestasis as a result of the accumulation of hydrophobic bile acids, which are toxic to bile epithelial cells (BECs) and hepatocytes [4,5]. In response to injury, BECs proliferate to compensate for their respective loss and maintenance of bile duct integrity [6]. Repeated cycles of BEC injury-proliferation evokes inflammation and collagen deposition, manifested as bile duct reaction and cholestatic fibrosis [7]. Hepatic stellate cells (HSCs) and portal fibroblasts (PFs) are activated and proliferate more rapidly when cytokines,such as transforming growth factor-β1 (TGF-β1), vascular endothelial growth factor (VEGF), C-C motif chemokine ligand 2 (CCL2), and interleukin-6 (IL6), etc. are released by proliferative BECs [7,8]. Activated HSCs are the main cellular effectors in liver fibrosis in response to cholangiocyte damage [9,10]. This ultimately results in an excess of extracellular matrix (ECM) production and accelerates the development of fibrosis [11]. Hence, activated HSCs are considered as a therapeutic target for the treatment of cholestatic fibrosis.
Junctional protein associated with coronary artery disease (JCAD), a cell-cell junctional protein localized between vascular endothelial cells (ECs), promotes endothelial dysfunction and atherosclerosis [12-14]. It has been demonstrated that JCAD promotes YAP activation in human EC, while JCAD depletion decreased the percentage of nuclear-localized YAP and reduced expression of atherogenic genes (such as CTGF and CYR61) by enhancing the phosphorylation of YAP [15]. Moreover, our previous studies demonstrated that JCAD promoted the transformation of NASH into HCC by interacting with the kinase domain of LATS2 and inhibiting its phosphokinase activity, which further resulted in a decreased level of YAP phosphorylation and an increase in YAP nuclear translocation [16]. However, to our knowledge, its participation in cholestatic fibrosis has not been explored yet, nor has the role of JCAD in HSC activation through the Hippo-YAP signaling axis been investigated.
In the present study, enhanced expression of JCAD was found in activated fibroblast-like cells in the portal triads in patients with PBC. Bile duct ligation (BDL) was performed to induce cholangitis and fibrosis in global and HSC-specific JCAD knock-out (KO) mice. The findings demonstrated that JCAD depletion alleviated BDL-induced BEC proliferation and liver fibrosis, two major repairing responses to cholestatic injury. Moreover, JCAD acted as a novel upstream regulator of the Hippo-YAP signaling pathway to positively affect HSC activation.
METHODS AND MATERIALS
Human subjects and ethic issues
The procedures regarding human subjects were approved by the Ethic Committee of Fudan University School of Basic Medical Sciences (2022-C008). Formalin-fixed, paraffin-embedded liver slices from five PBC patients and five control livers from non-PBC patients were obtained from the Biorepository of Pathologic Specimens in the Department of Pathology, School of Basic Medical Sciences, Fudan University. All patient identification was removed, and the sections were re-numbered for annotation. Patient information is briefly summarized in Table 1.

Clinical characteristics of subjects
Animal experiments and ethic approval
Mice were housed in specific pathogen-free (SPF) facilities at Fudan University and Shanghai Model Organisms. All experimental protocols (2021-0302-051, 2023-0301-088) were approved by the Ethic Committee for Experimental Animal Use and Care, Fudan University School of Basic Medical Sciences, and performed in line with the NIH Guidelines for Experimental Animal Handling and Use, as well as the national, municipal, and university regulations. Breading pairs of global homozygous JCAD knockout C57BL/6J (JCAD-KO) mice were obtained from RIKEN Center for Life Science Technologies, Kobe, Hyogo, Japan [13], and utilized to generate offspring, and offspring chimeric mice were identified by PCR using primer pairs as reported [13]. Only male JCAD-KO mice were used in the present study in order to avoid gender difference in response to cholestatic insults. The wild-type (WT) C57BL6/J mice were used as controls. WT and JCAD-KO mice (at least 10 weeks of age) were subjected to sham or BDL without cholecystectomy for up to 14 days as we described previously [17,18]. Mice were sacrificed 2 weeks after BDL procedures, and liver tissue was collected and stored at –80°C for histopathologic, biochemical, and molecular analyses as reported in our previous study [19].
Hepatic stellate cell-specific conditional JCAD knockout mice (JCADflox/flox, GFAP-cre+/+, named as HSC-JCAD-KO) were generated by crossing floxed JCAD mice containing the exon 3 open-reading frame of JCAD (generated in Shanghai Model Organisms, Shanghai, China) with the GFAP-cre/ERT2 strain mice (a generous gift from Prof. Yong Xu in Nanjing Medical University, Nanjing, China), as reported [20,21]. To activate creenzyme for JCAD deletion, 5- to 6-week-old male mice were injected daily with tamoxifen (TAX, 100 mg/kg) for 5 consecutive days, followed by a 7-day interval for the clearance of tamoxifen. After verification with genome typing and tamoxifen treatment (Supplementary Fig. 8A–D), mice with the correct genomic type and phenotype were subjected to BDL. Wild-type littermates (JCADflox/flox, GFAP-cre-/-, defined as WT in short) were used as controls to determine whether JCAD deficiency in HSCs results in minimal or no fibrosis in homozygous mice. All experiments were performed in male mice. Primers for identification of mouse genome types were listed in Supplementary Table 1.
Statistical analysis
All data were expressed as mean±standard deviation (SD). SPSS software was used for statistical analysis. When two groups were compared, student t-test was used after normal distribution test. When the experimental design involves more than 2 groups, one-way ANOVA was used to compare between groups after normal distribution test, and multiple comparisons between two given groups were completed by the least significant difference (LSD) test. If normality or homogeneity of variance is not met, Kruskal-Walli and Hodges-Lehmann tests were used for multiple comparisons between two given groups. *, **, *** represent as P<0.05, 0.01 and 0.001; P-value<0.05 was considered as statistically significant.
RESULTS
JCAD is highly expressed in the livers of both patients with PBC and mice with biliary obstruction
Liver sections from control subjects without chronic cholestatic liver disease and patients with PBC were examined for counter-staining of JCAD with α-SMA protein. In control livers, positive α-SMA staining was localized to fibroblast-like cells in the portal triads as evidenced in H&E staining showing the bile ductule (Fig. 1, top panel). JCAD staining was largely negative in this area in control livers. However, immunofluorescent staining of serial sections revealed that JCAD was strongly positive in the biopsied tissue of PBC patients, and was overlapped in α-SMA-positive fibroblast-like cells (Fig. 1 white arrow), which illustrated that JCAD, a membrane conjunction protein, was expressed most in activated HSCs or possibly in PFs too in the portal triads when it was in an early phase of bile duct reaction. Moreover, positive JCAD staining was visualized in BECs with the ductular reactions in sections of biopsied tissue from PBC patients (Fig. 1 yellow arrow). These findings indicate that enhanced JCAD activity in BECs and HSCs may participate in the biliary ductular reaction and fibrosis of cholestatic disorders in human.
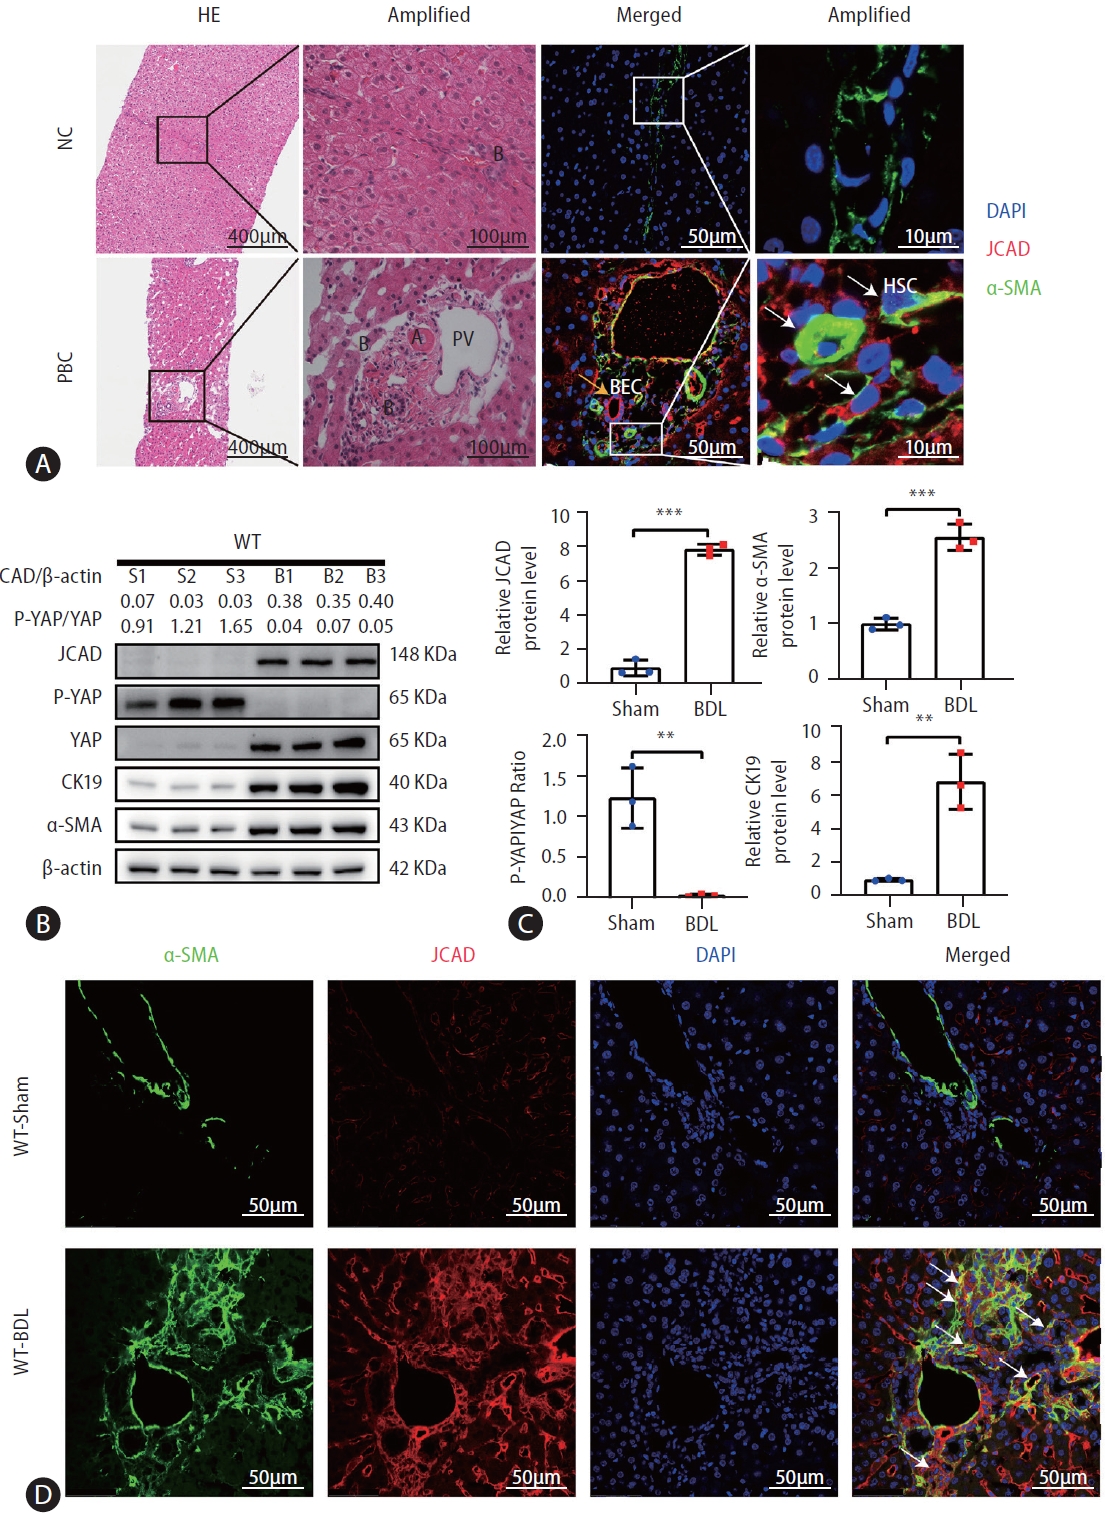
JCAD was highly expressed in PBC specimens and bile duct ligation mice. (A) Representative micrographs of H&E and immunofluorescent staining of liver-biopsied specimens. The H&E staining image was taken at original magnification (100×). Scale bars=400 μm. The immunofluorescent co-staining of JCAD with α-SMA was positive in fibroblast-like cells in the liver lobules, but much more positive in the portal triads from PBC patients compared to the control. Red: JCAD; Green: α-SMA; Blue: DAPI. Image amplification: 400×. Scale bars=50 μm. PV: Branch of the hepatic portal vein; B: Bile ductule; BECs: Biliary epithelial cells; HSCs: Hepatic stellate cells. (B) Western blot analysis of JCAD protein level in BDL mouse livers (n=3). β-Actin was used as a loading control. P-YAP/YAP ratio indicates phosphorylation levels of Yap. (C) Semiquantitative analysis of Western blot of JCAD, α-SMA, and CK19 proteins (n=3). (D) Representative confocal micrographs of α-SMA and JCAD in WT mice post BDL. Green: α-SMA; Red: JCAD; Blue: DAPI. Images were taken at original magnification (400×). JCAD, junctional protein associated with coronary artery disease; PBC, primary biliary cholangitis; YAP, yes-associated protein; WT, wild-type. Scale bars=50 μm. All data were expressed as mean±standard deviation. *,**,***P<0.05, 0.01 and 0.001 vs. WT-Sham mice.
To study the potential role of JCAD in cholestatic insult, BDL was utilized as an animal model of cholestasis. Liver tissue was harvested 14 days after BDL, which resulted in acute obstructive cholestasis and portal fibrosis at this time point. The gross examination and histopathology showed a huge gallbladder, massive liver necrosis and profound fibrosis(Supplementary Fig. 1A). JCAD expression was examined in the liver after BDL. A significant increase in JCAD protein levels was detected by Western blotting analysis (Fig. 1B, C) in consistency with elevated mRNA levels compared to sham-operated mice (Supplementary Fig. 1B). Immunostaining confirmed that JCAD expression was increased in fibrotic liver after BDL compared to sham-operated mice (Fig. 1D). In agreement with the immunofluorescent staining of liver sections from PBC patients, JCAD expression in cholestatic livers was enhanced along with upregulated α-SMA, CK19 and YAP expression (Fig. 1B, C). Thus, it is tempting to speculate that JCAD is an important player in the regulation of biliary ductular reaction and fibrosis following BDL in mice or in cholestatic disorders in humans.
BDL-induced hepatic injury was ameliorated in JCAD-KO mice
To test whether increased JCAD levels are critical for hepatic response, BDL was performed in WT and JCAD-KO mice. Liver histopathology revealed that the WT-BDL mice displayed increased focal necrosis, portal inflammation and bile leakage (Supplementary Fig. 1A). In JCAD-KO-BDL mice, the degree of focal necrosis was attenuated histopathologically compared to WT-BDL (Fig. 2A). The ratio of liver over body weight did not differ between WT and JCAD-KO mice after BDL. In contrast, JCAD-KO-BDL mice restored the reduction in liver weight and body weight compared to WT-BDL mice (Supplementary Fig. 2A). Serum levels of alanine aminotransferase (ALT) and aspartate aminotransferase (AST) were significantly elevated in WT-BDL mice; however, they were reduced remarkably in JCAD-KO-BDL mice (Supplementary Fig. 2B). Similarly, serum levels of bilirubin and bile acids were strikingly decreased in JCAD-KO-BDL mice compared to WT-BDL mice.
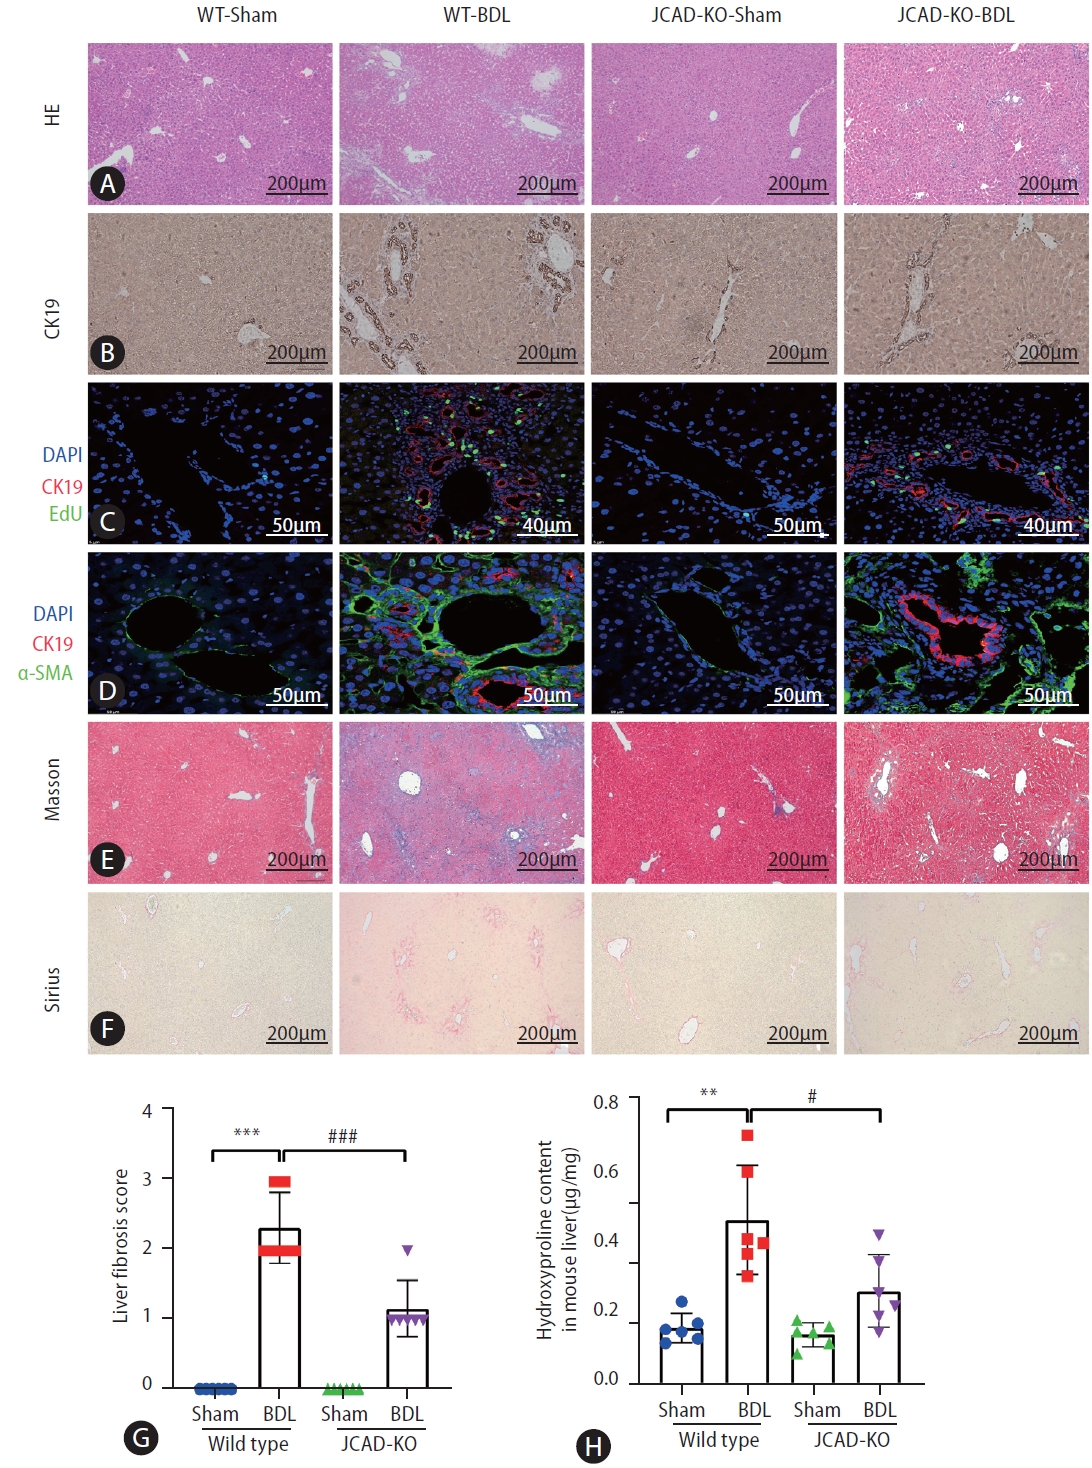
Liver histopathologic features of mice subjected to sham or bile duct ligation surgery and effects of JCAD depletion. (A) Liver damage was assessed by H&E staining in liver sections from all groups. images were taken at original magnification (100×), scale bars=200 μm. (B) Representative image of immunohistochemistry for CK-19. images were taken at original magnification (100×), scale bars=200 μm. (C, D) Representative confocal micrographs of double-staining. For (C), CK19 was stained in red and EdU was stained in green. images were taken at original magnification (400×), scale bars=40 μm or 50 μm. For (D), CK19 was stained in red and α-SMA was stained in green. images were taken at original magnification (630×), scale bars=50 μm. (E, F) Fibrosis was shown by Masson and Sirius red staining. images were taken at original magnification (100×), scale bars=200 μm. (G) Semiquantitative score of hepatic fibrosis by a pathologist (n=6). (H) Liver hydroxyproline content (μg/mg tissue) (n=6). JCAD, junctional protein associated with coronary artery disease; WT, wild-type; BDL, bile duct ligation; EdU, 5-ethynyl- 2’-deoxyuridine. All data were expressed as mean±standard deviation. *,**,***P<0.05, 0.01, and 0.001 vs. WT-Sham mice; #,##,###P<0.05, 0.01, and 0.001 vs. WT-BDL mice.
JCAD deficiency abrogated bile ductular reaction and fibrosis after BDL
Effects of JCAD deficiency on intrahepatic bile duct mass were assessed with immunohistochemical staining for CK-19 (a specific marker of bile duct epithelial cells), and it was found that the positivity of CK-19 staining in JCAD-KO-sham mice was similar to WT-sham mice (Fig. 2B, Supplementary Fig. 3B). Comparing WT-BDL with WT-sham or JCAD-KO-sham mice revealed a large increase in ductal mass in WT-BDL mice; whereas JCAD-KO-BDL mice exhibited a significant decrease in intrahepatic ductal mass (Fig. 2B–D). In addition, JCAD deficiency was manifested with decreased intrahepatic bile duct mass, as evidenced by decreased Ki67-positive cell counts and 5-ethynyl-2’-deoxyuridine (EdU) incorporation (Fig. 2C, Supplementary Fig. 3A, B).
To further confirm whether JCAD modulates in vivo cholestatic fibrogenesis, fibrotic progression and collagen deposition were assessed. As shown in Figure 2E, 2F, BDL caused remarkable collagen accumulation in the liver compared to the sham-operated mice in Sirius red and Masson’s trichrome staining. In contrast, collagen deposition was dramatically reduced in JCAD-KO-BDL mice (Fig. 2E, F). Consistently, semiquantitative score of hepatic fibrosis and photometric analysis of Masson/Sirius red staining verified that the collagen fiber-deposited area was significantly increased in the BDL mice; however, it was remarkably decreased in JCAD-KO mice after BDL (Fig. 2G, Supplementary Fig. 3C). This finding was further confirmed by immunofluorescent staining for α-SMA, CK-19, and in situ EdU labeling (Fig. 2C, D). Liver hydroxyproline content was significantly decreased in JCAD-KO-BDL mice compared to WT-BDL mice (Fig. 2H). Moreover, Western blot images showed that α-SMA and CK-19 protein levels were elevated in BDL-induced fibrotic liver, and JCAD-KO dramatically reduced expression of these two markers at protein levels (Fig. 3A, B). Similarly, gene expression of α-SMA, TGF-β, CTGF, and procollagen type-1 was significantly up-regulated in WT-BDL mice compared to sham-operated WT; whereas, expression of these genes was much suppressed in JCAD-KO-BDL mice (Fig. 3C, Supplementary Fig. 3D). Given that TGF-β1 is a well-known fibrogenic cytokine, expression of TGF-β1 in the liver and secretion of TGF-β1 in serum from these mice were determined. As expected, the levels of TGF-β1 in hepatic homogenates and serum were remarkably decreased in JCAD-KO-BDL compared to WT-BDL mice (Fig. 3D). Collectively, these findings documented that JCAD deficiency mitigated bile ductular reaction and fibrosis after BDL in mice.
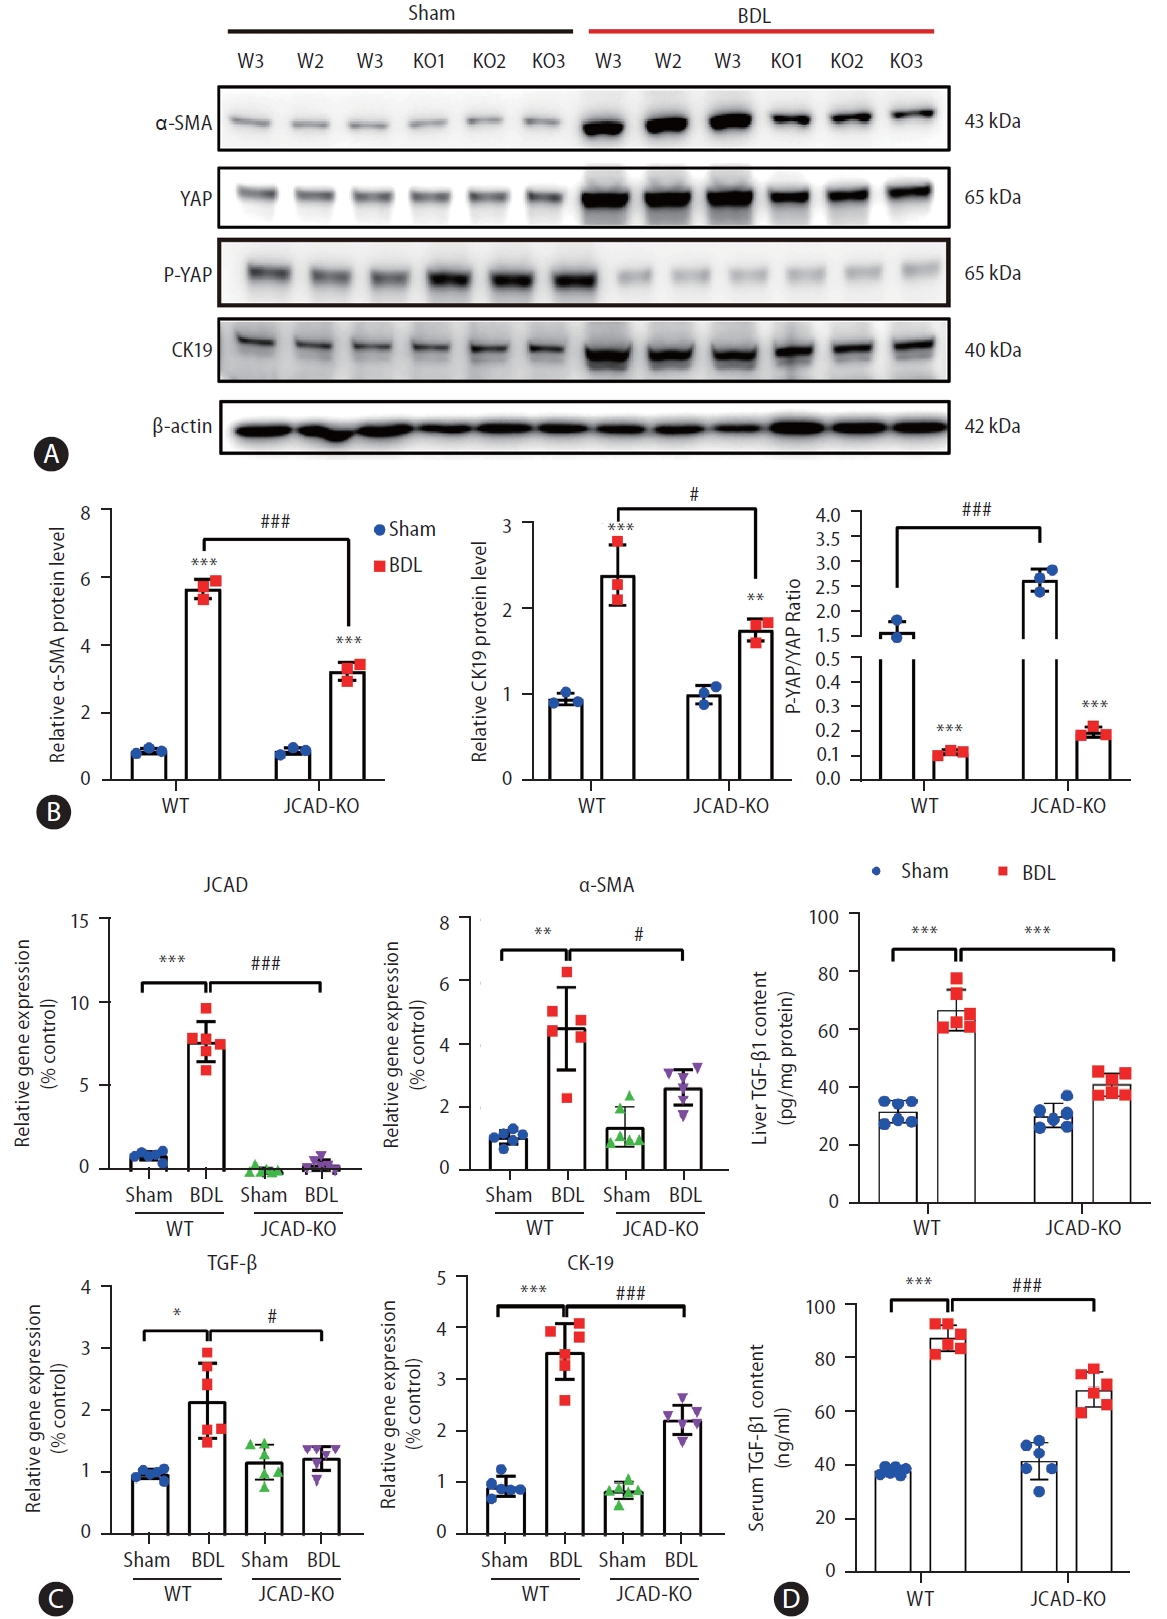
JCAD deficiency protects mice from cholestatic liver fibrosis and biliary duct reaction following BDL. (A) Total protein levels of α-SMA, CK19, and JCAD-Hippo signaling axis in mouse liver were assayed by Western blot (n=3). (B) The semi-quantitative determination of α-SMA, CK19 protein expression (n=3). β-Actin was used as a loading control. P-YAP/YAP ratio indicates phosphorylation levels of Yap. (C) Relative mRNA levels of JCAD, α-SMA, TGF-β and CK19 in mouse liver were determined by quantitative RT-PCR analysis (n=6). (D) Levels of TGF-β1 were examined by ELISA (ABclonal, RK00057) in hepatic homogenates and serum respectively from these mice (n=6). JCAD, junctional protein associated with coronary artery disease; YAP, yes-associated protein; WT, wild-type; BDL, bile duct ligation. All data were expressed as mean±standard deviation. *,**,***P<0.05, 0.01, and 0.001 vs. WT-Sham mice; #,##,###P<0.05, 0.01, and 0.001 vs. WT-BDL mice.
Moreover, the liver tissue was examined by transmission electron microscopy using semi-thin tissue sections, which enables the resolution and visualization of ultrastructural details. As shown in Figure 4I, hepatocytes from sham-operated WT mice exhibited a normal ultrastructure of the nucleus, mitochondria and lysosomes. The plasma membrane of these subcellular organelles is mostly smooth and flat except where it is enfolded to form the bile canaliculi (BC) in the bilateral faces, and there exist many microvilli projecting into the BC lumen (Fig. 4A-I, 4B-I, red arrow). HSCs are situated in the space of Disse, where innumerable microvilli from the apical face of hepatocytes extend into (Fig. 4C-I, 4D-I). The nuclei of stellate cells are oval or more or less elongated and frequently indented by lipid droplets in the cytoplasm (Fig. 4D-I). Liver sinusoidal endothelial cells (LSEC) form the lining of the sinusoidal wall, and their thin, flat projections of cytoplasm are spread out and contain fenestrae (Fig. 4C-III). On the contrary, ultrastructural features of BDL mice were characterized with cholestasis, activation of Kupffer cells and stellate cells, bile duct damage, ductular reaction, and hepatocellular damage and regeneration [22]. In hepatocytes from WT mice with BDL, many damaged mitochondria with broken cristae and increased density, vacuolated matrixes, and an increased number of primary lysosomes were observed (Fig. 4A-II, 4B-II), yet no clear changes in the nucleus and endoplasmic reticulum (ER) were seen. The bile canaliculus was massively expanded, and the microvilli disappeared (Fig. 4A-II, 4B-II, red arrow). Number of lipid droplets in HSCs was significantly reduced (Fig. 4C-II, 4D-II). As shown in Fig. 4III, global JCAD knock-out did not cause marked changes in liver ultrastructure at this age compared to WT mice. However, the ultrastructure was greatly improved in JCAD-KO-BDL mice compared to WT mice with BDL, representing as expansion of bile canaliculi was reduced with preservation of many microvilli (Fig. 4A-IV), the density of mitochondria was decreased (Fig. 4B-IV), and quiescent stellate cells were observed in the sinusoids (Fig. 4C-IV, 4D-IV). Taken together, these ultrastructural findings demonstrated that JCAD deficiency alleviated BDL-induced cholestatic insults and fibrogenic response in mice.

Liver histology by transmission electron microscopy (TEM). Ultrastructural cell morphology in livers from wild-type (I) and JCAD-KO (III) mice before performed BDL surgery versus wild-type (II) and JCAD-KO (IV) mice 14 days after BDL. Morphological analysis of bile canaliculi and small bile ducts (A, B), mitochondria and ribosomes (B), liver sinusoid (C), and hepatic Stellate cells (D). Note: loss of microvilli and canalicular dilation, damaged mitochondria and ribosomes, activated HSCs in WT-BDL (II) mice. In comparison with the wild-type, liver pathological damage of JCAD-KO-BDL (IV) mice was minimized. BC, bile canaliculi; M, mitochondria; RER, rough endoplasmic reticulum; N, nucleus; Gly, glycogen; Lys, lysosome; LSEC, liver sinusoid endothelial cells; HSC, hepatic stellate cells; LD, lipid droplet; KC, Kupffer cell; JCAD, junctional protein associated with coronary artery disease; WT, wild-type; BDL, bile duct ligation. Arrows point to the microvilli. Original magnification: 14,000× (B, D), 5,800× (A, C).
Inhibition of JCAD diminished HSC activation
Based on the findings as shown above, it is to speculate that JCAD is essential for HSC activation. To test this hypothesis, JCAD localization was assayed in human hepatic HSCs by fluorescent immunohistochemistry. As shown in Figure 5A, JCAD was expressed in stellate cells and was increased in a same pattern as α-SMA, a well-known marker of activated HSCs. Positive staining of the JCAD protein was mainly located in the cytoplasm, and activated stellate cells were prone to be in a dendritic-shape. When JCAD expression was knocked-down by siRNA-JCAD transfection, HSCs tended to be in a quiescent stage with an oval shape. As expected, transfection of siRNA against JCAD was efficient, and it suppressed HSC activation as measured by fibrosis-associated genes and proteins, such as α-SMA, COL-1α1, TIMP1, and CTGF in human LX2 and HSC lines (Fig. 5B, C). Moreover, suppressing JCAD expression in these stellate cells counteracted TGFβ-stimulated proliferation by increasing the ratio of p-YAP over YAP (Fig. 5B, D), which is the key transcription factor in the Hippo signaling pathway, indicating that the activity of the Hippo-YAP signaling pathway was significantly boosted during the activation of HSCs.
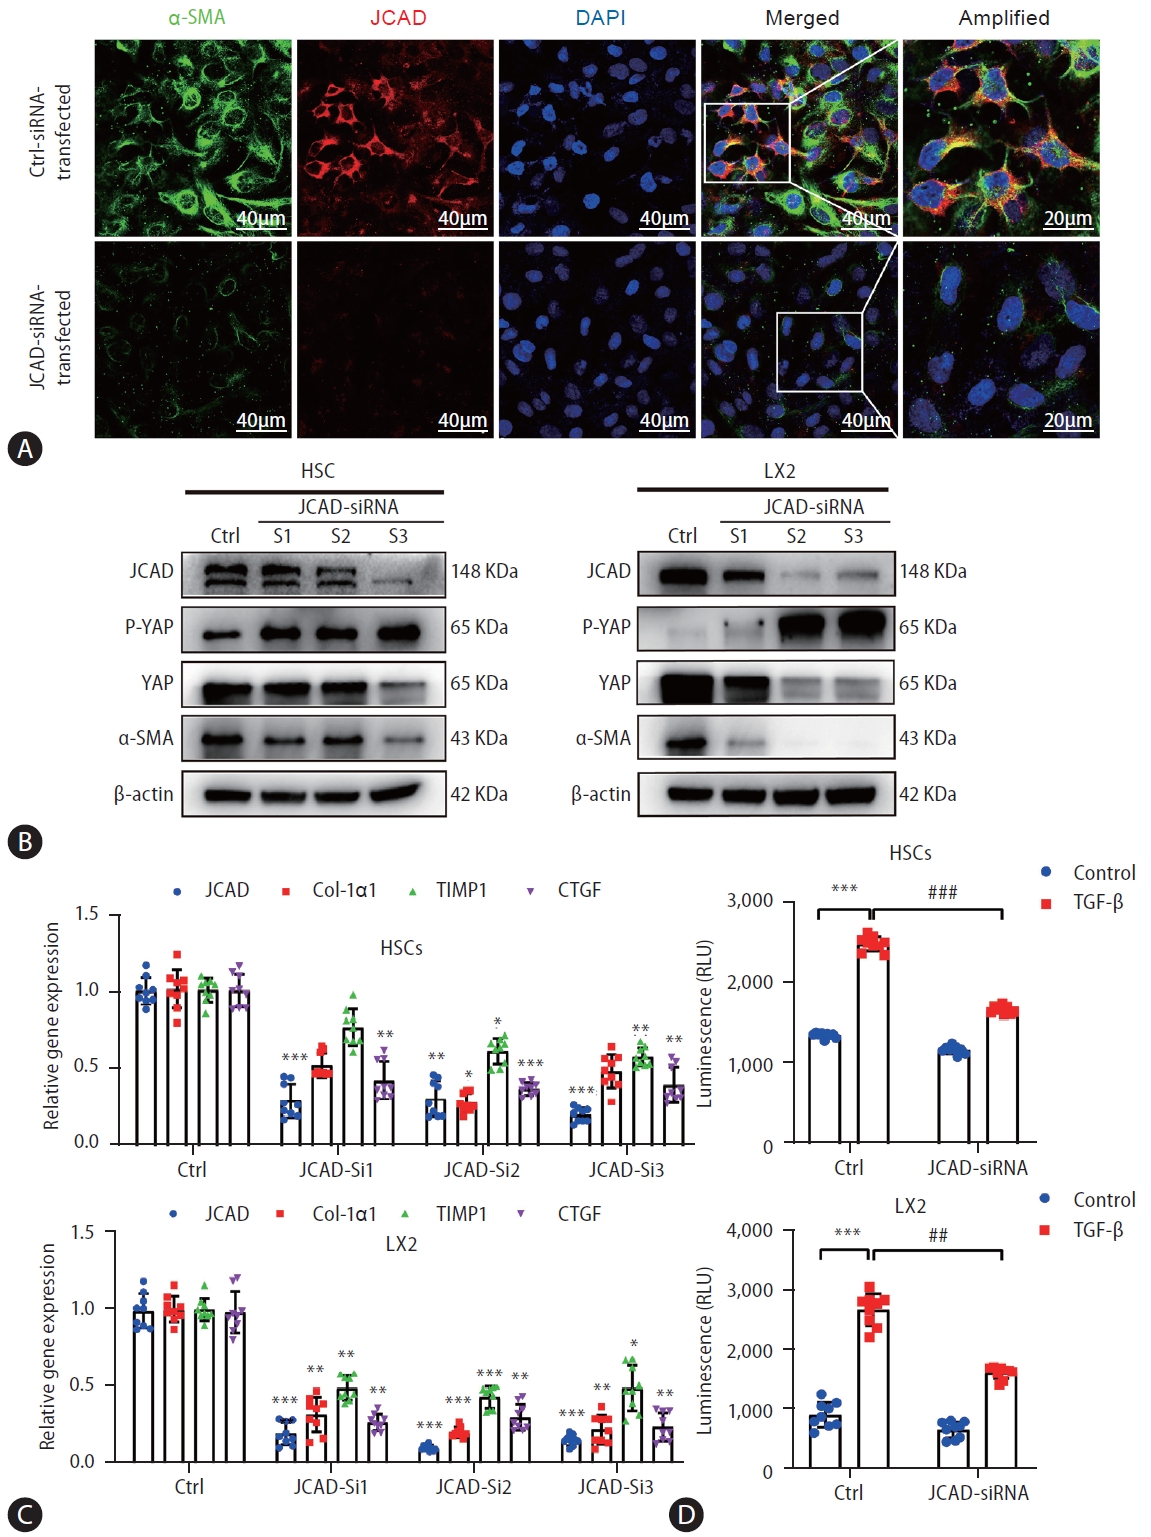
Inhibition of JCAD expression by an RNAi approach suppressed HSC activation and proliferation. (A) Immunofluorescent co-staining of JCAD with α-SMA in immortalized human LX2 cells transfected with siRNAs against human JCAD gene. Red: JCAD; Green: α-SMA; Blue: DAPI. Image amplification: 630×. Scale bars=40 μm. (B) Total protein levels of the JCAD in immortalized human LX2 and HSC cells transfected with siRNAs against the human JCAD gene (n=3). β-Actin was used as a loading control. (C) mRNA levels of JCAD, Col-Iα1, TIMP1 and CTGF in immortalized LX2 and HSC cells transfected with siRNAs against human JCAD gene (n=3). (D) The proliferation of LX2 and HSC cells transfected with siRNAs against the human JCAD gene, following TGF-β (10 ng/mL) treatment for 48 hours, was detected using Cell Titer-Lumi™ assay (n=3). The experiment was repeated at least 3 times. JCAD, junctional protein associated with coronary artery disease; HSC, hepatic stellate cells. All data were expressed as mean±standard deviation. *,**,***P<0.05, 0.01, and 0.001 compared to Ctrl-siRNA or Ctrl-DMEM. #,##,###P<0.05, 0.01, and 0.001 compared to Ctrl-TGF-β.
To further investigate whether JCAD is directly involved in modulating HSC activation, primary HSCs were isolated from WT and JCAD-KO mice and plated on plastic dishes for culture-induced activation [23]. Morphologically, quiescent HSCs stored vitamin A as cytoplasmic lipid droplets; when activated by culture in plastic dishes or profibrogenic stimulus with 10 ng/mL of TGF-β, they transformed into myofibroblast-like cells characterized by the loss of vitamin A droplets. In freshly isolated HSCs from wild-type mice, there were many small lipid droplets in the cytoplasm, and lipid droplets disappeared on the fifth day of in vitro culture. Whereas, large lipid droplets remained in the cytoplasm at day 1, and still were visible till day 5 in HSCs isolated from JCAD-KO mice (Fig. 6A). The morphology of primary HSCs was consistent with the gene expression results (Fig. 6B). Moreover, primary HSCs, isolated from WT and JCAD-KO livers were activated with stimulation of TGF-β at 10 ng/mL. JCAD deprivation significantly abrogated HSC activation and reduced expression of proliferating cell nuclear antigen (Pcna) and cyclin D1 as markers of proliferation in the presence of TGF-β (Fig. 6C, D). Even in the absence of TGF-β stimulation, expression of α-SMA, Ctgf, Timp1, and procollagen type-1α was significantly suppressed in primary HSCs isolated from JCAD-KO-BDL mice compared to those from WT-BDL mice (Fig. 6C). In summary, these findings from in vitro or ex vivo experiments argued that JCAD is essential for HSC activation in mice with BDL.

Primary stellate cells isolated from JCAD-KO mice tended to stay in a quiescent state and were resistant to TGF-β activation. Primary HSCs isolated from WT and JCAD-KO mice. Primary HSCs were cultured on coverslips for 5 days, and then treated with TGF-β (10 ng/mL) for 24 hours. (A) Differences in cell morphology viewed by an open field of microscope between primary HSC from WT and JCAD-KO mice respectively on day 1 and 5 after isolation. (B) Gene expression levels of α-SMA and CTGF in the primary hepatic stellate cell on day 1 and 5 after isolation (n=3). (C) Gene expression levels of α-SMA, C-myb, TGF-β1, Col-Iα1, Col-3α1, fibronectin, CTGF, and TIMP1 at different experimental set-ups (n=3). (D) Proliferation related-gene expression levels of PCNA and cyclin D1 in primary HSC (n=3). The experiment was repeated at least 3 times. JCAD, junctional protein associated with coronary artery disease; HSC, hepatic stellate cells; WT, wild-type; BDL, bile duct ligation; CTGF, connective tissue growth factor. All data were expressed as mean±standard deviation. *,**,***P<0.05, 0.01, and 0.001 compared to WT-Day 1 or WT-Ctrl. #,##,###P<0.05, 0.01, and 0.001 compared to WT-Day 5 or WT-TGF-β.
Inhibition of JCAD by RNAi knock-down abrogated HSC activation via the Hippo-YAP pathway
In order to prove whether JCAD acts on HSCs through the Hippo-YAP signaling axis, a YAP/TEAD-based dual-luciferase reporter assay was utilized. As shown in Figure 7A, JCAD depletion reduced YAP/TAZ/TEAD transcriptional activity, while JCAD over-expression caused a significant induction of 8xGTIIC luciferase reporter activity, with YAP siRNA and HA-YAP transfection as negative and positive controls. Furthermore, JCAD was knocked-down using siRNA transfection in LX2 cells, and thereafter, they were treated with Lats-IN-1 one day after transfection. Lats-IN-1 is a potent and ATP-competitive inhibitor of Lats1/2 kinases and drives Yap-dependent proliferation in post-mitotic mammalian cells [24]. It was observed that with the effective JCAD inhibition, the degree of HSC activation was attenuated along with decreased YAP expression (Fig. 7B). Once Lats-IN-1 was supplemented, expression of YAP and α-SMA was increased in Ctrl (scrambled)-siRNA-transfected LX2 cells; whereas their expression was not significantly changed in JCAD-siRNA-transfected cells with blocking LATS1/2 kinase activity by Lats-IN-1 (Fig. 7B, C).
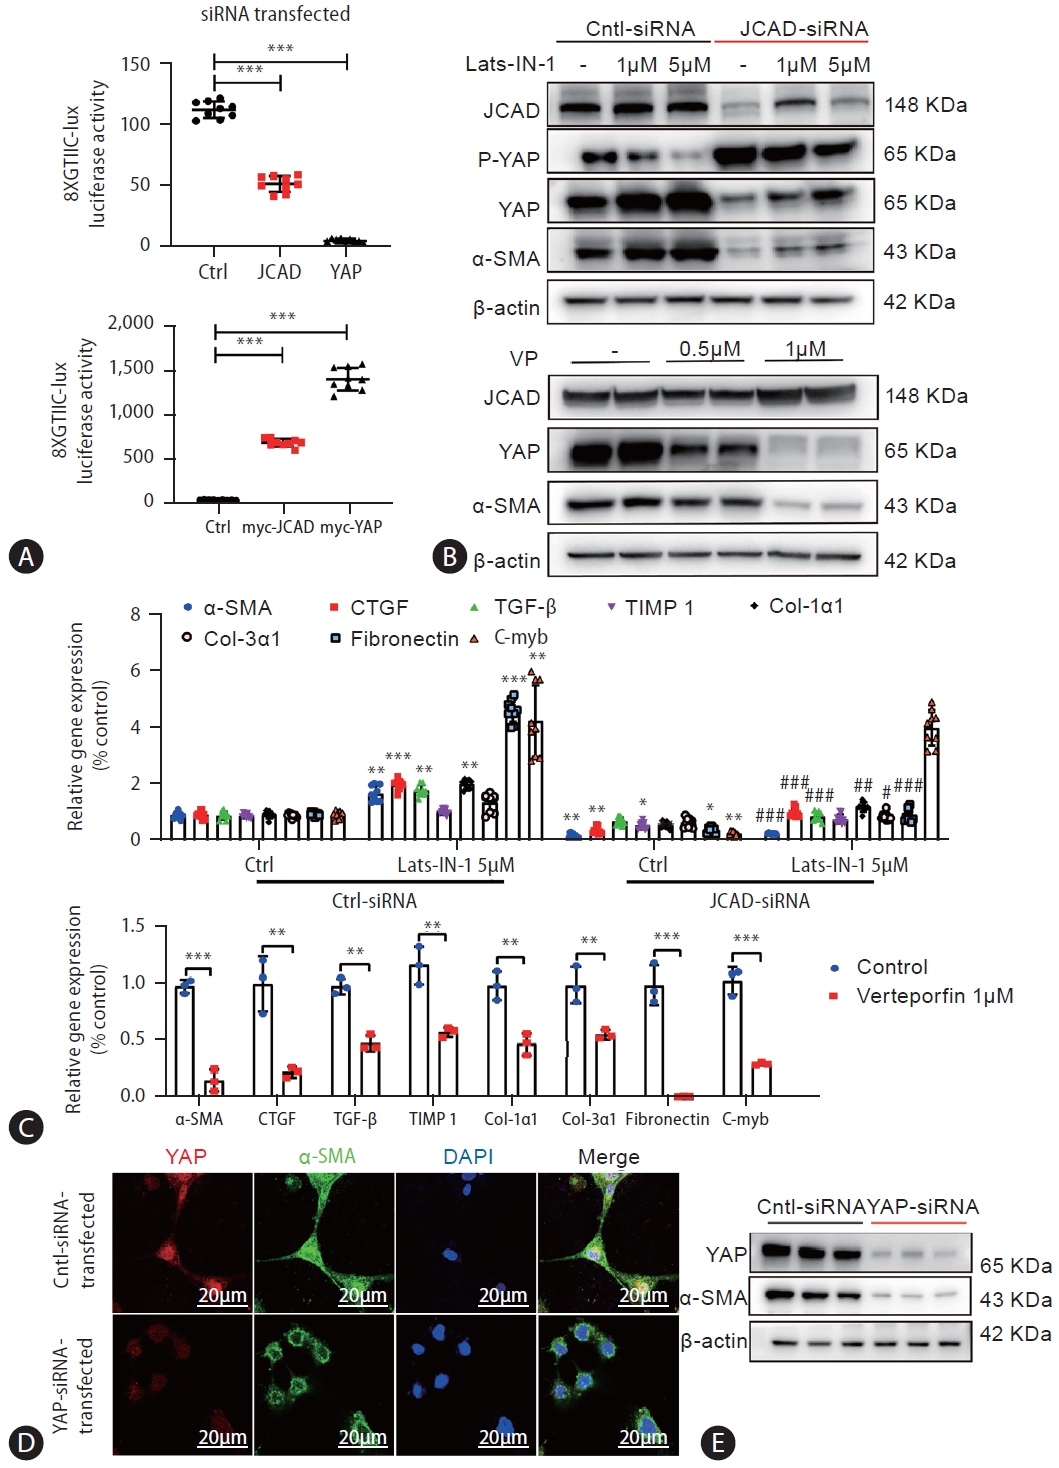
JCAD mediates hepatic stellate cell activation via the Hippo-YAP signaling pathway. (A) YAP transcriptional activity was increased by JCAD. LX2 cells were transiently transfected with JCAD-siRNA or myc-JCAD plasmid, TEAD-responsive 8X GTIIC luciferase reporter gene. Renilla luciferase reporter plasmid pRL-SV40 was used as an internal control, and YAP-siRNA or myc-YAP as a positive control (n=3). (B) LX2 cells were transfected with siRNAs against the human JCAD gene and treated with Lats-IN-1 (1 μM or 5 μM) for 24 hours. LX2 cells were treated with YAP inhibitor verteporfin (0.5 and 1 μM) for 48 hours. Total protein levels of α-SMA and YAP were assayed by Western blot (n=3). (C) LX2 cells transfected with siRNAs against the human JCAD gene were treated with Lats-IN-1 (5 μm) for 24 hours. LX2 cells were treated with YAP inhibitor verteporfin (1 μm) for 24 hours. Fibrosis-related gene expression was quantified by qRT-PCR (n=3). (D) Immunofluorescent co-staining of YAP and α-SMA in immortalized human LX2 cells transfected with the siRNA against human YAP gene. The nucleus was visualized with DAPI staining. Red: YAP; Green: α-SMA; Blue: DAPI. Image amplification: 1,260×. Scale bars=20 μm. (E) Total protein levels of the YAP and α-SMA in immortalized human LX2 cells transfected with the siRNA against the human YAP gene were analyzed by Western blot analysis. JCAD, junctional protein associated with coronary artery disease; YAP, yes-associated protein. All data were expressed as mean±standard deviation. *,**,***P<0.05, 0.01, and 0.001 compared to Ctrl-siRNA or Ctrl-siRNA-DMEM. #,##,###P<0.05, 0.01, and 0.001 compared to Ctrl-siRNA-Lats-IN-1.
Since the findings from above-mentioned experiments indicated that JCAD is positively correlated with the expression of YAP, the function of YAP during HSC activation was evaluated with two different strategies: firstly, LX2 cells were treated with the pharmacological inhibitor of YAP: verteporfin (VP), that disrupts the YAP/TEAD complex. Treatment of LX2 cells with VP at the time of seeding abolished the induction of α-SMA and YAP expression 48 hours after seeding, and suppressed expression of TGF-β, TIMP1, CTGF genes, etc. (Fig. 7B, C). Secondly, the downregulation of YAP levels was achieved by siRNA transfection. As evidenced by immunofluorescent staining and Western blot analysis, YAP expression was in accordance with decreased α-SMA expression (Fig. 7D, E, Supplementary Fig. 4A). Control cells that were transfected with scrambled siRNAs resulted in robust expression of TGF-β, TIMP1, CTGF, and COL-1α1 genes, indicating that they were efficiently activated. In contrast, these genes were not increased in LX2 cells with YAP RNAi knockdown (Supplementary Fig. 4B). Collectively, these results demonstrated that YAP is essential for HSC activation, and JCAD facilitated HSC activation via the Hippo-YAP signaling axis.
HSC-specific JCAD deletion attenuated liver fibrosis in mice
Finally, in order to further prove the rule of JCAD in HSC activation, HSC-specific JCAD knock-out mice were subjected to sham or BDL surgical procedure. As shown in Western blotting and qRT-PCR analyses, JCAD levels were down-regulated in HSCs isolated from tamoxifen (TAX)-injected mice compared to corn oil-injected mice (Supplementary Fig. 7C). The H&E staining in liver sections indicated that conditional inactivation of JCAD in HSCs did not significantly affect the extent of liver injury (Fig. 8A) and serum ALT and AST levels were similar between WT and HSC-JCAD-KO mice (data not shown). However, liver fibrogenesis was appreciably ameliorated in HSC-JCAD-KO mice after BDL as evidenced by Masson’s trichrome (Fig. 8B) and Sirius red staining (Fig. 8C), showing less fibrogenesis in HSC-JCAD-KO mice compared to WT mice after a BDL procedure.
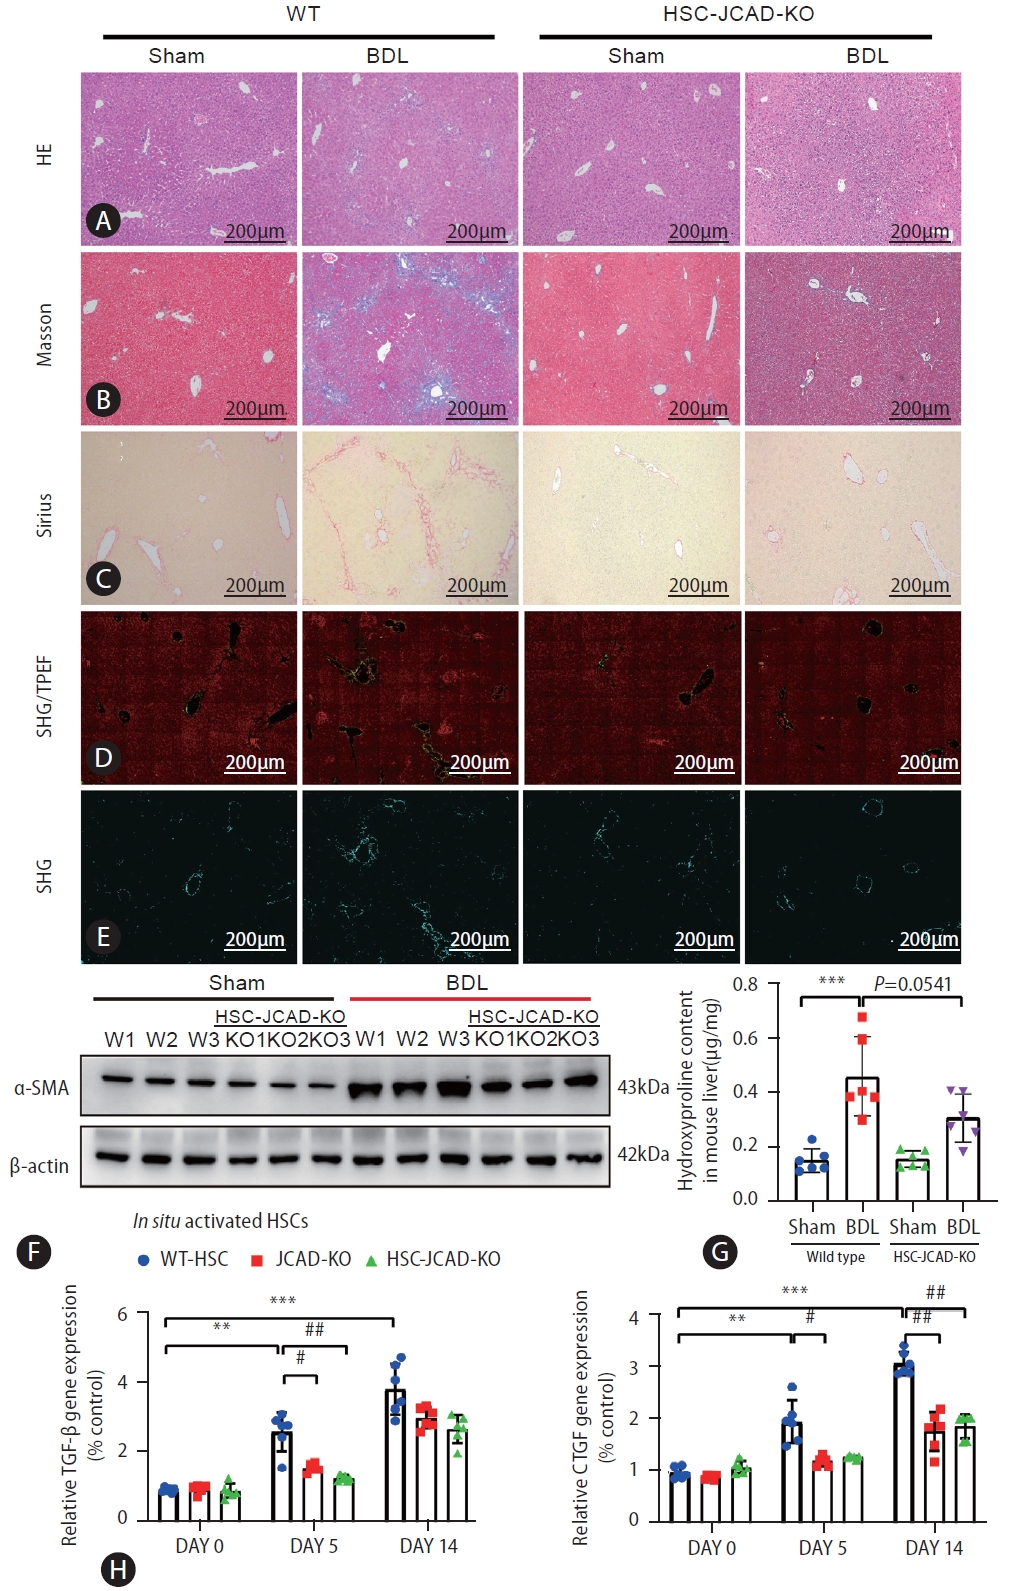
HSC-specific JCAD deletion attenuated liver fibrosis in mice. (A–C) Paraffin sections were stained with H&E, Masson’s trichrome, and Sirius. (D, E) Representative pictures of quantifying changes in protein fiber alignment in the liver as visualized by SHG/TPEF microscopy. (F) Total protein levels of α-SMA in mouse liver were assayed by Western blot (n=3). (G) Liver hydroxyproline levels were measured with a kit as described in Supplemental methods (n=6). (H) Primary HSCs were isolated from normal mice, JCAD-KO and HSC-JCAD-KO mice that underwent respectively 0, 5, and 14 days after BDL. The gene expression levels of TGF-β and CTGF were analyzed. HSCs from 3 livers were pooled to increase the yield and was seen as one ex vivo experiment, repeated 6 times. HSC, hepatic stellate cells; JCAD, junctional protein associated with coronary artery disease; SHG/TPEF, second harmonic generation/two-photon excitation fluorescence; BDL, bile duct ligation; CTGF, connective tissue growth factor; WT, wild-type. All data were expressed as mean±standard deviation. *,**,***P<0.05, 0.01, and 0.001 compared to WT-Sham or primary HSC isolated from WT mice at day 0. #,##,###P<0.05, 0.01, and 0.001 compared to primary HSC isolated from WT mice at day 5 or 14.
Second harmonic generation/two-photon excitation fluorescence (SHG/TPEF) microscopy with artificial intelligence (AI) analysis provides a standardized evaluation of liver fibrosis and collagen fiber quantitation on a continuous scale. This approach was employed to gain an in-depth understanding of fibrogenic process resulting from the BDL model. As shown in Figure 8D, 8E, HSC-JCAD-KO mice were undergone milder fibrogenesis than WT-mice. The percentage of fibrotic area was further determined in 5 separate regions: the portal tract, periportal (the area within 100 μm around the portal tract), transitional (zone 2), pericentral, and central vein areas (Supplementary Fig. 5A). The combination of periportal, transitional, and pericentral areas represents the perisinusoidal area with zone 2 being the largest component. Zonal analysis of fibrotic dynamics revealed that BDL procedure resulted in a large amount of collagen deposition in the entire liver, especially in the perisinusoidal area (Supplementary Fig. 5B, C); whereas there was less fibrotic deposition in the portal tract and central vein areas. Fibrotic extent was significantly mitigated in the HSC-specific JCAD-KO mice undergone BDL, especially in the perisinusoidal area (Supplementary Fig. 5B, C).
These observations were further verified by protein expression of α-SMA in the liver, which was highly elevated in WT-BDL mice, but alleviated in HSC-JCAD-KO-BDL mice (Fig. 8F, Supplementary Fig. 6A). Moreover, measurements of hydroxyproline levels verified that liver fibrosis was significantly attenuated in HSC-JCAD-KO mice compared to WT mice after BDL (Fig. 8G, P=0.0541). In consistency with global JCAD knockout mice, expression of fibrosis-associated genes in HSC-JCAD-KO mice after BDL was strikingly reduced (Supplementary Fig. 6B). Furthermore, HSCs were isolated 5 or 14 days after BDL, representing early and late time points of in situ HSC activation. Thereafter, expression of fibrotic genes was determined to assess extent of in situ HSC activation. As shown in Fig. 8H, Supplementary Fig. 6C, expression of Tgf-β, Ctgf, α-SMA, Col-1α1, Col-3α1 and Timp1 was markedly down-regulated in HSCs from HSC-JCAD-KO mice in comparison to those from WT mice. These findings further confirmed that JCAD was considerably essential for HSC activation in the progression of cholestatic fibrosis, implying that JCAD may be an alternative target to inhibit fibrogenesis.
DISCUSSION
Cholestatic disorders, including primary biliary cholangitis, are associated with active hepatic fibrogenesis, which ultimately advances to end-stage liver disease (cirrhosis) [25]. Available treatments for cholestatic disorders, such as ursodeoxycholic acid (UDCA), may only minimize clinical manifestations, however hardly blocks its progression to cirrhosis. In the present study, it has demonstrated that JCAD, a novel upstream regulator of the Hippo signaling pathway, is co-localized with α-SMA-positive fibroblast-like cells in the portal zone, especially in bile duct epithelial cells and activated HSCs in the livers of both patients with PBC and mice with biliary obstruction. JCAD interacts with the kinase domain of LATS2 in the Hippo signaling pathway, inhibiting its phosphokinase activity, which further results in increasing nuclear translocation of un-phosphorylated YAP [16]. In the current study, it is hypothesized that as a transcription coactivator in the Hippo-YAP signaling axis, YAP is actively involved in HSC activation, proliferation and fibrogenic process. Therefore, increased JCAD could be critical for cholestatic fibrogenesis; whereas JCAD deficiency ameliorates fibrotic deposition in a mouse model cholestasis caused by BDL, highlighting a potentially therapeutic avenue for selectively targeting an aberrant JCAD-Hippo-YAP axis in cholestatic disorders.
BDL is a well-known experimental model to induce cholestatic injury and periportal biliary fibrosis, which etiologically and pathogenically mimics cholestatic fibrosis in humans to a great extent [26]. Although PFs may participate in bile duct reaction and early ductular injury repair [27], recent data from lineage-tracing experiments indicate that among populations of ECM-producing or fibrogenic cells, HSCs are considered to be the major cell type for excessive production of EMC components in the BDL model and that activation of HSCs is a key initiating event in hepatic fibrogenesis [9]. Once activated, they transform into myofibroblast-like cells that drive excessive production of collagen content, resulting in fibrotic deposition in the liver. In the present study, JCAD was first identified as a critical regulator for HSC activation in the progression of cholestatic fibrosis. Given that JCAD was strongly positive in the portal triads of the liver tissue from PBC patients, consistent with the elevation of YAP protein in fibrotic livers after BDL, JCAD may function as a crucial signaling molecule in the regulation of biliary hyperplasia and fibrosis following BDL or in cholestatic disorders. In preliminary experiments, incubation of either human HSC lines or primary mouse HSCs with diluted bile collected from BDL mice significantly increased JCAD protein and mRNA levels, indicating bile acids, the main components in the bile, may stimulate activation of JCAD during cholestasis(Supplementary Fig. 7A–C).
In order to in-depth delineate pathophysiological role of JCAD, JCAD-KO and HSC-specific conditional JCAD knockout (JCADflox/flox, GFAP-cre+/+) mice were utilized to examine the role of JCAD during liver fibrosis especially in HSCs in the present study. Either global deficiency or HSC-specific JCAD knockout significantly suppressed liver fibrosis after BDL, as evidenced by remarkably decreased liver hydroxyproline content and improved histopathology. Primary HSCs were isolated from WT and JCAD-KO mice to further evaluate whether JCAD is directly involved in influencing HSC activation and proliferation. JCAD deprivation significantly diminished fibrosis-associated genes and decreased HSC proliferation regardless whether they were plated on plastic dishes for culture-induced activation or under TGF-β stimulation. Furthermore, in situ-activated HSCs derived from JCAD-KO mice undergone BDL exhibited reduced expression of fibrosis-associated genes in comparison to WT animals, which further supports the notion that JCAD is critical for HSC activation in cholestatic conditions.
Moreover, the findings in the present study delineated that JCAD acts on HSC activation through the Hippo-YAP signaling axis. It was demonstrated that JCAD regulates cell proliferation and tumor progression by interacting with the kinase domain of LATS2 and inhibiting its phosphokinase activity, impeding the phosphorylation of YAP, and increasing nuclear translocation of un-phosphorylated YAP in NASH-HCC in our previous study [16]. However, its participation in HSC activation and fibrogenesis has not been explored in well-established animal models. It is initially confirmed that HSCs expressed JCAD at both RNA and protein levels, and that its expression was in the same trend along with fibrogenic markers, such as α-SMA, while suppressing JCAD expression in stellate cells decreased YAP expression in the present study. Next a YAP/TEAD-based dual luciferase reporter was used to further demonstrate the critical role JCAD through the Hippo-YAP axis in HSCs. As expected, JCAD inhibition by siRNAs decreased the transcriptional activity of YAP/TEAD. This finding goes along with recent studies, which demonstrated that the Hippo pathway interacts with the TGF-β/Smad pathway through interaction of YAP/TEAD with Smad at transcription level [28,29]. As the downstream target gene, CTGF, was overexpressed in activated HSCs in the present study, which is a strong cytokine eliciting the synthesis and secretion of ECM proteins, in majority of fibrillar collagens for fibrous deposition [30]. Furthermore, when YAP was inhibited with siRNAs or with VP, a well-recognized YAP inhibitor, in HSC lines, expression of fibrotic genes was remarkably suppressed, which is in accordance with the reports by others [31-33], indicating the participation of the Hippo-YAP signaling axis in HSC activation and EMC production.
To further clarify that JCAD increases YAP nuclear translocation via LATS2, a LATS2 kinase inhibitor, Lats-IN-1, was used. Notably, Lats-IN-1 effectively increased the protein level of un-phosphorylated YAP, along with increased expression of fibrosis-associated genes and proteins. However, their expression was not significantly changed in JCAD-siRNA-transfected cells after blocking LATS2 kinase activity by Lats-IN-1. These results confirmed the significance of Hippo-YAP signaling axis in the initiation and perpetuation of HSC activation. In speculation, suppressing JCAD subsequently restrained the nuclear translocation of YAP might be a possible strategy in ameliorating liver fibrosis.
JCAD was originally recognized as a molecular component of the E-cadherin-based cell-cell junction in vascular endothelial cells [12,14,34]. A recent study demonstrated that JCAD has a functionally conserved domain that resembles ROCK1/2 in p38 MAPK pathway, which is critical for F-actin stress fiber formation [12]. Moreover, JCAD has been shown to interact with several actin-binding proteins (e.g., TRIOBP), to regulate F-actin [15]. It is known that the reorganization of the F-actin cytoskeleton is associated with HSC activation and that the p38 MAPK pathway is involved in this process [35]. Hence, it is intriguing to determine whether F-actin plays a part regarding how JCAD affects HSC activation as further investigation. In addition, it is worthy to note that global JCAD-KO presented a more profound phenotype than HSC-JCAD-KO in the present study. Two potential explanations might be attributed to this phenomenon. Firstly, although advanced genetic techniques have provided strong evidence that HSCs are the predominant source of myofibroblasts in cholestatic liver injury [9,36], it was reported that PFs contribute to biliary fibrosis caused by BDL or 3,5-diethoxycarbonyl-1,4-dihydrocollidine diet diet at early stages [36]. Secondly, as visualized in immunohistochemical staining in serial paraffin sections of PBC patients, JCAD was strongly positive in the portal area, which suggests that the function of JCAD in cholangiocytes in cholestasis-associated fibrosis is worthy of investigation. Therefore, further studies as described above are warranted to investigate the role of JCAD in other cell types in cholestatic diseases.
In conclusion, the findings in the present study demonstrated that JCAD is a positive regulator of hepatic fibrogenesis in cholestatic conditions. HSC-specific JCAD knockout effectively halted hepatic fibrosis induced by bile duct ligation, and the underlying mechanisms are associated with suppressed Hippo-YAP signaling activity in HSCs. The elucidation of the critical role of this conjunctional protein in HSCs would facilitate the development of molecular interventions for cholestasis-associated fibrosis.
Notes
Authors’ contribution
The authors declare that they have participated in the preparation of the manuscript and have seen and approved the final version. Li Xie and Jian Wu designed all experiments; Li Xie, Hui Chen, Li Zhang, Yuan Zhou, Yong-Yu Yang, Chang Liu, Yu-Li Wang, Yue Ma, and Ya-Jun Yan performed all experiments and analyzed the data. Li Xie wrote the manuscript with the help of Jia Ding. Xiao Ten and Qiang Yang provided SHG/TPEF microscopy and AI analyses. Xiu-Ping Liu and Jian Wu provided the conceptual framework for the study. Jian Wu is responsible for the manuscript’s finalization.
Conflicts of Interest
All authors declare that no conflict of interest is involved in participation or contribution to the present work.
Acknowledgements
Part of the present study was presented orally in a session of basic research in liver fibrosis and cirrhosis, in Single-Topic Symposium of Hepatic Fibrosis, the Asian-Pacific Association of Live Study, 3–5 June 2022 in Beijing, China, and the 74th Annual Liver Meeting of the American Association for the Study of Liver Diseases (AASLD), Nov. 10–15; 2023, Boston, MA, USA, and published in an abstract in Hepatology 2023;78:S2074.
This work is supported by the National Natural Science Foundation of China (NSFC #82370625, 82170624, 81871997, 81572356), Shanghai Commission of Sciences and Technologies (#16140903700), and the National Key R/D Program of China (#2016YFE0107400) to J.W.; Natural Science Foundation of Shanghai (#21ZR1450300) to X-P. L.
Abbreviations
ALT
alanine aminotransferase
AST
aspartate aminotransferase
BC
bile canaliculi
BDL
bile duct ligation
BECs
bile epithelial cells
CCL2
C-C motif chemokine ligand 2
CTGF
connective tissue growth factor
DMEM
Dulbecco’s modified Eagle’s medium
ECs
endothelial cells
ECM
extracellular matrix
EdU
5-ethynyl-2’- deoxyuridine
HQ
hydroxyproline quantitation
HSCs
hepatic stellate cells
H&E
hematoxylin and eosin
IL6
interleukin-6
IBDM
intrahepatic bile duct mass
IHC
immunohistochemical
JCAD
junctional protein associated with coronary artery disease
LSEC
liver sinusoidal endothelial cells
LD
lipid droplets
PBC
primary biliary cholangitis
PVDF
polyvinylidene fluoride
qRT-PCR
quantitative reverse transcriptase polymerase chain reaction
α-SMA
smooth muscle α-actin
TGF-β
transforming growth factor-β
VEGF
vascular endothelial growth factor
YAP
Yes-associated protein
SUPPLEMENTAL MATERIAL
Supplementary material is available at Clinical and Molecular Hepatology website (http://www.e-cmh.org).
Primers for identification of mouse
Sequences for siRNAs
Antibodies used for western blot (WB), immunohistochemical (IHC) and immunofluorescent staining (IF)
qRT-PCR primers
BDL model induces severe liver injury and liver fibrosis. (A) Representative micrographs of gross liver images, H&E staining, Masson’s trichrome and Sirius staining of livers. Images were taken at original magnification (100×). Scaleb ars=200 μm. A red dotted line showed a huge gallbladder. Black arrows points to the necrosis area. (B) Relative mRNA levels of Jcad, α-SMA, Tgf-β, Ctgf, CoI-1α1 and Ck19 in mouse liver were determined by quantitative RT-PCR analysis. n=6 in each group. All data were expressed as mean±SD. *,**,***P<0.05, 0.01, and 0.001 vs.W T-Sham mice.
JCAD depletion partially rescued the liver damage by bile duct ligation. (A) The liver weight, body weight, liver/body weight ratios of WT-Sham, WT-BDL, JCAD-KO-Sham and JCAD-KO-BDL mice (n=6). (B) Increased AST, ALT, TBA, DBL, IBL and TBL levels in WT-BDL mice, while alleviated in JCAD-KO-BDL mice. Data are expressed as mean±SD, n=6 in each group. *,**,***P<0.05, 0.01, and 0.001 vs. WT-Sham mice; #,##,###P<0.05, 0.01, and 0.001 vs. WT-BDLm ice.
Decreased hepatic fibrogenesis and bile duct reaction in JCAD-KO-BDL mice. (A) Representative micrographs of Ki67 in livers of all groups. Images were taken at original magnification (100×). Scale bars=200 μm. (B) CK19 and Ki67-positive cells were counted. N=6 in each group. Images were taken at original magnification (100×) and the mean of 5 fields of view was calculated for each mouse. (C) Morphometrical quantitation of Masson and Sirius Red staining positive area (n=6). Images were taken at original magnification (100×) and the mean of 5 fields of view was calculated for each mouse. (D) Relative mRNA levels of Ctgf and CoI-1α1 in mouse liver were determined by quantitative RT-PCR analysis. Data are expressed as mean±SD, N=6 in each group. *,**,***P<0.05, 0.01, and 0.001 vs. WT-Sham mice; #,##,###P<0.05, 0.01, and 0.001 vs. WT-BDL mice.
Inhibition of YAP blocked HSC activation in vitro. (A) The semi-quantitative determination of YAP and α-SMA protein expression (n=3). β-Actin was used as a loading control. (B) mRNA levels of fibrosis-related genes like α-SMA, YAP, TGF-β, TIMP-1, CTGF, COL-1α1, COL-3α1, C-MYB, etc. in immortalized LX2 cells transfected with the siRNA against human YAP gene were quantified by qRT-PCR (n=3). The experiment was repeated at least 3 times. All data were expressed as mean±SD. *,**,***P<0.05, 0.01, and 0.001 compared to Ctrl-DMEM or CtrlsiRNA.
HSC-specific JCAD depletion mitigated liver fibrosis especially in the perisinusoidal area. (A) Second harmonic generation/two-photon excitation fluorescence (SHG/TPEF) microscopy technology detection schematic diagram. (B) Heatmap for collagen fiber quantitation on a continuous scale by SHG/TPEF microscopy. (C) Zonal fibrosis quantitation, as a percentage change of fibrosis area, reveals marked fibrosis reduction in the perisinusoidal area (n=3). All data were expressed as mean±SD. *,**P<0.05, and 0.01 vs. WT-Sham mice; #P<0.05 vs. WT-BDL mice.
Hepatic stellate cell-specific deletion of JCAD attenuated liver fibrosis in mice. (A) The semi-quantitative determination of α-SMA protein expression. β-Actin was used as a loading control (n=3). (B) Gene expression of WT and JCAD conditional knockout mouse (HSC-JCAD-KO) liver after BDL. (C) Primary HSCs were isolated from normal mice, JCAD-KO and HSC-JCAD-KO mice that underwent respectively 0, 5, and 14 days after BDL. mRNA levels were analyzed by quantitative RT-PCR analysis. HSCs from 3 livers were pooled to increase the yield and was seen as one ex vivo experiment, repeated 6 times (n=6). All data were expressed as mean±SD. *,**,***P<0.05, 0.01, and 0.001 compared to WT-Sham or primary HSC isolated from WT mice at day 0. #,##,###P<0.05, 0.01, and 0.001 compared to WT-BDL or primary HSC isolated from WT mice at day 5 or 14.
Bile acid directly affected JCAD expression in HSCs. (A) Western blot analysis of JCAD protein level in human HSC lines. β-Actin was used as a loading control (n=3). (B) JCAD gene expression levels were analyzed in human HSC line (n=3). (C) Primary HSCs were isolated from normal mice. JCAD gene expression was quantified by qRT-PCR. HSCs from 3 livers were pooled to increase the yield and were seen as one ex vivo experiment, and experiments were repeated for 3 times. All data were expressed as mean±SD. *,**P<0.05 and 0.01 compared to Ctrl-DMEM.
Establishment of JCAD conditional knockout mouse clones. (A) A schematic diagram illustrating JCAD conditional mouse construct. (B) Tail DNA genotyping of HSC-JCAD-KO mice. (C) Both Western blotting analyses and qPCR results showed that JCAD levels were down-regulated in HSCs isolated from tamoxifen (TAX)-injected mice compared to corn oil-injected mice. For western blotting analyses, HSCs from 5 livers were pooled to increase the yield and was seen as one ex vivo experiment, repeated 2 times. For qRT-PCR analysis, HSCs from 3 livers were pooled to increase the yield and was seen as one ex vivo experiment, repeated 3 times (n=3). (D) Cre activity was detected in primary stellate cells isolated from tamoxifen (TAX)- injected HSC-JCAD-KO mice. Corn oil was used as solvent for TAX injection. All data were expressed as mean±SD. ***P<0.001 vs. WT mice.
References
Article information Continued
Notes
Study Highlights
• JCAD was highly expressed in fibroblast-like cells in PBC specimens and in mice with bile duct ligation.
• Global JCAD knock-out alleviated bile ductular reaction and fibrosis after BDL.
• JCAD knock-down abrogated HSC activation via the Hippo-YAP pathway.
• HSC-specific JCAD deletion further augured its promoting effect in HSC activation.
• JCAD is a potential therapeutic target in cholestatic liver disease.