


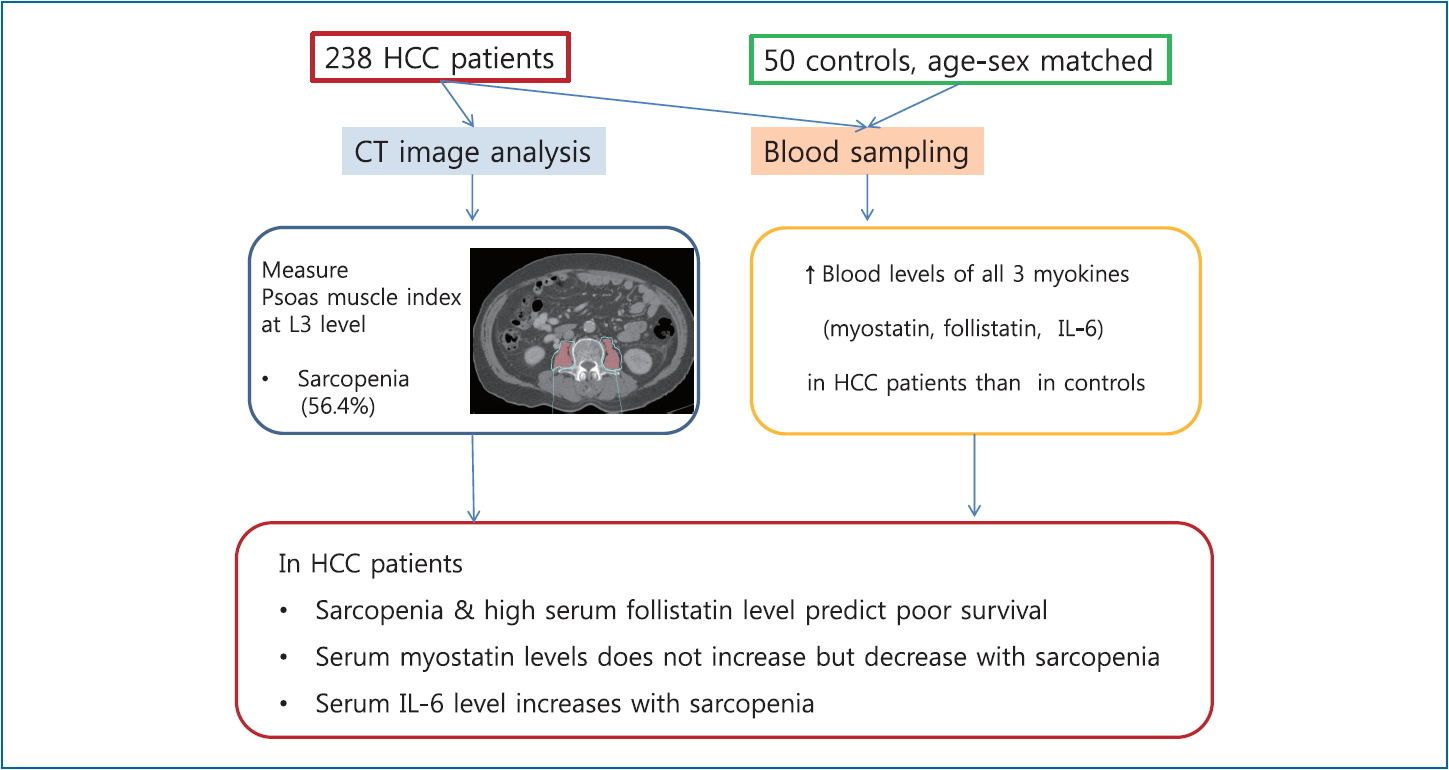
Graphical Abstract
INTRODUCTION
Sarcopenia, defined as a decline in skeletal muscle mass and strength, is increasingly important in the aging society. Currently, the measurement of appendicular lean mass using bioelectrical impedance analysis (BIA) or dual energy X-ray absorptiometry is the standard diagnostic modality of sarcopenia, which is stratified by gender. Evaluation of hand grip strength or gait speed provides additional accuracy for the diagnosis of sarcopenia [1,2].
However, diagnosis of sarcopenia is not simple. The cut-off for those diagnostic criteria varies according to the race or country because of different physiques. Usually, the cut-off value has been set as below 2 standard deviations (SD) from the mean for young adults or as being in the bottom quintile, resulting in different cut-off values among various populations [3,4]. Moreover, BIA may not be accurate for the diagnosis of sarcopenia in patients with chronic liver disease with ascites or edema, such as liver cirrhosis, hepatocellular carcinoma (HCC), and liver transplantation [5,6]. In those patients, diagnosis of sarcopenia is important because of its deleterious role in the outcomes, which can be intervened upon by reinforcement of nutrition and exercise [7].
Aside from the measurement of muscle mass and muscle strength, several serum biomarkers related to sarcopenia are being developed. There are many adipomyokines, secreted by skeletal myocytes or adipocytes, including muscle growth inhibitors (interleukin-6 [IL-6], myostatin, activins A/B, growth and differentiation factor 15) and muscle growth promoters (follistatin, irisin, bone morphogenetic protein [BMPs], and brain-derived neurotrophic factor) [8-11]. A recent study from Japan suggested the use of the serum myostatin level as a potential biomarker, showing that a high myostatin level was associated with sarcopenia and a reduced survival rate in liver cirrhosis patients [12].
However, there have been no studies that have measured the serum levels of those adipomyokines among HCC patients, although sarcopenia is an independent factor for poor survival in HCC regardless of the stage of the tumor, degree of liver function, or cirrhotic status [7]. The aim of this study was to investigate the serum levels of myostatin, follistatin, and IL-6, and to evaluate their association with sarcopenia and survival in HCC patients.
PATIENTS AND METHODS
HCC patients and healthy controls
We prospectively enrolled 258 newly diagnosed HCC patients at Seoul National University Bundang Hospital from January 2012 to December 2015, and followed them up until December 2017. After the exclusion of 20 patients whose serum samples were not available, 238 patients with HCC were the final subjects of this study. HCC was diagnosed according to histological findings or typical imaging characteristics as defined by the Korean Liver Cancer Study Group and National Cancer Center guidelines, which are similar to international guidelines [13]. All of the subjects provided written informed consent, and this study was approved by the Institutional Review Board (IRB) of Seoul National University Bundang Hospital (B-1810-497-301). All methods were performed in accordance with national guidelines and regulation. Plasma samples from 50 healthy controls, which were matched for age and sex to the HCC patients, were obtained from a repository that included anonymized clinical data after IRB approval (B-1307/210-006).
Clinical data collection and follow up of the subjects
The clinical data at the diagnosis of HCC were entered into a predefined electronic case report form, which included age, sex, height, weight, alcohol intake, smoking history, performance status, etiology of HCC, comorbidities, blood levels of alpha-fetoprotein (AFP), albumin, serum aspartate aminotransferase (AST), alanine aminotransferase, total bilirubin, prothrombin time expressed as international normalized ratio, platelet count, creatinine, sodium, Child-Pugh score and class, model for end stage liver disease (MELD) score, tumor size, number, vascular invasion, TNM stage based on American Joint Committee on Cancer, 7th edition [14], and Barcelona Clinic Liver Cancer (BCLC) stage [15].
The patients were prospectively followed for a median duration of 31.8 months until December 2017. The assessment of tumor response after treatment followed the modified Response Evaluation Criteria in Solid Tumors criteria using dynamic contrast enhanced computed tomography (CT) or magnetic resonance imaging (MRI), and complete remission was defined as disappearance of any intratumoral arterial enhancement in all target lesions. Recurrence of HCC was defined as the development of any new lesions or a new enhancing portion in the treated target lesion, and confirmed by medical records and CT or MRI images. The death of each patient was confirmed by a request to the Statistics Korea, and the cause of death was confirmed through a review of the medical records.
Measurement of the psoas muscle area, calculation of the psoas muscle index (PMI) and determination of the cut-off for sarcopenia in HCC patients
Multiphase CT scans were performed within 60 days of the diagnosis. We used a multidetector-row CT machine (Brilliance 64 or iCT256; Philips Medical Systems, Cleveland, OH, USA) for contrast enhancement CT examinations. Using a power injector (Stellant D, Medrad, Indianola, PA, USA), an intravenous non-ionic contrast material (2 mL/kg, iomeprol; 350 mg iodine/mL, Iomeron 350; Bracco, Milano, Italy) was administered through the antecubital vein.
The 2-dimensional cross-sectional area of the bilateral psoas muscles on the pre-contrast enhanced phase image was measured at the middle level of the third lumbar vertebra (L3). We used the Rapidia 3D software (v2.8; INFINITT Healthcare, Seoul, Korea) to outline the psoas muscle boundary. The borders of the psoas muscles were manually outlined at a setting from 31 to 100 Hounsfield Units to exclude more strictly the vasculature and areas of fatty infiltration [16-19]. The measured psoas muscle area was divided by the patient height squared for the calculation of the PMI (cm2/m2). For the measurement of the PMI, one fellow researcher (HYJ) and one research nurse (SHH) independently measured the same group of CT images from 20 randomly selected patients and compared the results. The interobserver agreement was 97%, and then, the research nurse completed the measurement of the whole series of CT images from the subjects.
To determine the sex-specific cut-offs of the PMI for defining sarcopenia, we used the R software package (version 3.3.2; R Foundation for statistical Computing, Vienna, Austria; http://www.R-project.org/) for optimum stratification which found the most significant value by using the log-rank chi-square statistic [20,21]. The cut-off values for the PMI were set at 4.98 cm2/m2 for male patients, and 1.17 cm2/m2 for female patients.
Blood sample storage and measurement of the serum levels of myostatin, follistatin, and IL-6
Blood samples were collected from the HCC patients before treatment, and serum aliquots were stored at -70┬░C until the time of the measurement. Serum or plasma levels of myostatin, follistatin and IL-6 in the healthy controls and HCC patients were assessed using the commercial Quantikine ELISA Immunoassays (R&D Systems, Inc., Minneapolis, MN, USA) following the manufacturerŌĆÖs instructions and done in duplicates by an experienced researcher (YSC).
Statistical analysis
The data were presented as the mean┬▒SD or the median with the interquartile range for continuous variables, and as a number and percentage for categorical variables. StudentŌĆÖs independent t-test (continuous parametric variables) and PearsonŌĆÖs chi-square (categorical variables) were used to compare the two groups. A two-tailed P-value of <0.05 was considered statistically significant. SpearmanŌĆÖs rank correlation was used to find the correlation between the PMI and the level of myostatin, follistatin and IL-6, and the coefficient of the correlation was indicated as SpearmanŌĆÖs rho (Žü).
Overall survival and recurrence-free survival were analyzed with Kaplan-Meier curves, and the log-rank test was used to compare the survival between the two groups. To determine the independent factors for the overall survival of the HCC patients, univariate and multivariate analyses were performed. For the multivariable analyses using the Cox proportional hazard model, we put the variables, that had P<0.1 for the correlation with mortality in the univariable analysis and selected the most fitted final multivariable model. All statistical analyses were performed using SPSS Statistics (version 22.0; SPSS Inc., Chicago, IL, USA).
RESULTS
Baseline characteristics of the HCC patients and healthy controls
The baseline characteristics of the 238 HCC patients and 50 healthy controls are summarized in Table 1. There were no missing data for any variables among the HCC patients in Table 1. The HCC patients had a median age of 59 years; 81% were male; 70% had hepatitis B virus (HBV) surface antigen positivity, and the median body mass index (BMI) was 23.7 kg/m2. The ChildPugh class was A in 85.7% and B in 14.3%, and there was no class C in this study. The median tumor size was 3.5 cm in diameter, and the BCLC stage 0, A, B, and C were 18.1%, 39.9%, 18.1%, and 23.9%, respectively. The high proportion of HCC patients receiving transarterial chemoembolization (TACE) could be explained as the availability of superselective TACE experts in this center, and as such, physicians and patients tended to prefer TACE to resection as the first treatment with curative intention, especially in the case of old age, marginal liver function or more than one lesion number.
During a median follow-up of 31.9 months, 45 patients died (18.9%). The median overall survival was 31.9 months (range, 1.1ŌĆō67.9), and the median recurrence-free survival was 19.5 months (range, 0.7ŌĆō66.4).
The 50 plasma samples were obtained from a remote repository of health check examinees showing normal laboratory results and diagnosed as healthy persons; their median age was 64 years, and the male proportion was 80%.
Serum levels of myostatin, follistatin and IL-6 and their relationship with the PMI according to gender in the HCC patients
The median serum levels of myostatin, follistatin and IL-6 in the 50 healthy controls (3,150.8, 1,248.4, and 0.81 pg/mL, respectively) and 238 HCC patients (3,816.3, 2,131.2, and 2.52 pg/mL, respectively) are summarized in Table 2. The serum levels of the above 3 cytokines were all significantly higher in the HCC patients than in the healthy controls. Moreover, the serum median levels of myostatin were higher in the male (3,979.3 pg/mL) than in the female HCC patients (2,976.3 pg/mL) (P<0.001), while both the follistatin and IL-6 levels were not significantly different between the male and female HCC patients. All the serum levels of the 3 myokines of the HCC patients and healthy controls are plotted in Supplementary Figure 1.
The median level of PMI was 4.43 cm2/m2 in the male and 2.17 cm2/m2 in the female HCC patients (Table 2). According to the optimized cut-off of 4.98 cm2/m2 for male patients and 1.17 cm2/m2 for female patients, the prevalence of sarcopenia was 56.4% overall (135/238), 67.4% in the male and 11.2% in the female patients, showing a remarkably high prevalence in the male HCC patients. Compared to the non-sarcopenic group, the sarcopenic group had a higher proportion of male patients, a lower BMI, a higher proportion of smoking and larger tumor size (Table 3).
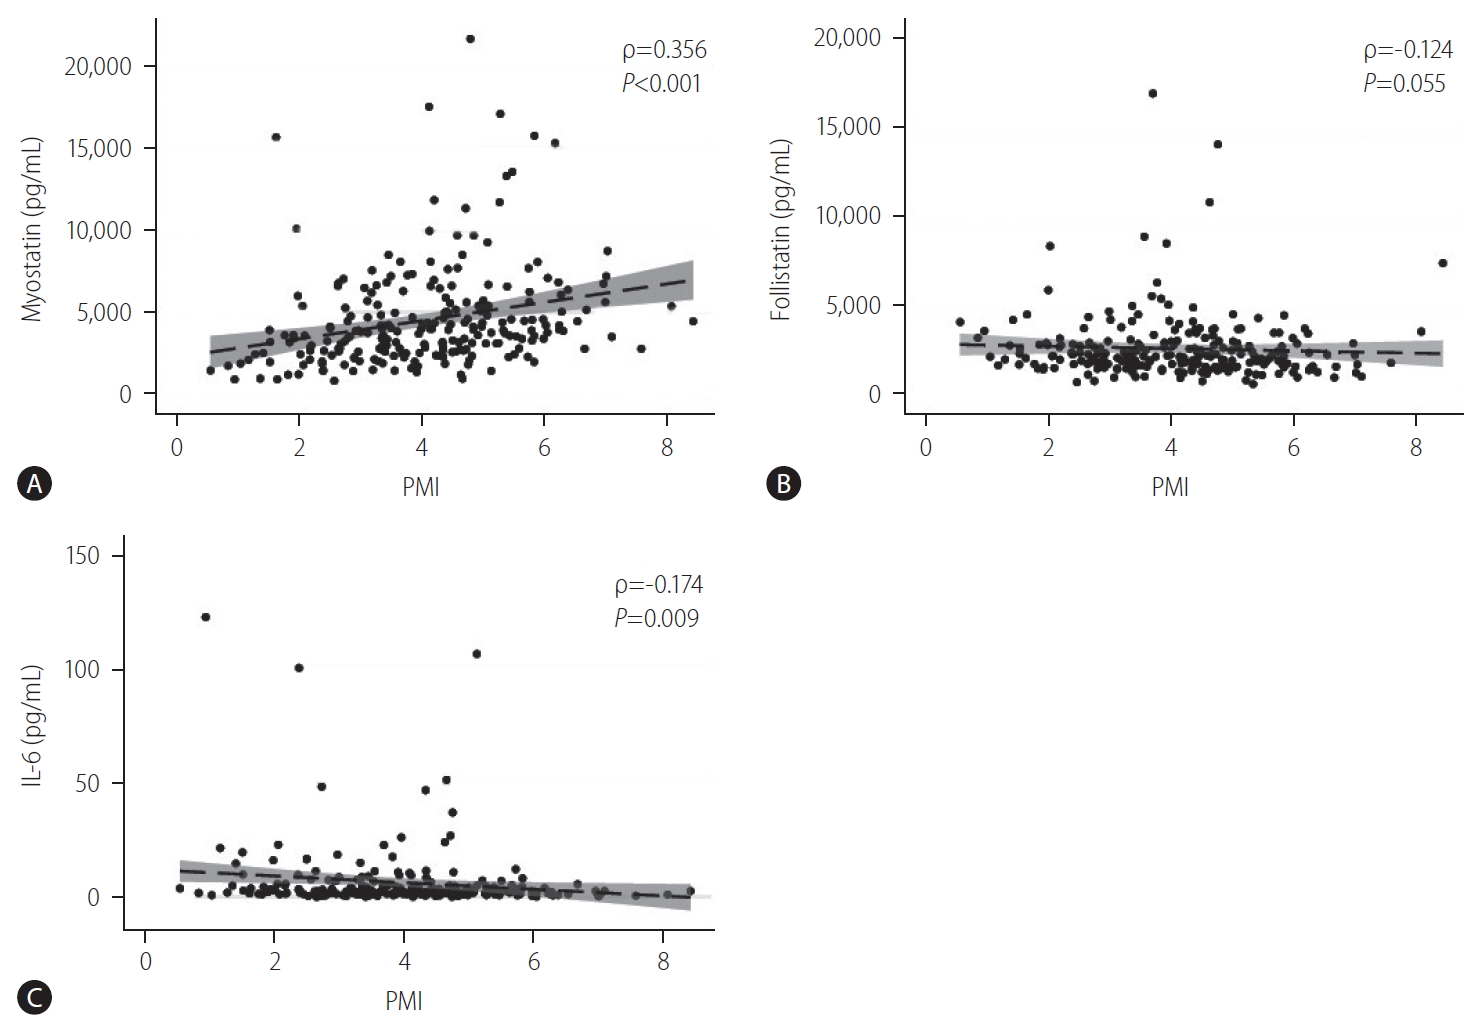
The relationship between myostatin, follistatin and IL-6 each with PMI is shown in Figure 1. The serum myostatin levels showed a positive correlation with the PMI (Žü=0.356, P<0.001), suggesting that the myostatin level increased with increasing muscle mass, though the correlation was weak. In contrast, the serum IL-6 levels showed a weakly negative correlation with the PMI (Žü=-0.174, P=0.009), such that the IL-6 levels increased with progressive sarcopenia. The serum follistatin levels tended to be negatively correlated with the PMI (Žü=-0.124, P=0.055) with borderline statistical significance, but it was significantly correlated in female patients (Žü=-0.316, P=0.034; Supplementary Table 1).
Among the 3 myokines, the IL-6 levels showed a negative correlation with the myostatin (Žü=-0.288, P<0.0001) and a positive correlation with the follistatin level (Žü=0.422, P<0.0001). The serum myostatin level was negatively correlated with the follistatin level significantly (Žü=-0.218, P=0.0007, Supplementary Fig. 2).
Serum levels of myostatin, follistatin and IL-6 and their relationship with liver function and tumor extent in HCC patients
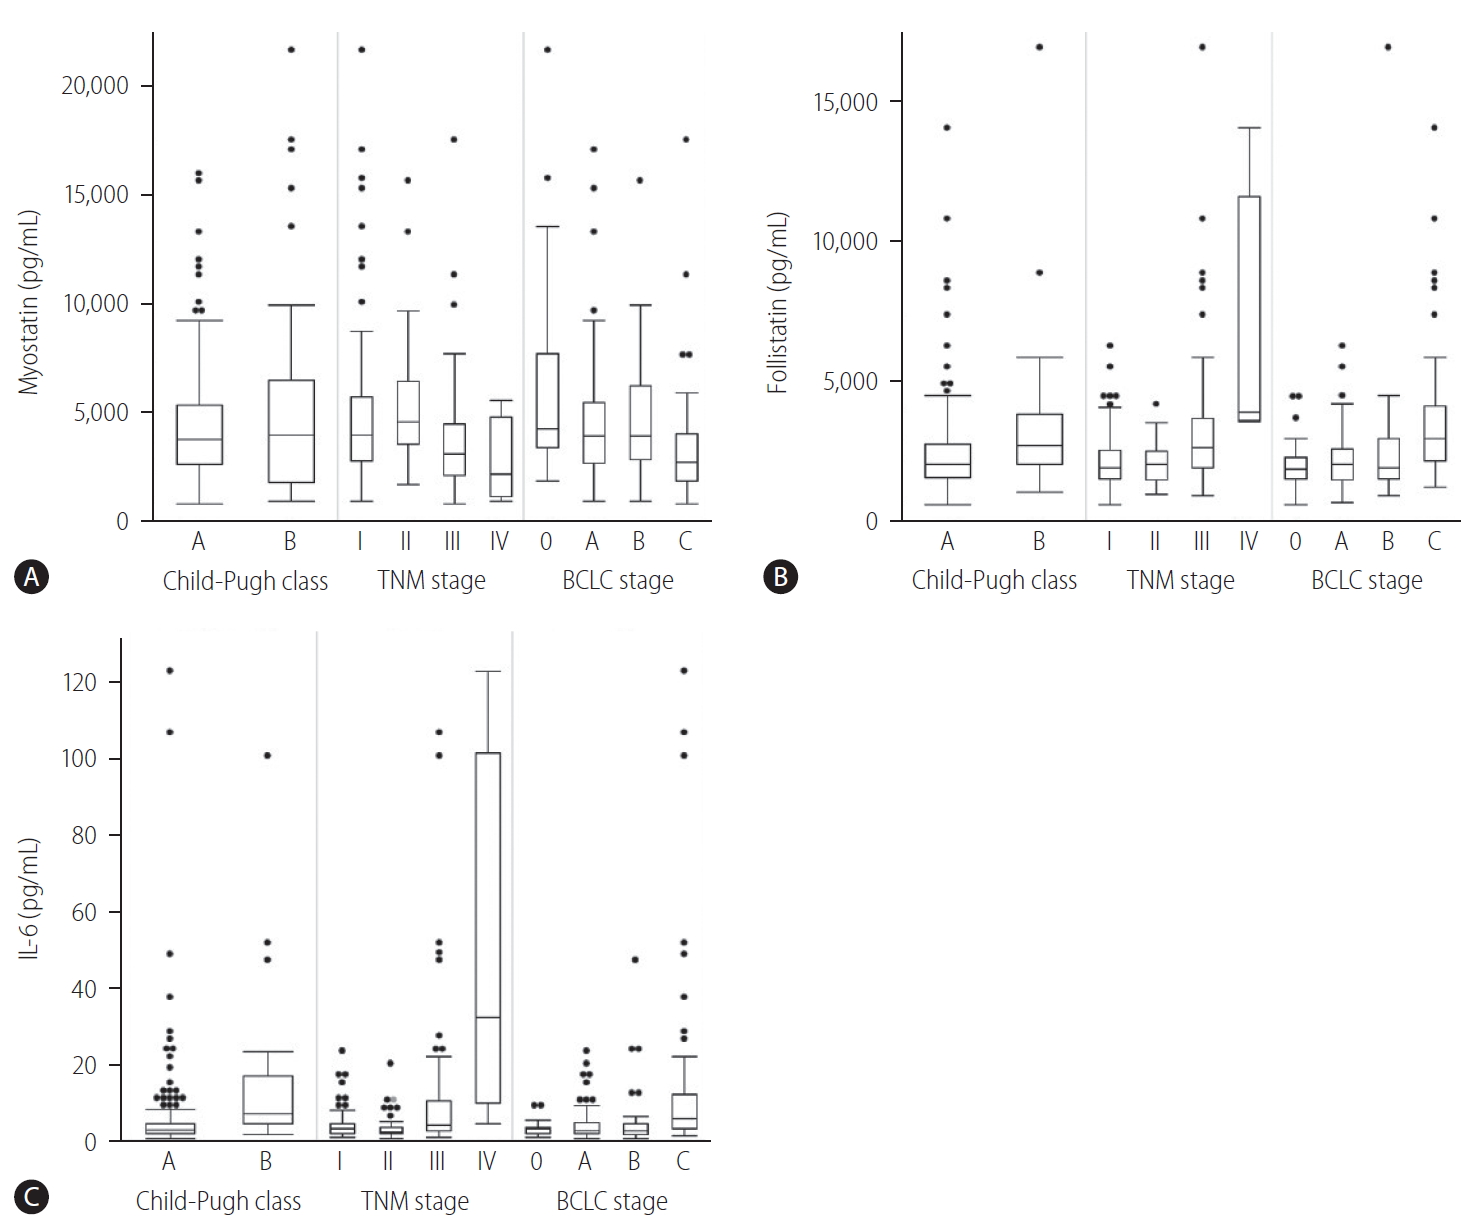
The serum levels of those 3 cytokines according to the liver function in terms of the Child-Pugh class and tumor stage are summarized in Figure 2. Compared to the patients with Child Pugh class A, the patients with Child Pugh class B had a significantly increased level of follistatin (P=0.002), IL-6 (P=0.002), and myostatin (P=0.006).
According to tumor progression by TNM stage or BCLC stage, the serum follistatin and IL-6 levels remarkably increased, especially for TNM stage 4 or BCLC stage C. However, the serum level of myostatin decreased in TNM stage 4 or BCLC stage C, showing that the trend was not clearly defined.
Serum levels of myostatin, follistatin and IL-6 and their relationship with survival in HCC patients
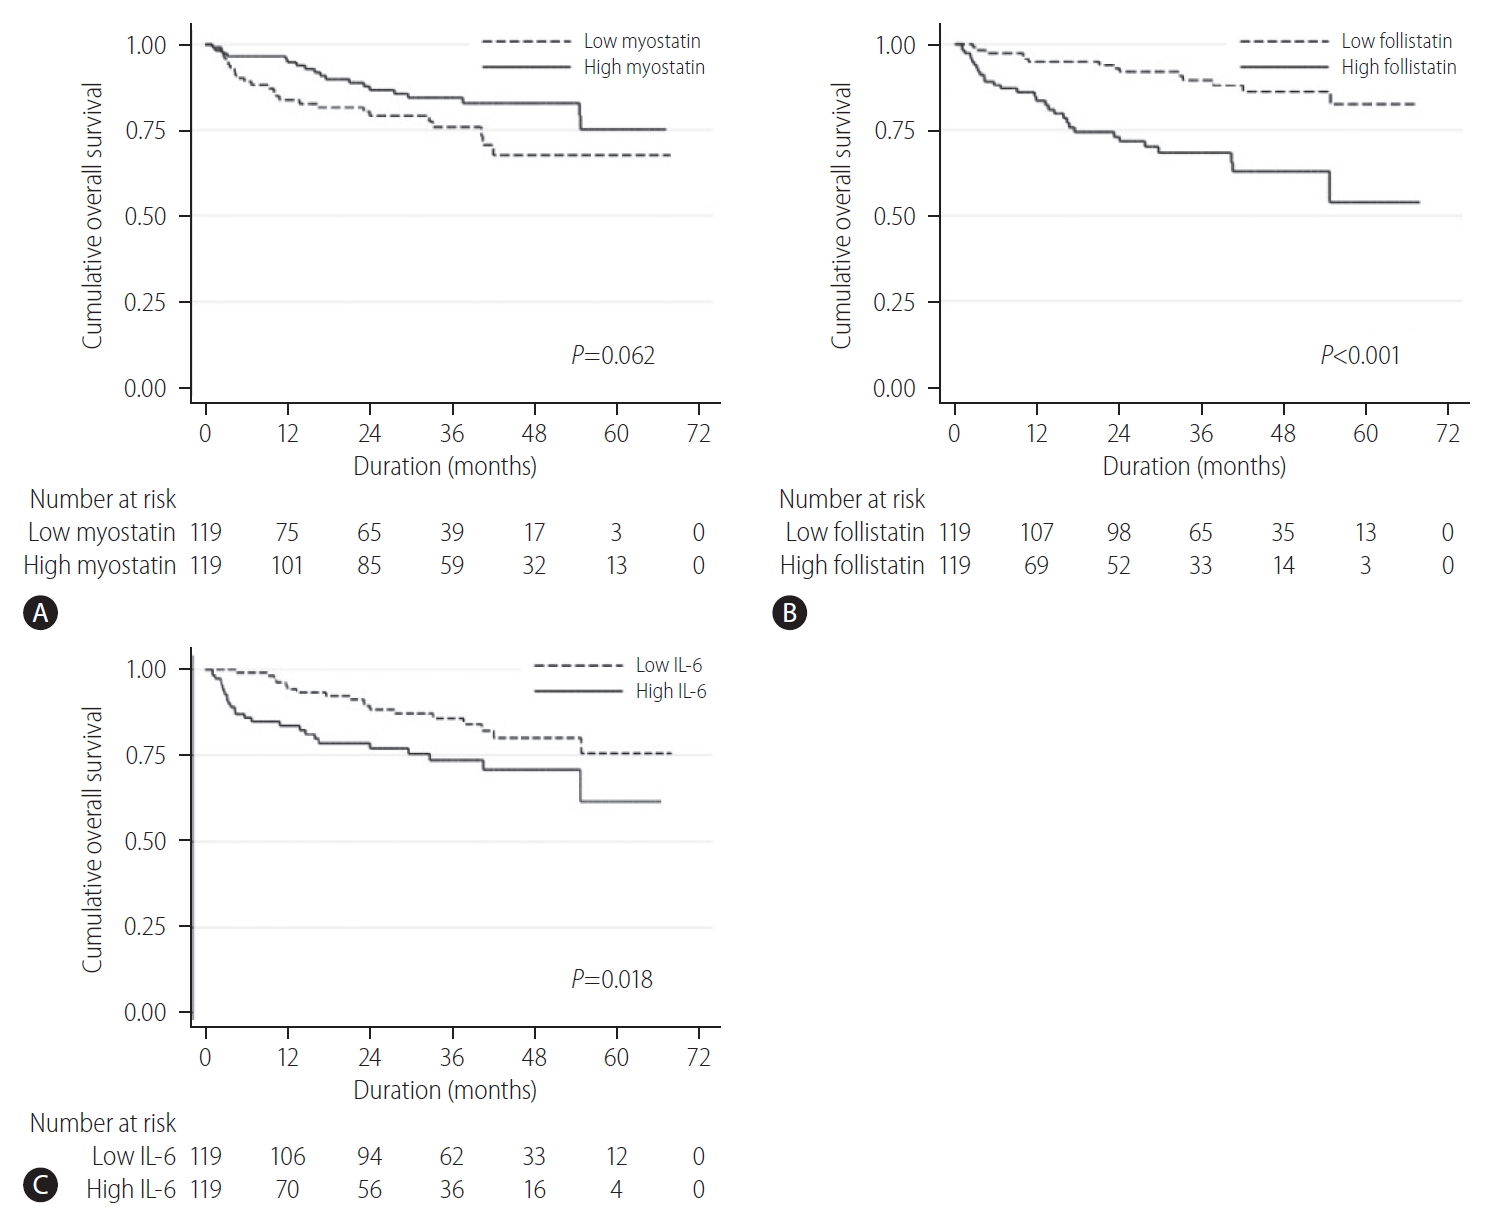
When the HCC patients were divided into two groups (high- and low-level groups) based on the median serum level of myostatin, follistatin, and IL-6, the overall survival curves between the high- or low-level group are summarized in Figure 3. While the overall 5-year survival rate was not different between the high (74.8%) and low myostatin (68.0%) group (P=0.062), the high follistatin group had a significantly lower 5-year overall survival rate (78.4%) than that of the low follistatin group (89.6%, P<0.001). Likewise, the high IL-6 group had a significantly shorter 5-year overall survival rate (78.4%) than that of the low IL-6 group (85.8%, P=0.018).
For the recurrence-free survival, the high follistatin group showed a significantly poor survival than that of the low follistatin group, while the myostatin and IL-6 levels did not show a significant difference (Supplementary Fig. 3).
Univariate and multivariate analyses of the parameters contributing to the overall survival
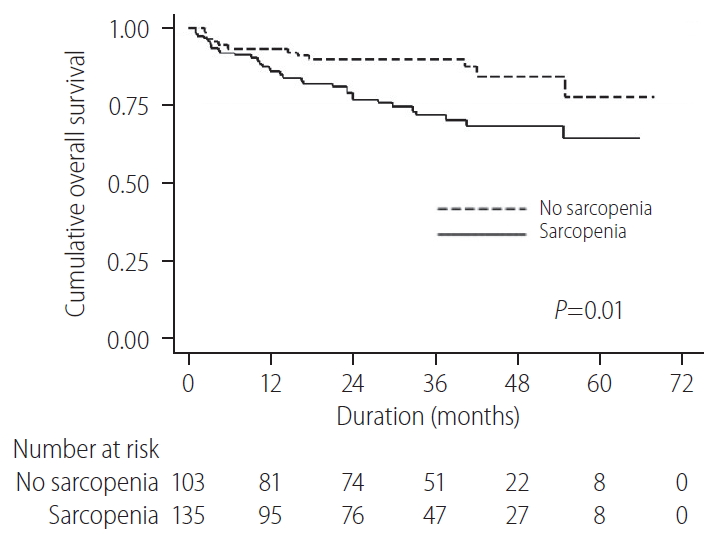
The results of the univariable and multivariable analyses are summarized in Table 4. In the univariable analysis, current alcohol intake (P=0.047), serum AFP (P=0.033), albumin (P=0.002), follistatin (P=0.034), and IL-6 (P=0.021) levels, MELD score (P=0.005), ECOG performance stage (P=0.001), TNM stage (P<0.001), and presence of sarcopenia (P=0.012) were significantly associated with the overall survival. The overall survival between sarcopenic group and non-sarcopenic group is shown in Figure 4.
Multivariable analysis showed that the follistatin level (hazard ratio [HR], 2.21; 95% confidence interval [CI], 1.13 to 4.30; P=0.020) and the presence of sarcopenia (HR, 2.11; 95% CI, 1.07 to 4.17; P=0.031) remained statistically significant along with the MELD score (HR, 2.17; 95% CI, 1.17 to 4.01; P=0.013), and TNM stage (HR, 9.46; 95% CI, 3.33 to 26.9; P<0.001). Therefore, the serum follistatin level was an independent factor associated with the overall survival. However, it was not independently associated with recurrence-free survival (data not shown).
DISCUSSION
This study evaluated the serum levels of myostatin, follistatin and IL-6 among HCC patients, and they all were significantly higher than in the healthy controls. The sarcopenic prevalence in terms of a low PMI using a gender-specific cut-off was 56% in the Korean HCC patients at our center, where HBV is the major cause of HCC. Unexpectedly, the serum myostatin levels increased with increasing muscle mass, while serum IL-6 levels increased with progressive sarcopenia, suggesting that myostatin may not have a role in inducing sarcopenia, while IL-6 did, and myostatin may be downregulated in response to sarcopenia in HCC patients. Both the follistatin and IL-6 levels increased with the tumor stage (TNM and BCLC staging systems), while the serum myostatin level did not. Interestingly, the serum follistatin level was an independent factor for the overall survival of the HCC patients, while the myostatin or IL-6 level was not.
Myostatin is a member of the transforming growth factor beta (TGF-beta) family and the first known cytokine to be a negative regulator of muscles [22-24]. In mice, an increased serum level of myostatin caused muscle atrophy, and a prolonged absence of myostatin reduces sarcopenia. However, a study that included 66 Scottish men showed that the serum myostatin level was not significantly different among young subjects, mildly sarcopenic and severely sarcopenic elderly subjects. Moreover, low serum myostatin levels were associated with a low skeletal muscle mass in healthy community-living older men, but not in women [25].
In Japanese cirrhosis patients (median age of 68 years; 55% males; 62% Child-Pugh class A, 20% HCC patients included), higher serum myostatin levels showed a negative correlation with the PMI and were associated with a reduced overall survival rate [12]. In a rat portacaval anastomosis model that reproduces a similar metabolic change to liver cirrhosis, sarcopenia was associated with portosystemic shunting. In this model, sarcopenia was caused by increased myostatin expression, impaired muscle protein synthesis and satellite cell (myocyte precursor) dysfunction, which was reversed by follistatin [26].
However, in these Korean HCC patients (median age of 59 years; 81% male; 85% Child-Pugh class A), the serum myostatin levels showed a positive correlation with the PMI and were not a significant factor for overall survival. The mechanism of this discrepancy between cirrhosis and HCC is not clear, but the development of HCC may change the regulatory pathway of myostatin secretion. In agreement with our results, the serum myostatin level was decreased in various cancer cachexia showing a positive correlation with muscle mass [27,28]. Cancer is a chronic state of energy malnutrition, which may increase the expression of a splice variant of myostatin leading to decreased bioavailability of myostatin and protection from sarcopenia [29].
Likewise, in Japanese heart-failure patients (n=41), the serum myostatin levels were significantly lower than in the healthy controls and again showed a positive correlation with muscle mass, suggesting that myostatin may have a compensatory action for maintaining skeletal muscle mass [30]. In the murine model of cancer cachexia, myostatin expression was upregulated in the muscle of the animals, and blocking of the shared receptor of myostatin and activin, activin type II receptor B, prevented muscle atrophy and increased survival [31]. However, the regulation of myostatin expression in humans is so complex that further investigation is needed [32].
Follistatin is a multifunctional regulatory protein, mainly secreted from the liver. The primary function of follistatin is the antagonism effect on the TGF-beta superfamily, including myostatin, activin and BMPs [33-35]. It is a strong inhibitor of myostatin-mediated sarcopenia, and follistatin-overexpressing transgenic mice exhibit a significant increase in muscle mass. Therefore, follistatin or follistatin mimetics have been tried in preclinical use for treating muscle injury, atrophy or sarcopenia [36]. Moreover, overexpression of follistatin was found in rodent and human HCC tumors, and experimentally administered follistatin has a role in tumor growth promotion and escaping from the tumor suppressive effect of activin or TGF-beta signaling pathways [37-39]. TGF-beta signaling showed a tumor suppressive effect in the early stages of carcinogenesis, while it later contributes to tumor progression, showing a contextual regulation in HCC [40]. Myeloid-derived suppressor cells can produce TGF-beta and IL-10, which lead to immunosuppressive milieu in HCC tissues and the development of the immune escape of HCC cells [41]. The deregulation of the activin/follistatin system may be important during hepatocarcinogenesis. In this study, the follistatin level increased with the tumor stage, higher AFP levels and tumor size, suggesting an oncogenic role of follistatin overexpression according to the HCC progression. It is supported by several studies showing that follistatin regulates tumor angiogenesis, metastasis, and cell apoptosis [42].
Moreover, the serum follistatin level was an independent factor for poor survival in the HCC patients, which was compatible with the results of Tomoda et al. [42] who reported that the serum follistatin level in HCC patients was independently correlated with a poor prognosis. Meanwhile, follistatin serves as a stress responsive protein, having a protective role under oxidative stress, physical stress, and cellular energy deficiency such as prolonged fasting, acute exercise, or solid cancers. Solid cancers including HCC are exposed to glucose deficiency and a hypoxic microenvironment, which results in a compensatory high expression of follistatin, which may be related to our findings. The overwhelming excretion of follistatin may exert a suppression of myostatin, leading to a protective effect on sarcopenia in the HCC patients.
IL-6 mediated signal transducer and activator of transcription 3 activation promote hepatocarcinogenesis, and IL-6 is a determinant of gender disparity for HCC development because estrogen inhibits the release of IL-6 from Kupffer cells, showing a reduced risk of HCC development in women compared to men [43]. The cellular sources of IL-6 in HCC are the tumor-associated macrophages and HCC cells. IL-6 is a marker of inflammation with catabolic effects on muscle proteins, and contributes to the progression of sarcopenia [44,45]. According to a recent meta-analysis, the serum levels for IL-6 correlates negatively with muscle strength in healthy elderly populations [46]. Moreover, many studies have consistently reported that IL-6 has an important effect on the development of sarcopenia and cachexia and promoting tumor growth and metastasis in cancer patients including HCC. In this study, the serum levels of IL-6 showed a significant negative correlation with the PMI and a progressive increase with increasing cancer stage. Therefore, IL-6 may have a major role in the sarcopenia of HCC patients. Whether therapeutic trials aimed at the reduction of the IL-6 activity, such as endurance exercise or anti-IL-6 antibodies, may be beneficial for cancer associated sarcopenia in humans need to be studied further [47]. In the aspect of HCC as the ultimate outcome of liver fibrosis, IL-6 has a profibrogenic role, and myostatin seems to be fibrogenic [48], while follistatin may attenuate fibrosis [37], which warrants further studies.
There are some limitations in this study. First, it was a single center study with the measurement of only 3 myokines at one single time of the HCC diagnosis. The serum ammonia level was closely linked to the development of sarcopenia, however, the serum ammonia level was not measured in this study. Second, only the amount of muscle but not the function or quality of the muscle was evaluated. It would be interesting to explore the association between muscle strength and the 3 myokines. Third, we determined the optimal cut-offs for defining prognostic sarcopenia from our own cohort; thus, the cut-off may overestimate the prognostic separation. It would be necessary to validate the cut-off values in an independent cohort. Lastly, total skeletal muscle index was not measured, which remains a possible underestimation of mortality risk by using PMI, as shown in cirrhosis patients [49]. Sarcopenia is already a well-known factor for poor survival in HCC; therefore, our study mainly focused on the simultaneous measurement of the 3 myokines and the PMI in HCC patients for the first time to the best of our knowledge. Moreover, by comparison of those 3 myokines to the age and sex-matched healthy controls, the higher levels of the 3 myokines in HCC patients were clearly demonstrated.
In conclusion, the serum levels of myostatin, follistatin, and IL-6 in association with the PMI in HCC patients were presented. The serum myostatin level was negatively, and the IL-6 level was positively correlated with sarcopenia, while the serum follistatin level showed no correlation. The serum follistatin level was an independent factor for poor survival in HCC patients, which warrants further study.
 PDF Links
 PubReader
 ePub Link
 Full text via DOI
 Full text via PMC
 Download Citation
 Supplement1
 Print
Print