


Graphical Abstract
INTRODUCTION
Chronic liver diseases (CLDs) represent a global health problem and account for approximately 2 million deaths per year worldwide [1]. Liver fibrosis is the result of liver injury from various CLDs and is the common pathway towards cirrhosis and its complications. The level of fibrosis inversely correlates with liver function and the quality of life [2].
Cirrhosis is the terminal stage of progressive liver fibrosis, and is associated with increased risk of hepatocellular carcinoma (HCC) and complications of portal hypertension [3]. Cirrhosis is classified as compensated or decompensated disease based on the absence or presence of portal hypertension-related complications (ascites, spontaneous bacterial peritonitis, variceal bleeding), hepatic encephalopathy, and/or hepatorenal syndrome [4]. Most morbidity and mortality in patients with liver cirrhosis can be attributed to the transition to the decompensated state. Patients with compensated cirrhosis are expected to survive more than 10 years, compared with a median survival of 2 years in patients with hepatic decompensation [5,6]. Therefore, it is important to identify CLD patients at high risk of developing cirrhosis and decompensation.
Urea is a non-toxic, nitrogenous organic end product of protein metabolism, facilitating 80ŌĆō90% of nitrogen elimination from human body [7]. Increased blood urea level indicates impaired renal function, and decreased urea level can be due to poor liver function and protein-energy malnutrition [8]. Serum creatinine, another marker of renal function, is a component of the Model for Endstage Liver Disease score, which is used for prognostication and liver transplant prioritization in patients with various liver conditions [4]. Accordingly, high urea level also correlates with poor liver outcomes. Recently, several experimental studies revealed that urea synthesis is impaired even in early CLD and this correlates with hepatic fibrosis [9-11]. Additionally, urea cycle dysregulation contributes to carcinogenesis [12]. Therefore, CLD patients with low urea level may have more advanced disease and be at risk of disease progression.
With this background, we hypothesize that there is a U-shaped relationship between blood urea level and the severity of liver disease, with both low and high urea level indicative of at-risk patients. To test this hypothesis, we studied three cohorts and demonstrated consistent results in the association with liver stiffness measurement (LSM) and various liver-related events (LREs).
MATERIALS AND METHODS
Study populations
LSM cohort
This was a post-hoc analysis of the LSM cohort study [13]. Between August 2012 and March 2016 at the Prince of Wales Hospital, patients who underwent transient elastography (TE) examination for suspected or known CLDs were included in this study. Patients who had history of cancer, hepatic decompensation, unreliable LSM (defined below), or with missing data of blood urea level were excluded. In addition, patients with LSM >15 kPa (suspected of cirrhosis) or clinical diagnosis of cirrhosis before baseline were further excluded for the analysis of the association between urea level and incident cirrhosis.
Magnetic resonance spectroscopy (MRS) cohort
The association between urea level and LSM was validated in an independent cohort (MRS cohort). The MRS cohort was a population screening study including 917 subjects randomly recruited from the census database of the Hong Kong Government (May 2008 to September 2010) [14]. All the subjects underwent TE and proton-magnetic resonance spectroscopy and did not have cancer or hepatic decompensation at the time of assessment.
Nonalcoholic fatty liver disease (NAFLD) cohort
The association between urea level and hepatic decompensation/incident cirrhosis/HCC was validated in another independent cohort (NAFLD cohort) using data from the Clinical Data Analysis and Reporting System (CDARS) of the Hospital Authority, Hong Kong. CDARS facilitates the retrieval of clinical data captured from different operational systems for analysis and reporting and provides good quality information to support retrospective clinical and management decisions by integrating the clinical data residing in data warehouse. It covers the electronic health records and laboratory results from all public hospitals and clinics in Hong Kong and represents data of approximately 80% of the local population. The NAFLD cohort included 12,476 patients with a diagnosis code of NAFLD (International Classification of Diseases, ninth revision, clinical modification [ICD-9-CM] code 571.8) between January 2000 and June 2020. Patients who had cancer or hepatic decompensation before baseline were excluded.
The study protocol was approved by the Joint Chinese University of Hong Kong-New Territories East Cluster Clinical Research Ethics Committee. All subjects in the MRS cohort provided informed written consent, whereas the Ethics Committee exempted the need for consenting for the LSM and NAFLD cohorts because of their retrospective nature.
Clinical data
The baseline date was defined as the date when TE was performed (LSM and MRS cohorts) or the date when NAFLD was first coded (NAFLD cohort). Data collected at baseline included the complete blood count, prothrombin time and international normalized ratio, liver and renal biochemistries, fasting lipids, glucose, and glycated hemoglobin. Use of lipid lowering medications, antiviral medications, and anti-platelet agents were also recorded. All diagnoses and events were extracted from the CDARS based on ICD-9-CM codes, which were subsequently confirmed manually by two independent investigators using patient medical records (Supplementary Table 1).
Chronic hepatitis B or C were diagnosed by positive serology tests for serum hepatitis B surface antigen or anti-hepatitis C virus antibodies, respectively. In LSM and MRS cohorts, NAFLD was diagnosed by the presence of hepatic steatosis seen on ultrasonography and/or histology or as evidenced by an elevated controlled attenuation parameter (CAP) Ōēź248 dB/m after exclusion of alternative liver diseases and secondary causes of fatty liver. Autoimmune and cholestatic liver diseases (primary biliary cholangitis and primary sclerosing cholangitis) were diagnosed based on standard serological, cholangiographic, and histologic criteria.
The primary outcome was new onset hepatic decompensation. Secondary outcomes include incident cirrhosis, and HCC. Hepatic decompensation was defined as new-onset ascites, spontaneous bacterial peritonitis, variceal bleeding, hepatic encephalopathy, and/or hepatorenal syndrome. Liver cirrhosis, which included compensated and decompensated cirrhosis, was identified by the ICD-9-CM diagnosis codes for cirrhosis and its related complications. The diagnosis of HCC was established based on liver tumor features seen on dynamic imaging techniques, tumor histology, and/or high alpha-fetoprotein level (above 400 ng/mL) in LSM and MRS cohorts, and by the ICD-9-CM diagnosis codes in NAFLD cohort. Only the first occurrence of these events was studied. Patients who did not develop study endpoints due to death or loss to follow-up were censored at the date of their last recorded blood test or clinical encounter.
TE
LSM and CAP measurements were performed by experienced operators using the FibroScan502 Touch machine (Echosens, Paris, France) as described previously. All patients were fasted for at least 2 hours before the procedure. The final LSM (in kPa) and CAP values (in dB/m) were represented by the median of Ōēź10 measurements. LSM was considered reliable only if at least 10 successful acquisitions were obtained and the interquartile range (IQR)-to-median ratio of the 10 acquisitions was Ōēż0.3 for LSM values of Ōēź7.1 kPa [15].
Statistical analysis
Statistical analysis was performed by Statistical Package for Social Science (SPSS version 25.0; IBM, Armonk, NY, USA) and R version 4.0.5; RStudio, Boston, MA, USA). Continuous variables were expressed in mean┬▒standard deviation or median (IQR) as appropriate. Differences between subgroups were analyzed using chi-squared test or FisherŌĆÖs exact test for categorical parameters and one-way analysis of variance and Kruskal Wallis test for continuous parameters as appropriate.
Non-linear association
The non-linear relationship between urea level and LSM was evaluated on a spline curve based on generalized additive model in the LSM cohort. The associations between urea level and hepatic decompensations/incident cirrhosis/HCC were evaluated on a continuous scale with restricted cubic spline based on Cox proportional hazards models with four knots at the 5th, 35th, 65th and 95th percentiles [16].
Stratification of LSM cohort by urea level
Rather than dichotomizing our population at a single cutoff of urea level, it would be more clinically relevant to define abnormally low or high urea levels because both conditions may be associated with increased risk of LREs [17]. We first divided the LSM cohort into the derivation and validation cohorts with the ratio of 1:1 by the simple randomization method. In the derivation cohort, we identified a dividing point with the smallest hazard ratio (HR) for hepatic decompensation. In other words, the risk of hepatic decompensation began to increase in patients with a urea level below or above that dividing point. We then selected two cutoffs among patients below or above the dividing point. The optimal cutoffs for urea to predict hepatic decompensation were determined by the ŌĆśsurvminerŌĆÖ package from R by the minimum P-value-based approach in the derivation cohort. Then, the cutoffs were validated by bootstrap with 5,000 replications in the validation cohort [18]. Subsequently, patients in the LSM cohort were divided into three groups by the cutoffs, i.e., the low, moderate, and high urea level groups.
Survival analysis
We conducted univariate analyses to determine clinical parameters associated with the study endpoints (hepatic decompensation/incident cirrhosis/HCC). To test the predictive value of urea level based on the derived cutoffs, we categorized urea into low, moderate, or high in these models. The multivariable Cox regression model using a backward stepwise approach was performed among covariates that were associated with study endpoints on univariate analysis (P<0.05) to determine independent factors. Adjusted HR and 95% confidence interval (CI) of the risk factors were computed. The Kaplan-Meier method was used to estimate the cumulative probability of study endpoints. All statistical tests were two-sided. Statistical significance was taken as P<0.05.
The non-linear association between urea level and LSM was validated in the MRS cohort, and the associations between different levels of urea and hepatic decompensation/incident cirrhosis/HCC were validated in the NAFLD cohort.
RESULTS
The LSM cohort
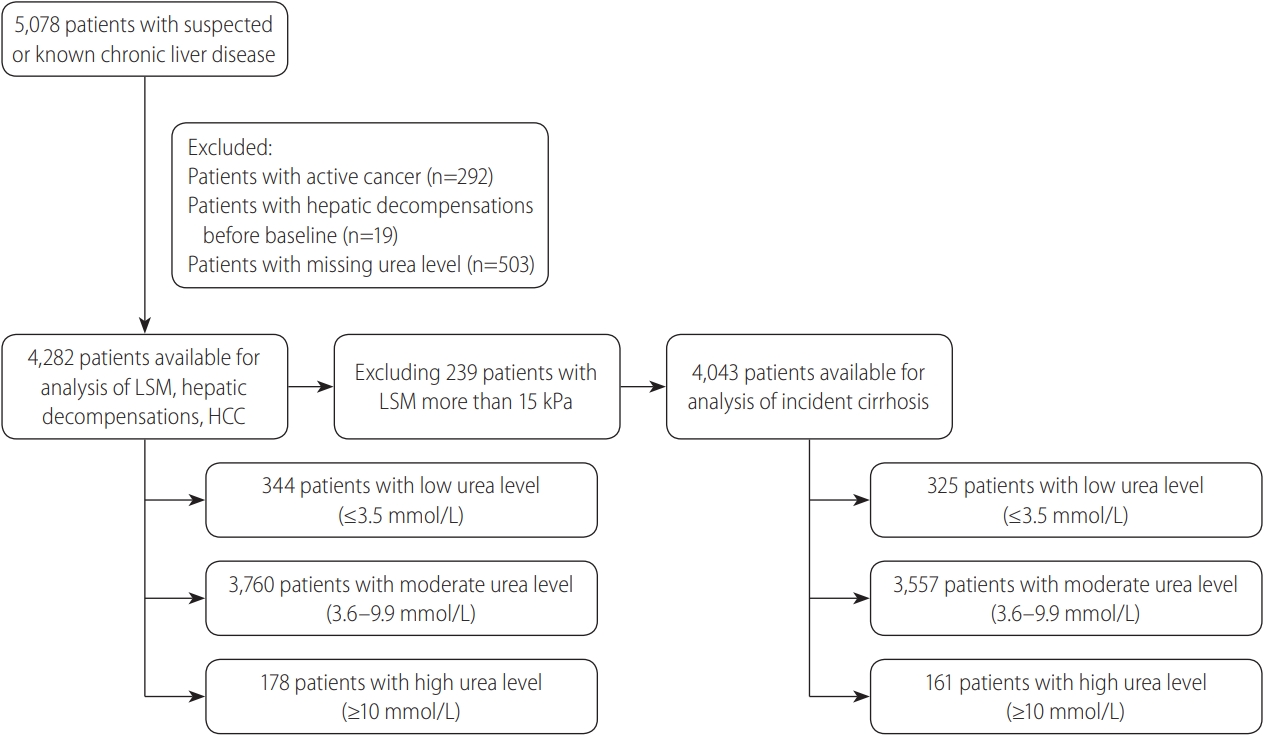
During the study period, a total of 5,078 patients with known or suspected CLD underwent TE (Fig. 1). We excluded 292 patients with cancer (5.8%), 503 (9.9%) with missing urea value, and 19 (0.3%) who had hepatic decompensation before baseline. A further 239 patients (4.7%) were excluded from the analysis for incident cirrhosis, because they had LSM >15 kPa at baseline. In the final cohort of 4,282 subjects (Table 1), 55.3% were males and the mean age was 55.6 years.
The median follow-up was 5.5 years (IQR, 3.0ŌĆō6.4). During the follow-up period, 46 patients (1.0%) developed hepatic decompensation, with ascites being the most common initial decompensating event. Twenty-nine patients developed new-onset ascites, including 20 in the moderate urea level group, four in the low urea level group, and five in the high urea level group. Cirrhosis was the main contributor of ascites in those patients. One hundred patients (2.3%) developed HCC. Supplementary Table 2 lists the number of patients with different LREs.
U-shaped relationship of urea with LSM and LREs
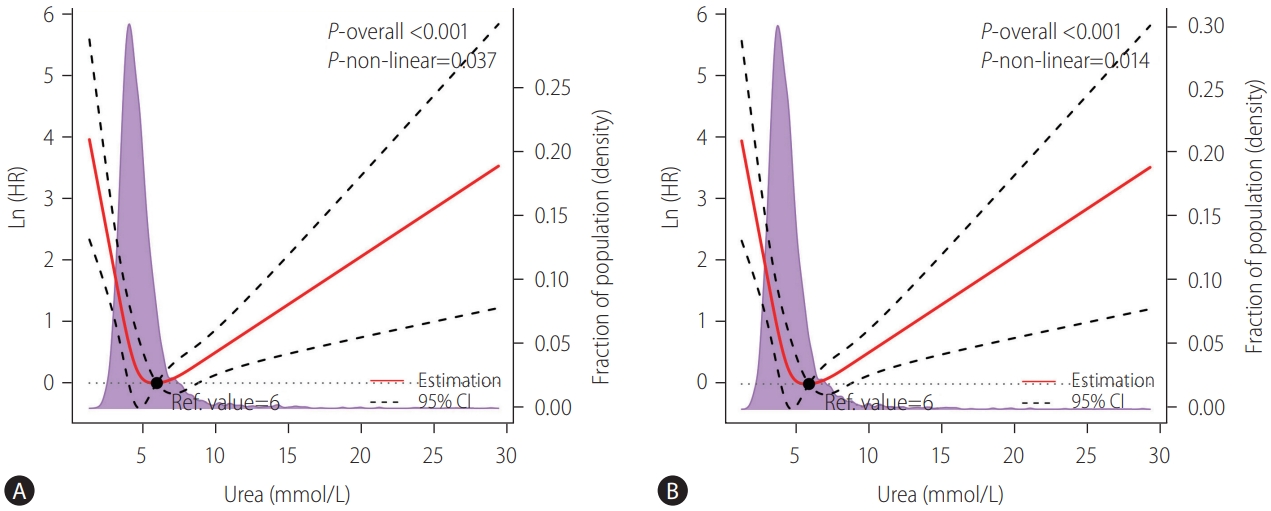
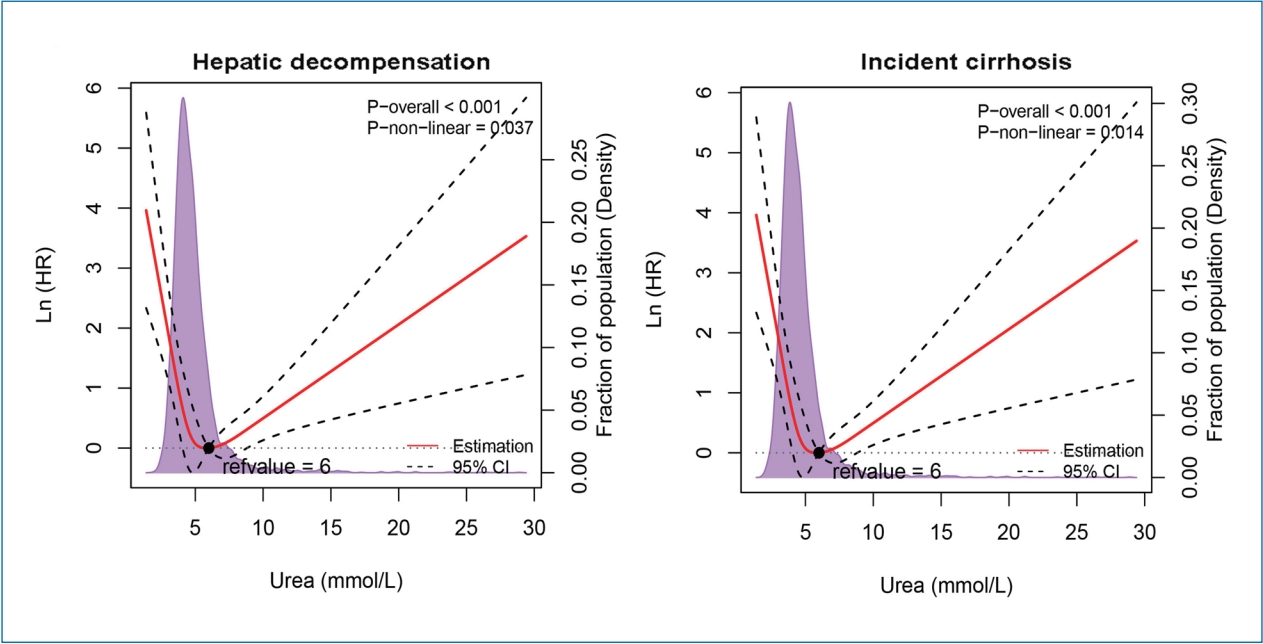
A U-shaped association between LSM and urea level was identified in the LSM cohort (Supplementary Fig. 1A). As shown in the Figure 2, urea showed strong U-shaped associations with decompensation and incident cirrhosis after adjustment with confounding variables. For both outcomes, the risk was the lowest when the urea level was around 6 mmol/L and then increased in both directions (P for non-linearity <0.05). There was no significant non-linear association between urea level and HCC (data not shown).
Additionally, we performed the analysis to study for the association between creatinine level/urea-to-creatinine ratio (UCR) and hepatic decompensation. As showed in the Supplementary Figure 2, there was no significant non-linear association between creatinine level and hepatic decompensation. There was a U-shaped association between the UCR and risk of decompensation, however, the non-linear association between UCR and risk decompensation was mainly contributed by the urea level.
Cutoffs of urea level to predict hepatic decompensation
Next, we determined the best cutoffs of urea to identify patients at risk of hepatic decompensation. As indicated in the previous section, a urea level of 6 mmol/L was the dividing point with the risk of incident cirrhosis and hepatic decompensation starting to increase in both directions. We divided the LSM cohort into the derivation and validation cohorts (Supplementary Table 3). Based on the minimum P-value-based approach and bootstrap validation with 5,000 replications, the urea cutoffs of 3.5 mmol/L (63 mg/dL) and 10 mmol/L (180 mg/dL) were selected as optimal to predict hepatic decompensation, and the patients were divided into low (Ōēż3.5 mmol/L), moderate (3.6ŌĆō9.9 mmol/L), and high (Ōēź10 mmol/L) urea groups (Supplementary Fig. 3).
At the derived cutoffs, 344 (8.0%), 3,760 (87.8%), and 178 patients (4.2%) were in the low, moderate, and high urea level groups respectively. The median urea level in the LSM cohort was 5.1 mmol/L (IQR, 4.3ŌĆō6.2), and 3.2 mmol/L (IQR, 2.9ŌĆō3.4), 5.2 mmol/L (IQR, 4.4-6.2), 12.9 mmol/L (IQR, 10.9ŌĆō16.9) in the low, moderated, and high urea level groups, respectively. Patients in the low urea group were younger and had fewer comorbidities compared with the moderate and high urea groups (Table 1).
Factors associated with LREs in the LSM cohort
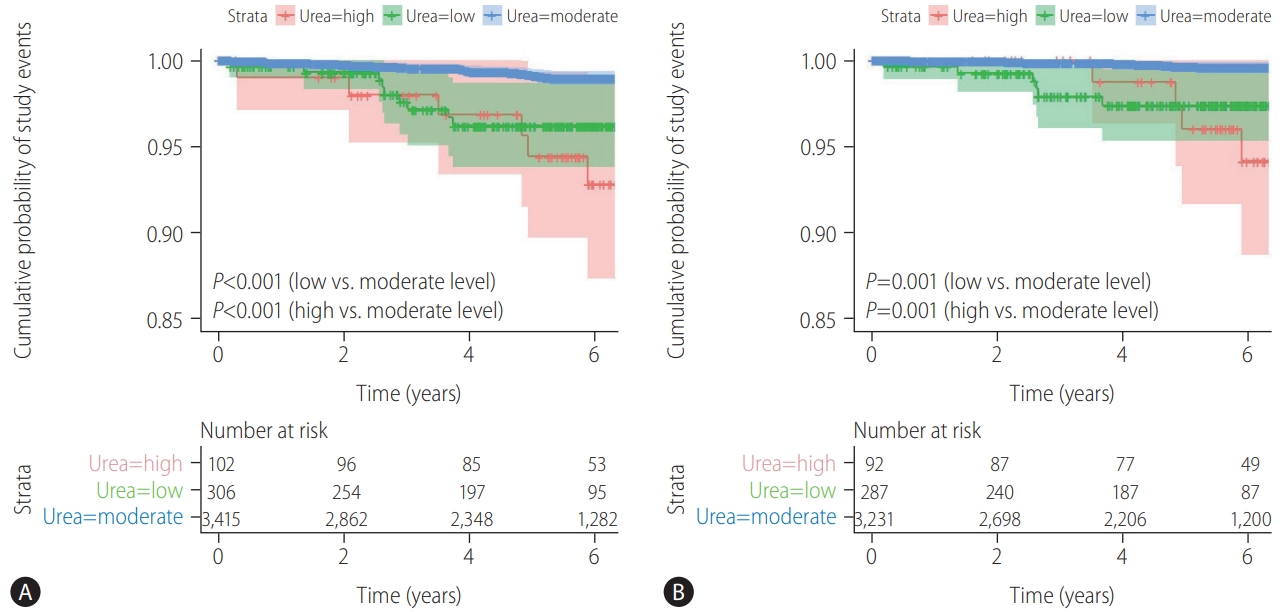
Compared with the moderate urea group, both low and high urea levels predicted a significantly higher risk of hepatic decompensation (Fig. 3A, log-rank P<0.001). Significant variables associated with hepatic decompensation on univariate analysis were low or high urea levels, older age, diagnosis of viral hepatitis or NAFLD, hypercholesterolemia, elevated alanine aminotransferase, elevated bilirubin, low serum albumin, low platelet count, and increased LSM (Table 2). On multivariate analysis, urea level remained one of independent predictors of hepatic decompensation. Patients with low urea level (HR, 4.15; 95% CI, 1.68ŌĆō10.24) had a comparable risk of decompensation as those with high urea level (HR, 5.22; 95% CI, 1.86ŌĆō14.67) when using the moderate urea level as the reference. Other independent predictors of hepatic decompensation were elevated alanine aminotransferase, low serum albumin, low platelet count, and increased LSM.
High and low urea levels were also associated with incident cirrhosis (Fig. 3B). After adjusting for potential confounding variables, low urea level was still significantly associated with incident cirrhosis (HR, 3.24; 95% CI, 1.50ŌĆō6.98), but not high urea level (HR, 1.45; 95% CI, 0.49ŌĆō4.29). As shown in the Supplementary Figure 4 and Supplementary Table 4, there was no significant association between the urea level and HCC.
Subgroup analysis
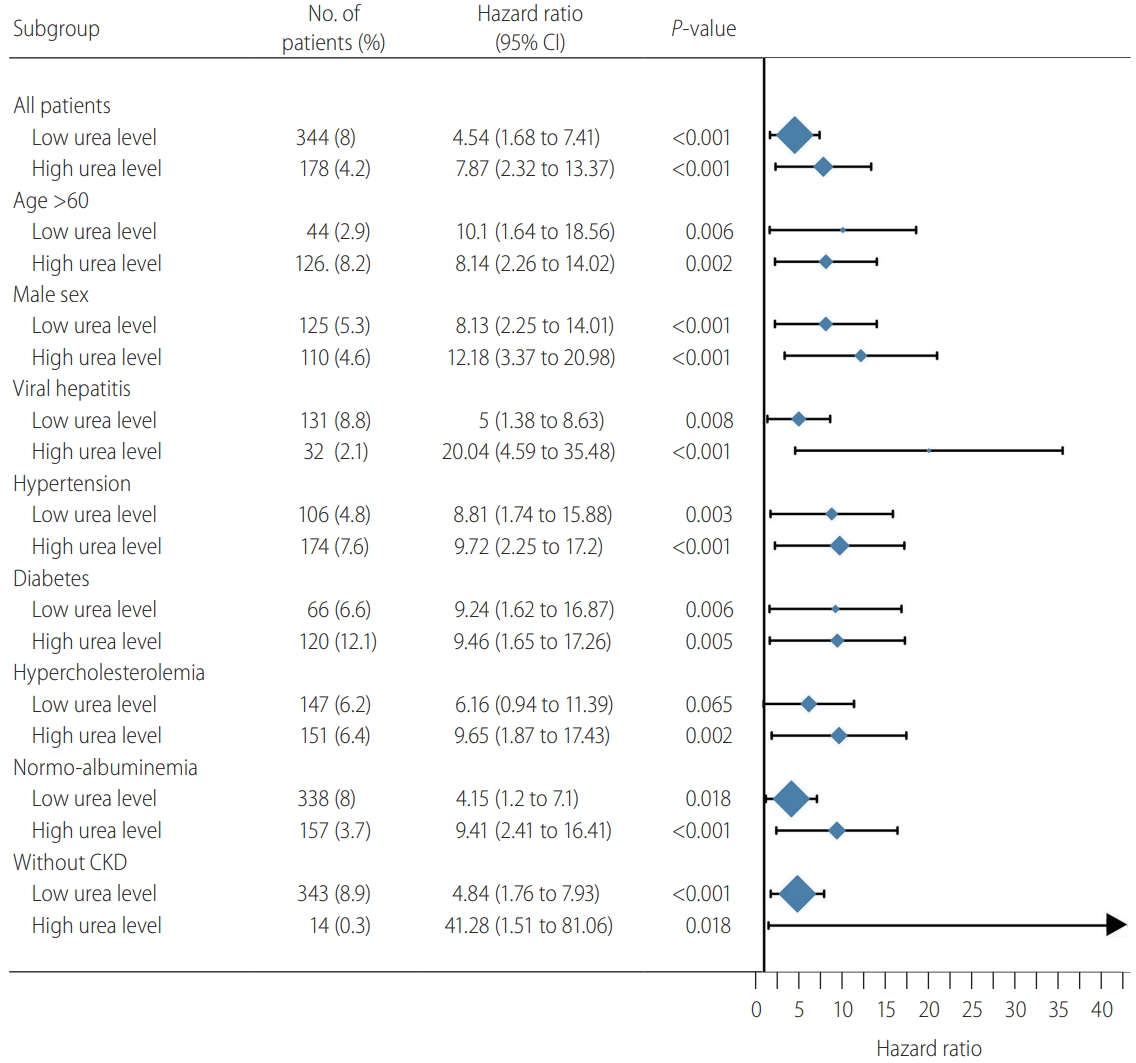
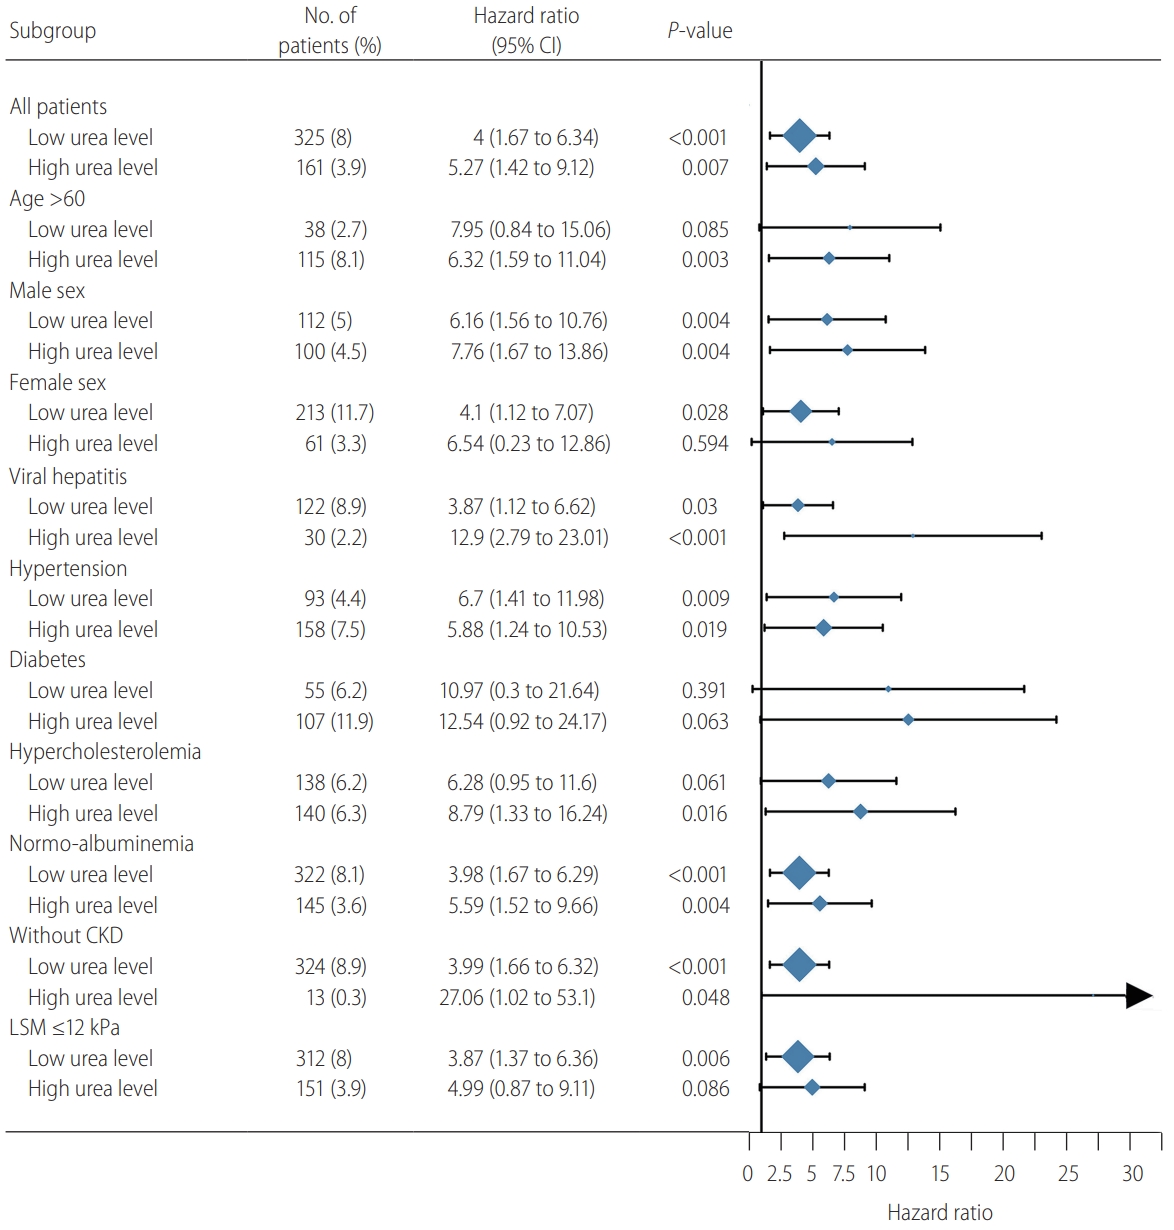
As shown in the Figure 4, both low and high urea levels were associated with significantly higher risk of hepatic decompensation compared with the moderate urea group in almost all subgroups. In patients with hypercholesterolemia, the HR for hepatic decompensation in patients with low urea level was of similar magnitude as the other subgroups, but fell short of statistical significance.
Likewise, both low and high urea levels were associated with incident cirrhosis in most subgroups, with the exception of a few subgroups with small patient numbers (Fig. 5). Using a more conservative LSM cutoff of Ōēź12 kPa to exclude patients with pre-existing cirrhosis, a low urea level at baseline remained significantly associated with incident cirrhosis.
Validation in the MRS and NAFLD cohorts
The MRS cohort was collected from the general population, and those subjects had very low risk of hepatic decompensation (Supplementary Table 5). Therefore, we used this cohort to demonstrate a U-shaped association between urea level and LSM (Supplementary Fig. 1B).
The baseline characteristics of the NAFLD cohort are shown in Supplementary Table 6. One thousand eight hundred thirty-eight (14.7%), 10,091 (80.9%), and 547 patients (4.4%) were in the low, moderate, and high urea level groups, respectively. The median follow-up was 9.9 years (IQR, 8.2ŌĆō12.1). Compared with the moderate urea group, high urea level at baseline was associated with increased incidence of hepatic decompensation and incident cirrhosis (Supplementary Fig. 5, log-rank P<0.001). Low urea level also increased the risk of hepatic decompensation and incident cirrhosis (Table 3). By multivariate analysis, high urea level remained as an independent factor associated with hepatic decompensation (adjusted HR, 3.71), but low urea level was no longer significant after adjustment. In contrast, both high and low urea levels were independent factors for incident cirrhosis. Similar to what was observed in the LSM cohort, low urea level was not associated with HCC in the NAFLD cohort (Supplementary Fig. 6, Supplementary Table 7).
DISCUSSION
To our knowledge, this is the first study to describe a U-shaped relationship between urea level and the severity and outcome of CLD. We showed that patients with urea level of 3.5ŌĆō10 mmol/L had the lowest risk of advanced liver disease and hepatic decompensation, while the risk was increased when urea was below or above this range. This is close to the normal range of urea used in different laboratories. Importantly, while clinicians focused on the use of high urea level to identify patients with renal dysfunction previously, we provided clinical meaning to low urea level.
Abnormal urea levels are usually caused by abnormal production or excretion of urea. Ureagenesis, which covers the final and irreversible transformation of amino nitrogen to urea nitrogen, is an essential function of the liver involved in whole body nitrogen homeostasis [19]. The capacity for urea synthesis is decreased in patients with CLD due to several etiologies. Glavind and colleagues [20] showed that patients with alcoholic hepatitis had marked reduction in urea synthesis compared with healthy controls using functional hepatic nitrogen clearance (FHNC). Reduced FHNC was also observed in patients with viral hepatitis and NAFLD [9,21]. The expression of enzymes involved in the urea cycle is also reduced in pre-cirrhotic CLD [10]. Furthermore, reduced ureagenesis is associated with the accumulation of ammonia, which in turn activates hepatic stellate cells and promotes fibrosis progression [11]. Nonetheless, previous studies lacked clinical outcome data, and it is impractical to apply FHNC and enzyme expression assays in routine clinical settings. Therefore, the present study offers a simple, yet important message on the use of low urea level to identify and predict advanced liver disease.
Unlike a mechanistic study, it is difficult to determine if low urea was the cause or result of advanced liver disease, though previous studies, as discussed above, suggest it might be both. In very advanced liver disease, low albumin levels reduce ureagenesis by the downregulation of protein metabolism [22]. However, we excluded patients with pre-existing hepatic decompensation in all three cohorts, and the association between low urea level and clinical outcomes remained robust after adjustment for the albumin level.
In terms of potential clinical application, identification of these patients with low urea may prompt consideration for earlier intervention. In viral hepatitis patients, low urea level may herald the need to commence antiviral therapy if not already done so. Indeed, in our current study, patients with moderate urea levels had the highest rates of antiviral therapy (Table 1). Furthermore, Laursen et al. [23] showed early normalization of reduced urea synthesis capacity after commencing antiviral therapy. This is not to say clinicians should initiate antiviral therapy based on the urea level. We should follow the treatment guidelines instead. A low urea level may be a marker of advanced liver disease and prompt clinicians to perform further tests to assess the disease severity and guide treatment. In patients with alcohol-related liver disease and NAFLD, those with low urea levels could be prioritized for referral to more intensive alcohol cessation counselling or NAFLD clinical trials, respectively. As discussed above, patients with low urea levels should be assessed for malnutrition and sarcopenia, and commenced on aggressive nutritional supplementation if present. Clearly these hypotheses require future study to evaluate if urea levels can be improved with the above interventions and if they correspond with improvements in patient prognosis.
With regard to patients with high urea levels, it is well known that urea is primarily excreted in the urine and renal dysfunction results in its accumulation in blood. Renal dysfunction is common in patients with acute and CLDs [24]. In the present study, more than 90% of patients with high urea level had chronic kidney disease (CKD), and CKD was a risk factor for hepatic decompensation. However, high urea level continued to be associated with hepatic decompensation after we excluded patients with CKD. Previous studies demonstrated that stressful situations like pain, recent surgery, uncontrolled diabetes, and inflammation located outside of the liver can also lead to upregulated ureagenesis [20].
Our study has several limitations. First, although the LSM and MRS cohorts were prospectively recruited, the NAFLD cohort was retrospective in nature and was based on a real-world registry. However, the latter provided a huge sample size with a long follow-up duration. Second, although we validated the findings in multiple independent cohorts, our study only included ethnic Chinese, and therefore our findings may not be generalizable to other populations. Third, we assessed our patients using TE, which is a good but imperfect noninvasive test for liver fibrosis. However, it would be impractical and unethical to conduct liver biopsy on all subjects, particularly those in the general population. Fourth, the studied population was heterogeneous and the number of primary outcomes was small. To demonstrate consistent results, we have performed various subgroup analysis and adjusted for important confounding factors. Finally, treatments of CLD might alter the natural history and in turn affect the urea level. However, the present studies included CLD patients of different etiologies, and it would be difficult to adjust for the varying types and efficacies of treatments.
In conclusion, we identified a U-shaped relationship between the urea level and liver fibrosis/incident cirrhosis/hepatic decompensation in patients with CLD. Clinicians should recognize low urea level as a potential marker and predictor of advanced liver disease.
 PDF Links
 PubReader
 ePub Link
 Full text via DOI
 Full text via PMC
 Download Citation
 Supplement1
 Print
Print