


INTRODUCTION
Over the last decade, chronic liver disease (CLD) has become a major cause of morbidity and mortality worldwide, accounting for 2 million deaths globally [1]. The most common etiologies of CLD are nonalcoholic fatty liver disease (NAFLD), followed by hepatitis B virus (HBV), hepatitis C virus (HCV), and alcoholic liver disease [2]. Since cirrhosis and hepatocellular carcinoma (HCC) as major complications of CLD contribute to liver-related morbidity and mortality, effective management of patients with CLD is crucial to reduce the forthcoming disease burden and health expenditures [3].
Although the prevalence of NAFLD is increasing globally and emerging as a major cause of advanced liver diseases, effective and evidence-based pharmacotherapy is still lacking [4]. In viral hepatitis, potent antiviral therapy using nucleot(s)ide analogues and direct-acting antivirals (DAAs) is the mainstay treatment; however, only selected patients are candidates for antiviral therapy, and the supply of antiviral drugs is often limited in under-developed countries [5,6]. In addition, research has shown the combined fatty load in patients with viral hepatitis to have an unfavorable influence on long-term outcomes [7]. Therefore, varying drugs, including antidiabetics, antioxidants, lipid-lowering drugs, probiotics, and anti-platelets, which might have potential beneficial effects, have been continuously investigated in patients with CLD [8-15]. In in vitro studies, diverse therapeutic mechanisms of these drugs, including hepatoprotective, antioxidative, anti-inflammatory, and anti-lipogenic properties, have been suggested [16-27].
Indeed, several clinical studies have determined that these drugs induce histological and biochemical improvements and thus improve long-term outcomes in patients with CLD [8-15]. In addition, several drugs have been found to affect metabolic parameters, including the anthropometric index, insulin resistance, and lipid profiles [28-30]. In contrast, other studies have suggested that these drugs have no beneficial therapeutic effect in patients with CLD [8,12,31-34]. In this review, we summarized the therapeutic mechanisms and beneficial effects of non–antidiabetic drugs in patients with CLD.
URSODEOXYCHOLIC ACID (UDCA)
Mechanism of action
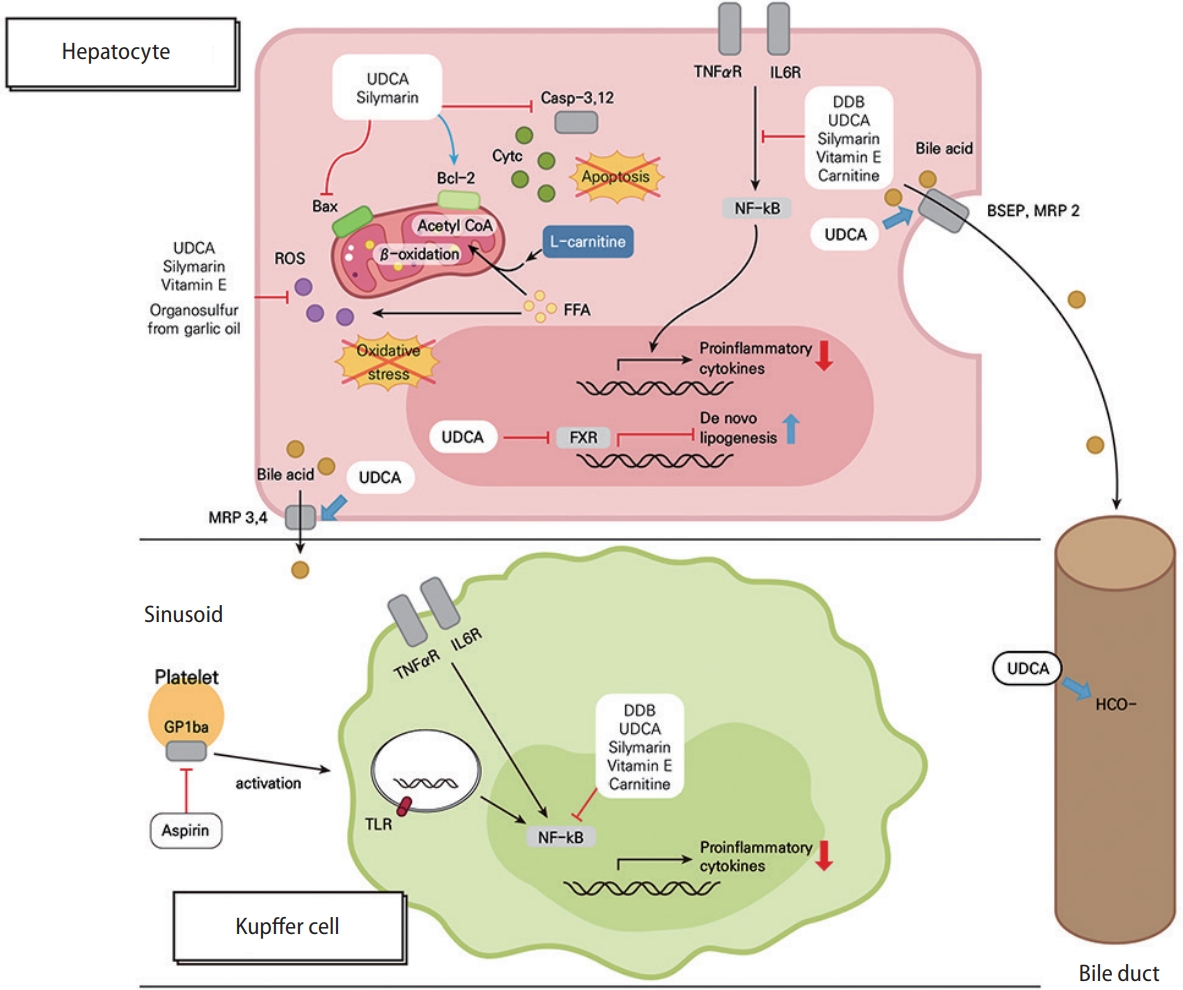
UDCA is a hydrophilic stereoisomer of chenodeoxycholic acid whose efficacy has been proven in primary biliary cholangitis (PBC), making it the recommended first-line treatment in affected patients [35,36]. Experimental models have shown that UDCA increases the secretion of bile acids and other anionic molecules, such as glutathione conjugates or bilirubin glucuronides, which abrogates cholestasis resulting from hydrophobic bile acids, cytokines, or sex hormones [16,17]. One of the mechanisms involved in the increased secretion of bile acids is the upregulation of hepatobiliary transporter genes such as bile salt export pump and multidrug-resistance proteins 2 and 3 (Fig. 1) [37].
UDCA alleviates intracellular oxidative stress via various mechanisms. Nuclear factor erythroid 2-related factor 2 (NRF2) is a critical stress sensor and a key transcription factor for detoxification, and UDCA enhances NRF2-mediated hepatocellular antioxidative processes in the rat liver [38]. UDCA was also shown to normalize excessive myeloperoxidase activity and reactive oxygen species (ROS) production in stressed rat livers by enhancing the intracellular levels of a reduced form of glutathione [39]. In liver-derived cell lines, the intracellular ROS levels were shown to be increased by palmitate treatment but reduced by co-treatment of palmitate and UDCA [40].
UDCA also protects hepatocytes from undergoing apoptosis [41]. There are multiple signaling pathways and mechanisms associated with the observed anti-apoptotic role of UDCA, such as the lowering of endoplasmic reticulum stress, enhancement of mitochondrial function and integrity, and accentuation of survival signaling among the nuclear factor kappa-B (NF-κB), phosphatidylinositol 3-kinase (PI3K), and mitogen-activated protein kinase pathways [16]. Specifically, UDCA negatively regulates the mitochondrial apoptotic pathway by inhibiting Bax translocation and reinforcing B-cell lymphoma 2 (Bcl-2) activity (Fig. 1) [42]. In stressed primary rat hepatocytes, UDCA was shown to regulate the E2F-1/p53/Bax pathway to block apoptosis [42,43]. UDCA was also proven to target the miR-34a/SIRT1/p53 pro-apoptotic pathway in free fatty acid (FFA)-treated primary rat hepatocytes and the rat liver, reducing hepatocyte apoptosis [44]. Finally, these anti-apoptotic roles of UDCA block caspase-3 activation [42].
Regarding steatosis in NAFLD livers, conflicting results have been offered. One recent report showed that UDCA induces neutral lipid accumulation in the liver in NAFLD patients by exerting farnesoid X receptor (FXR)-antagonistic effects [45]. On the contrary, another previous report showed that hepatic steatosis was decreased by UDCA in NAFLD rats, which was attributable to autophagy induction by activation of the adenosine monophosphate-activated protein kinase (AMPK) signaling pathway [46].
Importantly, UDCA also has immune-modulatory and anti-inflammatory effects in the liver. In patients with PBC, UDCA may alleviate auto-antigen–mediated liver injury by substantially reducing major histocompatibility complex class I expression in the liver [16,47]. In UDCA-fed, aged mice, inflammatory cytokines such as tumor necrosis factor (TNF)-α, C-C motif ligand 2, and interleukin-6 (IL-6) were significantly downregulated in liver and/or white adipose tissues relative to in the tissues of control mice [48]. These observed anti-inflammatory effects may occur as a consequence of the glucocorticoid receptor agonist activity of UDCA and resultant suppression of NF-κB-dependent inflammatory gene transcription in both parenchymal cells and non-parenchymal cells [49,50]. Moreover, UDCA impairs chemotaxis of liver-infiltrating T-cells by downregulation of intrahepatic interferon (IFN)-γ and C-X3-C motif chemokine ligand 1 expression [51]. Interestingly, systemic administration of UDCA attenuates experimental auto-immune arthritis by suppressing T helper 17 cell differentiation through the upregulation of small heterodimer partner interacting leucine zipper protein and by inducing the activation of AMPK and p38 in mouse CD4+ T-cells [52].
Clinically beneficial effects
NAFLD
In the past few decades, many clinical trials have been conducted to reveal whether UDCA has hepatoprotective effects in NAFLD as well as PBC. To date, however, such trials offer conflicting results because of different inclusion and exclusion criteria, treatment doses and durations, and combinations with various drugs in each study (Table 1).
A non-randomized, 1-year prospective study in 40 patients showed that 13–15 mg/kg/day of UDCA produced significant improvements in liver enzymes and hepatic steatosis compared to clofibrate [53]. In a large randomized controlled trial (RCT) with 166 patients, Lindor et al. [8] showed that treatment with 13–15 mg/kg/day of UDCA over 2 years reduced alanine aminotransferase (ALT) levels to the same extent as placebo (mean change, -32.7 vs. -31.6 U/L; P=0.60). However, there was no histologic benefit of UDCA treatment, although the proportion of subjects with improved steatosis was higher than that achieved with placebo, without statistical significance (46% vs. 37%; P=0.41). High rates of ALT and steatosis improvement in the placebo group and a high dropout rate, particularly in the UDCA group (30%), might be issues warranting careful interpretation. In a subsequent randomized trial, Dufour et al. [54] did not show that UDCA had any significant benefit over placebo in promoting biochemical and histologic improvements either, although patients in the UDCA group experienced continuous decreases in aminotransferase levels over 2 years. Instead, UDCA and vitamin E combination therapy improved aminotransferase levels, liver histology, and metabolic profile in patients with nonalcoholic steatohepatitis (NASH) [54,55].
Based on the benefits of high-dose UDCA (HD-UDCA) in other CLDs [56,57], two RCTs with HD-UDCA therapy were conducted. Leuschner et al. assigned 185 patients with biopsyproven NASH to either HD-UDCA (23–28 mg/kg/day) or placebo treatment for 18 months [58]. HD-UDCA failed to improve overall histology over placebo, the primary endpoint, although lobular inflammation (P for NAFLD activity score [NAS]=0.005) and γ-glutamyl transferase (GGT) improved significantly (mean change, -52.53 vs. -16.84 U/L; P<0.0001). On the other hand, Ratziu et al. [59] conducted another randomized trial in which a total of 126 patients with biopsyproven NASH were randomized to receive HD-UDCA (28–35 mg/kg/day) or placebo for 1 year. The reductions in ALT level (-28.3% vs. -1.6% from baseline; P<0.001) and FibroTest measure (median change, -10.5% vs. +9.6%; P<0.006), which was used as a surrogate marker for fibrosis, was significantly greater in the HD-UDCA group than the placebo group. In addition, patients treated with HD-UDCA experienced significant reductions in serum glucose level and improved insulin resistance compared to patients in the placebo group. Different UDCA doses, treatment durations, and NAS at baseline might explain the discrepant results between the two studies.
Recently, norursodeoxycholic acid (nor-UDCA), a synthetic side chain–shortened homologue of UDCA [60], was evaluated for the treatment of NAFLD based on promising results in pre-clinical studies [61,62]. In a randomized controlled, phase II clinical trial involving 198 patients, 1,500 mg/day of nor-UDCA significantly reduced serum ALT levels within 12 weeks (mean change, -17.2 vs. +5.3 U/L; P<0.0001), and nor-UDCA was found to be safe and well tolerated [63]. In addition, hepatic fat fraction measured by magnetic resonance spectroscopy was remarkably reduced in nor-UDCA-treated patients (-23.5% vs. -1.0%).
Taken together, the results of various clinical trials suggest that conventional doses of UDCA (13–15 mg/kg/day) in monotherapy have little therapeutic effect in NASH, but HD-UDCA (28–35 mg/kg/day) may be beneficial in driving biochemical improvements in NASH patients with low severity. In addition, a conventional dose of UDCA may help to improve NASH when administered in combination with vitamin E. Further studies to evaluate the beneficial effects of nor-UDCA in patients with NAFLD or NASH are warranted.
Viral hepatitis
The role of UDCA in viral hepatitis has not been studied extensively. There are a few studies evaluating the effect of UDCA in patients with chronic hepatitis C (CHC) with or without IFN treatment (Table 1). Fabbri et al. [64] conducted an RCT involving 103 patients who had not responded to IFN therapy. Patients were randomized to receive UDCA (600 mg/day) in addition to IFN or to continue on IFN-α alone. After stopping α-IFN, patients who received UDCA continued to receive UDCA for an additional 6 months. UDCA improved the response rate to α-IFN (ALT normalization, 38% vs. 12%; P<0.01) and reduced the severity of relapse. In another RCT involving 107 biochemical responders to IFN, patients were randomized to receive either UDCA (10 mg/kg/day) or placebo for 12 months [65]. Continuation of UDCA therapy after withdrawal of IFN therapy did not significantly improve the maintenance of response to IFN or liver histology parameters in IFN responders. The most recent large-scale randomized trial was conducted in 596 CHC patients with detectable HCV RNA [66]. Patients were assigned randomly to receive 150, 600, or 900 mg/day of UDCA for 24 weeks, and it was found that 600 mg/day of UDCA was the optimal dose to decrease aspartate aminotransferase (AST) (-25.0% vs. -13.6% from baseline; P<0.001) and ALT (-29.2% vs. -15.3% from baseline; P<0.001) levels compared to 150 mg/day, while the GGT concentration was significantly lower in the 900-mg/day group than the 600-mg/day group (-50.5% vs. -41.0% from baseline; P<0.001), which may indicate an improvement in cholestasis due to biliary injury in CHC. However, the serum HCV RNA did not change in any group.
Accordingly, UDCA may lead to an improvement in serum aminotransferase activities in CHC without effects on viral clearance. Since all studies were conducted in the IFN era, which carries a low treatment response rate, further considerations and studies are needed on the role of UDCA in CHC at this time of using DAAs.
Safety
UDCA is widely used in the treatment of patients with PBC and has shown an excellent safety profile [67]. In viral hepatitis or NAFLD patients as well, no safety issues have been raised in various RCTs, even in studies with long-term administration of HD-UDCA. The most commonly reported adverse event of UDCA therapy is diarrhea [8,58,59,66], although abdominal discomfort, fatigue, rash, and pruritus were also reported [8,58,59]. The rate of clinical adverse events was similar for UDCA and placebo when the conventional dose was administered, whereas diarrhea occurred more frequently with HDUDCA than placebo [8,58,59].
SILYMARIN
Mechanism of action
The bioactive extract of milk thistle, silymarin, has been documented to have several pharmacological features, including antioxidant and anti-inflammatory properties, in preclinical studies (Fig. 1) [68-73].
Silymarin uses scavengers, allowing for the elimination of free radicals; inhibits ROS producing-enzymes, preventing free radical formation; promotes protective molecule synthesis; and activates antioxidant enzymes [18]. In experimental studies, silybin, the most prevalent and biologically active flavonolignan isomer of silymarin, potently scavenges ROS such as hydroxyl and peroxyl anions and hypochlorous acid [72,74-76]. Also, silybin inhibits superoxide anion radicals and nitric oxide in isolated Kupffer cells [68]. Silymarin enhances hepatic glutathione generation by elevating cysteine availability and helps the liver to maintain glutathione by stabilizing membrane permeability through the inhibition of lipid peroxidation [69]. In an NAFLD mouse model, silymarin restored nicotinamide adenine dinucleotide+ (NAD+) homeostasis, sirtuin 1 activity, and the AMPK-α pathway to improve poly-(ADP-ribose)-polymerase function, which are important regulatory pathways linked to oxidative stress [77]. The antioxidant property of silymarin prevents or reduces hepatic inflammation by reducing oxidative stress in various liver diseases [78].
Silymarin also exerts an anti-inflammatory effect. There is increasing evidence that silymarin inhibits inflammatory mediators, such as NF-κB, which is activated in most CLD, and inflammatory metabolites [79]. In isolated rat Kupffer cells, silymarin selectively inhibits leukotriene B4 formation, but weakly inhibited prostaglandin E2 formation, which may account for its anti-inflammatory action [68]. The anti-inflammatory property of silymarin may help to prevent or improve hepatic fibrogenesis given that chronic inflammation has been a common underlying mechanism in progressive liver fibrosis [80].
Silymarin also has anti-fibrotic activity, inhibiting the conversion of hepatic stellate cells (HSCs) into myofibroblasts through the inhibition of fibrogenic pathways, including cytoskeletal formation, pro-fibrogenic collagen, and electron transfer chains. Animal and in vitro models demonstrate that silymarin down-regulates tumor growth factor (TGF)-ß1 mRNA and inhibits NF-κB to improve hepatic fibrosis [79,81,82]. In an in vitro study, silybin inhibited the growth factor-induced production of pro-collagen in activated human HSC dose-dependently, slowing down the progression of early fibrosis [81].
Insulin resistance is a well-known key mechanism in the pathogenesis of NAFLD. In a rat NAFLD model, silybin decreased insulin resistance by reducing visceral obesity, enhancing lipolysis, and inhibiting gluconeogenesis [83]. Silymarin can also restore a pathway of insulin receptor substrate-1/PI3K/Akt, which can reduce NAFLD-induced insulin resistance and steatosis, as well as activate the FXR, which in turn can decrease hepatic inflammation [26,84].
Clinically beneficial effects
NAFLD
The clinical applications of silymarin in NAFLD have been identified in several RCTs to date (Table 2) [9,28,31,85-87]. Among them, two studies investigated the efficacy of silymarin in patients with histologically confirmed NAFLD [9,31]. In an RCT with 49 patients treated with 2,100 mg/day of silymarin and 50 patients treated with placebo, the proportion of patients who showed improvements in fibrosis (≥1 stage) was significantly higher in the silymarin group compared to the placebo group (22.4% vs. 6.0%; P=0.023), while the proportion of patients who had improvements in NAS (≥30%) was statistically comparable between the silymarin and placebo groups (32.7% vs. 26.0%; P=0.467) [31]. Another RCT also showed no statistically significant difference in the improvement of NAS (≥2 points) between the silymarin and placebo groups (15– 19% vs. 12%; P=0.79) [9]; however, a retrospective cohort study demonstrated that patients with higher levels of oxidative stress markers had statistically significant improvements in NAS after silymarin treatment (variation, -70%; P=0.001), while those with lower levels of oxidative stress markers did not (variation, -29%; P=0.057), suggesting the effect of silymarin based on its antioxidant properties [88]. It is expected that further studies with selected subgroups of patients using relevant biomarkers representing the severity of oxidative stress or inflammation may reveal the clinically beneficial effect of silymarin in the histologic improvement of NAFLD more clearly.
The significant association between silymarin treatment and the improvement in aminotransferase levels in patients with NAFLD has been well reported in several RCTs [28,85-87]. Levels of AST (mean difference, -8.3 vs. -0.9 U/mL; P<0.001) and ALT (mean difference, -9.3 vs. -0.6 U/mL; P<0.001) significantly improved in the silymarin group compared to the placebo group [87]. In an RCT comparing pioglitazone, metformin, and silymarin, changes in AST (mean, -17.41 vs. -12.36 vs. -18.23; P=0.003) and ALT (mean, -25.18 vs. -17.41 vs. -25.68; P<0.005) levels after treatment were significantly different between the treatment groups [28]. Finally, a recent meta-analysis involving 622 patients with NAFLD revealed that silymarin was more efficacious than placebo in reducing ALT (mean difference, -14.86; 95% confidence interval [CI], -19.37 to -10.36; I2=39%; P<0.001) and AST (mean difference, -7.11; 95% CI, -14.16 to -0.05; I2=88%; P<0.05) levels [89].
In addition, significant improvements in metabolic parameters, including levels of triglyceride, fasting glucose, and total cholesterol, as well as values of the Homeostatic Model Assessment for Insulin Resistance (HOMA-IR), waist circumference, and body mass index (BMI) following treatment with silymarin have been reported in previous RCTs and a prospective cohort study, suggesting the potential of silymarin for the treatment of metabolic syndrome [28,31,87,90].
Overall, silymarin treatment in NAFLD seems beneficial in improving hepatic necro-inflammation, as reflected by the improvement of AST and ALT levels, and metabolic parameters. Therefore, silymarin may be a potential future therapy for patients with NASH, presumably in combination with other agents, but still requires large RCTs for solid validation.
Viral hepatitis
The beneficial effect of silymarin in improving aminotransferase in CHC patients remains controversial despite several RCTs and prospective studies (Table 2) [91-95]. In an RCT with CHC patients in whom IFN therapy was unsuccessful, the proportion of patients who had ALT normalization was statistically comparable between the silymarin and placebo groups (3.8–4.0% vs. 1.9%; P=0.80) [91]. Another RCT with CHC patients who were treatment-naïve or relapsers/non-responders to IFN or combined therapy showed a significant improvement in ALT level in a spirulina group compared to the silymarin group (mean,-23.7 vs. -6.8 IU/L; P=0.006) [92]. In contrast, a prospective study reported significant reductions in levels of ALT (mean, 108.7–70.3 IU/L; P<0.001) and AST (mean, 99.4–59.7 IU/L; P=0.004) after silymarin treatment [93]. Two prospective studies demonstrated significant reductions in HCV RNA levels after silymarin treatment; however, silymarin had no effect in the suppression of HCV RNA in all RCTs [91-95].
Safety
In clinical trials, silymarin has been used for up to 48 weeks at 2,100 mg/day [9,31]. Overall, silymarin is well tolerated in CLD patients with no or only a very low incidence of serious adverse events [9,28,31,85-88,90-95]. Systematic reviews demonstrated a 4% incidence of adverse events and no treatment-related serious adverse events or deaths [89,96].
DIMETHYL-4,4’-DIMETHOXY-5,6,5’,6’-DIMETHYLENEDIXOYBIPHENYL-2,2’-DICARBOXYLATE (DDB) AND ITS COMBINATION WITH OTHER SUPPLEMENTS
Mechanism of action
DDB is a synthetic compound derived from schisandrin C, an active metabolite from Schizandrae sinensis Fructus. It has been widely used in practice to lower ALT levels in chronic hepatitis for nearly 50 years [97]. The protective roles of DDB were reported in experimental models of liver injury using carbon tetrachloride (CCl4), D-galactosamine, thioacetamide, and prednisolone [19]. It is known to reduce the membranal lipid peroxidation and ALT release from damaged hepatocytes (Fig. 1) [19,98]. DDB has also shown additional inhibitory effects on lipopolysaccharides (LPS)-inducible NF-κB activation and subsequent TNF-α production [99], It is related to the inhibition of either IkBα degradation or signaling of caspases-3, -8, and -9 [99,100].
Carnitine orotate complex or diallyl sulfide from garlic oil has been used in combination with DDB to add clinical benefit with different mechanisms of action. A DDB-carnitine orotate complex prevented FFA-induced lipotoxicity by adding carnitine (Fig. 1). In a physiologic state, carnitine shuttles long-chain fatty acids into mitochondria and facilitates mitochondrial β-oxidation by acting as a coenzyme for palmitoyltransferase 1A [101]. In an in vitro study, carnitine facilitated effective mitochondrial β-oxidation, thereby reducing both intracellular fat deposits and alternative fat peroxidation, which ultimately leads to decreased production of ROS and oxidative stress [102]. Carnitine treatment in diabetic rats fed a methionine choline-deficient diet led to decreased serum ALT levels and improved lobular inflammation in vivo [102]. Meanwhile, diallyl sulfide, one of the organosulfur compounds from garlic oil, is known to inhibit the action of CYP450 2E1 [103,104]. It modulates the production of toxic or reactive intermediate during phase II detoxification (Fig. 1) [105]. Garlic oil enhanced the protective effect of DDB in the improvement of serum ALT level and was linked to decreasing numbers of Kupffer cells and dead hepatocytes in CCl4-treated rats [106]. Meanwhile, in case of alcohol-induced hepatotoxicity, it was only blocked by adding garlic oil to DDB (~40%) and not by DDB only. Furthermore, Park et al. [107] reported that garlic oil combined with DDB was protective of glutathione deficiency-induced liver injury as evidenced by improved ALT and triglyceride levels. Garlic oil combined with DDB showed a synergetic benefit according to a comparison of its histologic activity to that of treatment with only DDB or garlic oil.
Clinically beneficial effects
CLD
Apart from the widespread experimental studies with long histories, well-designed, RCTs are limited, involving only a small number of participants and short duration of treatment (Table 3). In the design of a double-blind, active-controlled trial, participants with CLDs (NASH, 69%; alcoholic hepatitis, 20%; chronic hepatitis, 11%) were treated with either DDB (750 mg/day) or UDCA (300 mg/day) for 24 weeks [10], and DDB led to a significantly higher rate of ALT normalization compared to UDCA (80.0% vs. 34.8%, P<0.001).
Supplementing DDB with carnitine orotate complex was evaluated in two RCTs. In a phase II RCT for CLDs other than viral hepatitis, 8 weeks of supplementing DDB (150 mg) with carnitine orotate complex (900 mg) led to a significantly higher rate of ALT normalization (88.5%) compared to combined carnitine orotate complex (600 mg) and DDB (150 mg) (54.5%) treatment or treatment with DDB (150 mg) only (44.4%) (P=0.003) [108]. In a phase III trial of participants with CLDs other than viral hepatitis [109], adding a high dose of carnitine orotate complex (900 mg) to DDB (150 mg) led to a higher rate of ALT normalization (81.1%) than adding a low dose of carnitine orotate complex (600 mg) to DDB (100 mg) (67.4%) or treating with DDB (100 mg) alone (64.5%) (P=0.041) (Table 3).
The addition of garlic oil to DDB was recently evaluated in a double-blind RCT with 12 weeks of intervention (Table 3) [110]. Kim et al. [110] evaluated the beneficial effect on ALT normalization, improvement of quality of life, and safety of the DDB-garlic oil complex in patients with CLDs other than viral hepatitis. The rate of ALT normalization was 89% in the DDB–garlic oil complex group, which was significantly higher than that of the silymarin group (18.6%) or placebo group (22.9%) (P<0.001). The level of serum malondialdehyde, a lipid peroxidation marker, was decreased in the DDB-garlic oil complex group (-1.4 pmol/mg), but increased in both the silymarincontrol and placebo groups (P<0.001). Although the score for total CLD questionnaire score was significantly improved within the DDB-garlic oil complex group after treatment, the score improvement was statistically similar among the three treatment groups.
In summary, DDB and its combination with other supplements seems to significantly decrease the serum level of ALT in patients with CLDs other than viral hepatitis, when compared to silymarin or placebo.
NAFLD
Given the benefit of carnitine on the reduction in intracellular FFA level and the improvement of insulin resistance, the effect of a DDB-carnitine orotate complex was evaluated in participants with either impaired fasting glucose metabolism or type 2 diabetes (Table 3). In a double-blind RCT, either metformin and placebo or metformin and a DDB-carnitine orotate complex was given for 12 weeks to participants with both impaired fasting glucose metabolism and NAFLD [112]. Even with the small number of patients in each group, the reduction in ALT from baseline was significantly greater in the metformin and DDB-carnitine orotate complex group (mean reduction, 51.5±33.2 IU/L) than in the metformin and placebo group (mean reduction, 16.7±31.3 IU/L) among the patients with impaired fasting glucose metabolism and NAFLD (P=0.001). The change in 8-hydroxy-2’-deoxyguanosine, an oxidative stress marker, was 0.7±3.2 μg/g in the metformin and DDB-carnitine orotate complex group and -1.2±2.9 μg/g in the metformin and placebo group (P=0.034), suggesting a benefit of the DDB-carnitine orotate complex in decreasing oxidative stress. Furthermore, the fold change (2−ΔΔCt) in mitochondrial copy number was significantly greater in the metformin and DDB-carnitine orotate complex group than that of the metformin and placebo group (1.16±0.38 vs. 0.95±0.45, P<0.05), suggesting the occurrence of less mitochondrial damage in the DDB-carnitine orotate complex group. Nevertheless, the additional effects of the DDB-carnitine orotate complex on the changes of fasting plasma glucose, C-peptide, insulin, HbA1c, and HOMA-IR were not significant.
In another multicenter, double-blind, placebo-controlled RCT, Bae et al. [112] evaluated the effect of adding a DDB-carnitine orotate complex to anti-diabetic treatment on ALT normalization in patients with type 2 diabetes and NAFLD. At 12 weeks of treatment, the rate of ALT normalization was significantly higher in the DDB-carnitine orotate complex treatment group than the placebo group (89.7% vs. 17.9%, P<0.001). The liver attenuation index according to non-contrast computed tomography was also significantly increased in the DDB-carnitine orotate complex group compared to the placebo group (6.21±8.96 vs. 0.74±8.05 Hounsfield units, P=0.008), indicating that the DDB-carnitine orotate complex has a beneficial effect in terms of the improvement of steatosis among patients with both type 2 diabetes and NAFLD.
In summary, a DDB-carnitine orotate complex is effective in ALT normalization in NAFLD, but its beneficial effect on the improvement of insulin resistance in NAFLD combined with either impaired fasting glucose metabolism or type 2 diabetes should be further investigated to gather solid evidence. Additionally, there is an unmet need for further data supporting the effects of DDB-containing drugs on the improvement of liver histology.
Viral hepatitis
The beneficial effect of a DDB-carnitine orotate complex in ALT normalization was evaluated in treatment-naïve chronic hepatitis B (CHB) patients with concomitant use of entecavir (Table 3) [113]. Despite there being no effect on virologic response, the DDB-carnitine orotate complex combined with entecavir led to a higher rate of ALT normalization (100%) compared to entecavir treatment only (85.7%) after 12 months (P=0.002). This might indicate that a DDB-carnitine orotate complex can synergistically stabilize hepatic necroinflammation during antiviral therapy for CHB.
Safety
Except for a mild degree of skin urticaria [10], no severe adverse events related to DDB have been reported. Adverse events supposed to have a causal relationship with DDB and carnitine orotate complex use include abdominal discomfort, indigestion, headache, and nausea [109,113]. Rates of adverse events did not differ among the control, low-dose, and high-dose groups using DDB and carnitine orotate complex [109]. The adverse events possibly related to DDB-garlic oil treatment were diarrhea, dry mouth, epigastric soreness, rash, and so on [111]. The rates of adverse events were not different compared to those of the placebo control group or active control (silymarin) group, and no serious adverse events occurred during the 12 weeks of the study period [110].
L-ORNITHINE L-ASPARTATE (LOLA)
Mechanism of action
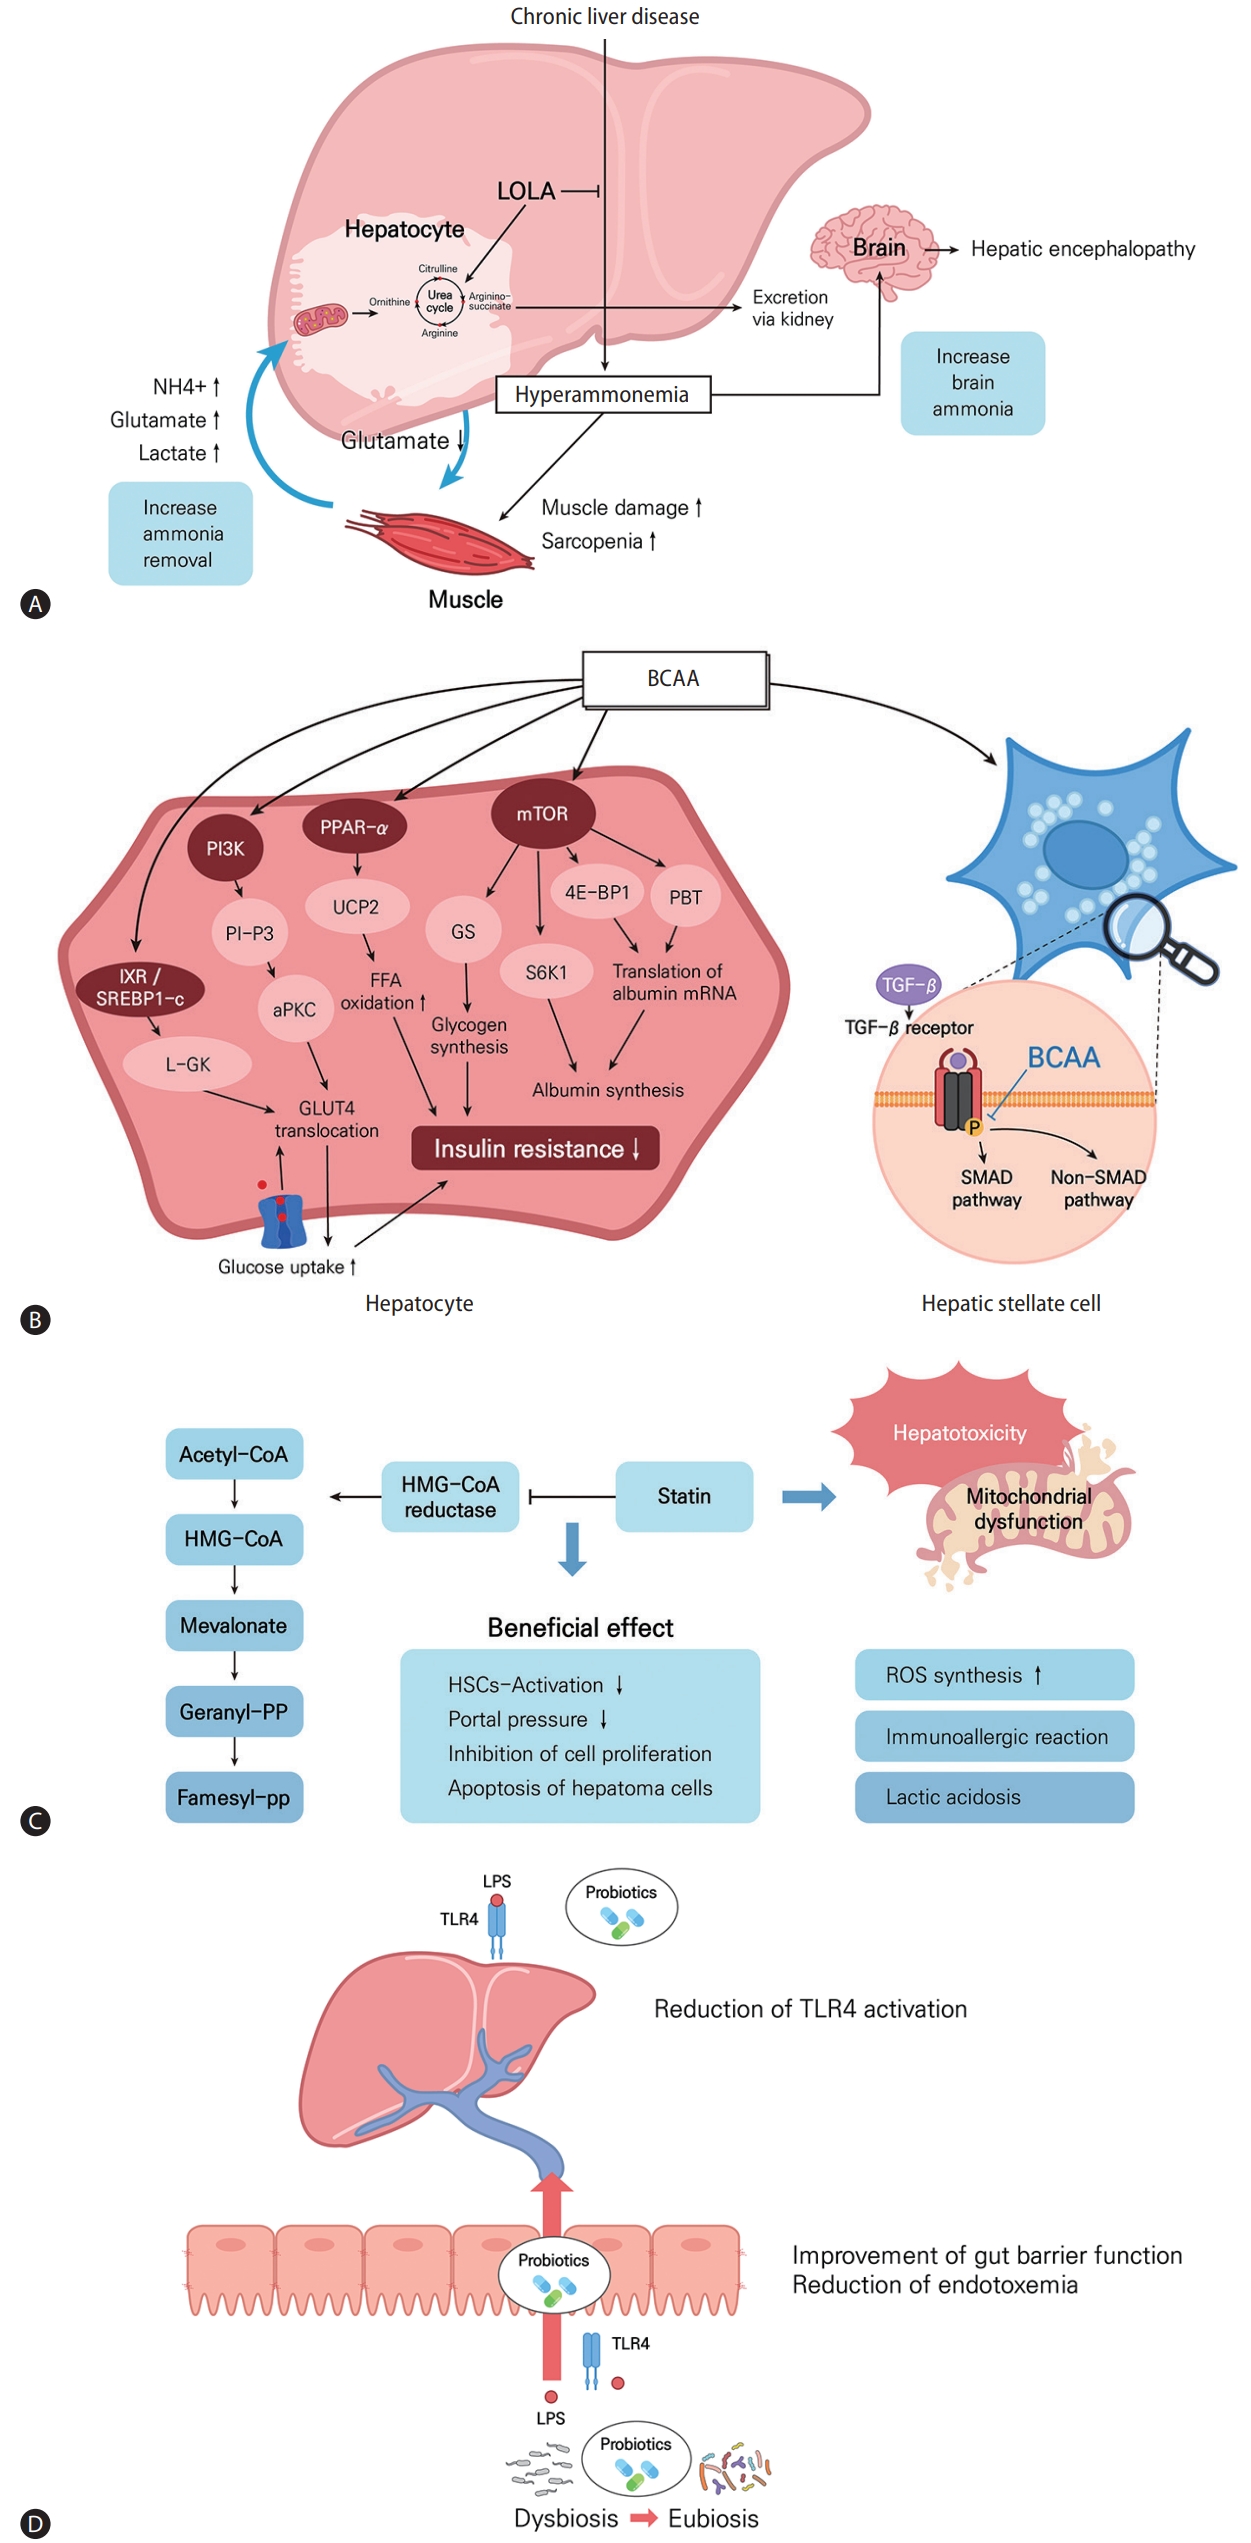
LOLA is a mixture of endogenous amino acids that promotes ammonia removal in patients with liver cirrhosis [114,115]. Ammonia is produced as a result of nitrogen metabolism in muscle and other peripheral tissues [114]. In the liver, ammonia is converted into urea, which is excreted in urine [116]. Impaired liver function can result in an elevated ammonia concentration [117]. In experimental models, the expression levels of genes encoding urea-cycle enzymes, as well as the amounts of those enzymes, are reduced, suppressing ureagenesis and inducing hyperammonemia in a pre-cirrhotic state [21]. Hyperammonemia may trigger fibrosis progression in patients with NASH.
LOLA promotes ammonia removal by increasing the synthesis of urea (Fig. 2A). Hypermethylation of urea cycle-related genes and reduced quantities and activities of urea-cycle enzymes have been noted in patients with NASH [20]. These changes increase the plasma ammonia concentration and result in ammonia accumulation in the liver tissue of patients with NASH. LOLA reduces the serum concentrations of liver enzymes and triglycerides in patients with NASH. The underlying mechanisms of this effect may be enhanced by ammonia removal, increased antioxidant activity, attenuated lipid peroxidation by glutamine and GHS, and improved hepatic microcirculation by L-arginine-derived nitric oxide.
Clinically beneficial effects
NAFLD
Few studies have evaluated LOLA as a treatment for NASH. A total of 463 patients with fatty liver, 29% of whom had NAFLD, were treated with LOLA during 1–3 months [96]. It was determined that LOLA reduced serum AST, ALT, and GGT levels by up to 70% in patients with CLD (AST, from mean of 48.1±53.7 to 25.7±16.1 U/L; ALT, from mean of 52.6±44.7 to 39.2±36.5 U/L; GGT, from mean of 155.4±236.7 to 60.9±56.3 U/L) [96]. Moreover, beneficial treatment outcomes were more pronounced in patients with fatty liver than those with cirrhosis [118]. In a multicenter open-label, multidose RCT [119], the efficacy of LOLA was assessed in 72 patients with NASH. Patients were prescribed high-dose (6 g bid; n=38) or low-dose (3 g bid; n=34) LOLA for 12 weeks. After 6 and 12 weeks of treatment, the serum levels of AST (baseline: mean, 82.28±29.92; 6 weeks: mean, 66.64±29.17; 12 weeks: mean, 61.86±26.69 U/L), ALT (baseline: mean, 106.95±39.90; 6 weeks: mean, 84.10±38.98; 12 weeks: mean, 65.80±26.73 U/L), and GGT (baseline: mean, 114.29±44.72; 6 weeks: mean, 90.10±34.96; 12 weeks: mean, 70.87±23.57 U/L) were significantly lowered in both groups than at baseline. Additionally, LOLA resulted in a significant dose-related reduction in the levels of ALT (low-dose vs. high dose group: 6-week mean, 22.85±26.88 vs. 35.92±32.28 U/L; P<0,0001; 12-week mean, 41.15±24.07 vs. 50.19±28.08 U/L; P<0.0001) [119]. In another study with 78 patients with NASH, LOLA improved hepatic microcirculation as evaluated by polyhepatography (a modified technique for the non-invasive estimation of intrahepatic blood flow) in the presence of stage 0–1 fibrosis [120]. However, the gathered data were limited due to the small sample size and use of serum transaminase as the main outcome. Thus, further studies of the effect of LOLA in patients with NAFLD are needed.
Hepatic encephalopathy (HE)
HE is a severe neuropsychiatric complication of cirrhosis [121], characterized by deficits in attention, visuospatial construction, and impaired motor speed. Hyperammonemia is consistently reported in such patients. Treatment strategies principally seek to lower the levels of circulating ammonia. In a systematic review and meta-analysis, LOLA appeared to improve the mental state (pooled risk ratio [RR], 1.36; 95% CI, 1.10–1.69; P=0.005) and lower the ammonia level (mean difference, -17.50 μmol/L; P=0.0008) of patients with overt HE or minimal HE [115]. A recent double-blind, randomized, placebo-controlled trial showed that combining intravenous LOLA with lactulose and rifaximin significantly improved the HE grade (92.5% vs. 66%; P<0.001), shortened the recovery time (mean, 2.70±0.46 vs. 3.00±0.87 days; P=0.03), and reduced the 28-day mortality rate (16.4% vs. 41.8%; P=0.001) compared to only lactulose and rifaximin use [24]. In addition, the LOLA group showed significantly higher reductions in levels of blood ammonia (mean, 51.69±10.835 vs. 37.52±12.41 μmol/L; P<0.001) and inflammatory markers such as IL-6 (mean, 36.43±27.51 vs. 26.93±20.55 pg/mL; P=0.025) and TNF-α (mean, 10.83±5.12 vs. 8.77±5.56; P=0.027), compared to the placebo group [24].
BRANCHED CHAIN AMINO ACIDS (BCAAs)
Mechanism of action
BCAAs are some of the essential amino acids and consist of leucine, valine, and isoleucine. In basic research, BCAAs have been studied in relation to metabolism, liver fibrosis, and immunity (Fig. 2B). First, with respect to metabolism, BCAAs were reported to have major effects on 1) protein/albumin synthesis and 2) glucose/lipid metabolism and insulin resistance. Among the BCAAs, leucine, in particular, increases albumin production [22]. Specifically, leucine activates the mTOR pathway and increases the transcription of albumin mRNA by increasing 4E-binding protein downstream of the mTOR pathway [122-124]. In addition, in HepG2 cells, a mechanism by which BCAA-stimulated polypyrimidine tract-binding protein binds to albumin mRNA and increases albumin translation has been reported [125]. The mechanisms by which BCAAs affect glucose metabolism have also been variously reported, such as the PI3KAkt pathway [126,127], induced glucose transporter (GLUT)-4 and GLUT-1 translocation, and increased glycogen synthase activity [128]. BCAAs improve insulin resistance through liver, skeletal muscle, and adipose tissue, respectively, and PI3K, peroxisome proliferator-activated receptor (PPAR)-α, and Akt pathways are involved [126,128-130]. Recently, it has been reported that BCAA administration inhibits the lipogenesis-related genes FAS and ACC through the proliferation of intestinal flora, thereby inhibiting lipogenesis [131]. Also, BCAA administration can help improve hepatic fibrosis, and the main mechanism is inhibition of the TGF-β signaling pathway of HSCs [132-135]. Lastly, among BCAAs, valine especially can help to restore immune function by regulating the maturation and function of monocyte-derived dendritic cells in cirrhotic patients [136].
Clinically beneficial effects
Viral hepatitis
In viral hepatitis, BCAA administration improved HOMA-IR in insulin-resistant CHC patients (mean after treatment, 4.5 in the BCAA group vs. 5.3 in the control group; P=0.047) [29]. Also, 2-year BCAA administration in obese CHC patients was effective in preventing HCC and improving IFN signaling promoted by malnutrition (event-free survival for HCC: hazard ratio [HR], 0.3; 95% CI, 0.12–0.78, P=0.008) (Table 4) [137].
Liver cirrhosis
In patients with liver cirrhosis, the effect of BCAA on the prognosis of cirrhotic patients has been verified through various RCTs (Table 4). BCAA administration for >6–12 months has been commonly reported to reduce clinical decompensation (14.8% vs. 30.4%; P=0.043) [138]. In particular, BCAA was effective in reducing the occurrence of varix rupture, the rate of hepatic failure, and incidence of de novo HE [138-143]. BCAA was also found to be helpful for improving aspects of the quality of life (i.e., physical functioning improved from 67%±4% to 73%±3%; P=0.023) [144]. such as sleep disturbance (change in Epworth Sleepiness Scale: BCAA group, -5.5 vs. control group, 1.2; P<0.05) [145]. and nutritional status or sarcopenia [139,146,147]. As for the method of BCAA administration, both taking BCAAs as drugs and eating BCAA-rich foods during late-night meals were effective [139,148,149]. On the other hand, BCAA administration did not lead to improvements in measures of liver function itself, such as Model for End-stage Liver Disease (MELD) or Child-Turcotte-Pugh (CTP) scores, in many studies [138,140,142-144]. Also, whether or not BCAAs can prolong overall survival (OS) differs between studies. Recently, two meta-analyses showed that BCAA supplements had no effect on survival [150,151].
Although BCAA administration was effective in improving liver function and reducing the risk of decompensation in patients with liver cirrhosis, further prospective studies are still required to discern whether BCAA is effective for patients with non-cirrhosis.
HE
BCAAs have been reported to be effective in both minimal HE and overt HE (Table 4) [32,151]. According to meta-analysis results, BCAA administration improved HE compared to the control group (RR, 1.71; 95% CI, 1.17–2.51) [150]. However, in patients with a previous history of HE, BCAA administration had no significant effect on the recurrence of HE (BCAA group, 47% vs. control group, 34%; P=0.274) [32]. This phenomenon can be explained by that facts that BCAAs reduce ammonia levels [152,153] and increase cerebral blood flow in cirrhotic patients [154], respectively.
To date, BCAA administration has shown a beneficial effect in patients with HE. However, additional research is needed to determine whether BCAA administration will be effective for decompensation in conditions other than HE, such as variceal bleeding, ascites, and jaundice.
Safety
Adverse events related to BCAA administration were not reported in most studies, including RCTs. In a Cochrane review of 5 studies [11,144,155-157], BCAA did not increase the risk of serious adverse events, but they were associated with nausea and diarrhea, although not to a significant degree (RR, 3.39; 95% CI, 0.7–16.46) [151].
STATIN
Mechanism of action
Statins are inhibitors of hydroxymethylglutaryl coenzyme A (HMG-CoA) reductase and are used as lipid-lowering agents by >200 million patients worldwide [158]. The major pharmacologic effect of statin is decreased production of cholesterol precursors and cholesterol biosynthesis, resulting in the prevention of atherosclerosis to reduce cardiovascular and cerebrovascular events and mortality [23]. In addition to their lipid-lowering effect, statins are well known to have other beneficial effects, causing improvements in endothelial function and displaying anti-inflammatory, immunomodulatory, and anti-thrombotic effects (Fig. 2C) [159]. Statins interfere with the activation of small GTPases like RhoA and Ras proteins, which can modulate endothelial nitric oxide synthaseand nitric oxide activity [160]. Statins activate PPAR-α and -β oxidation, resulting in the reduction of intrahepatic inflammation [161]. Statins can also induce the protection of liver sinusoidal endothelial cells (LSECs) and mediate paracrine endothelial-HSC deactivation through the induction of transcription factor Kruppel-like factor 2 [162]. Deactivation of HSCs and stabilization of LSECs lead to the alleviation of hepatic fibrosis and portal pressure [163]. Statins also showed anti-tumor effects in HCC by reducing cell proliferation and tumor cell adhesion [164].
Clinically beneficial effects
NAFLD
Several reports have suggested beneficial effects of statins in NAFLD and NASH (Table 5). Nelson et al. [12] conducted an RCT that investigated the therapeutic effects of simvastatin in biopsy-proven NASH patients. This study included a small number of patients, and there was no significant difference in necroinflammatory activity (mean, 1.4±0.5 vs. 1.0±1.4; P>0.05) or fibrosis stage (1.50±0.9 vs. 1.0±1.4; P>0.05) between the simvastatin group and placebo group. However, two cross-sectional studies reported that statin treatment had protective effects against NASH progression. One study enrolled 108 statin users and 1,094 controls who received liver biopsy for suspected NASH [165]. In this study, statin treatment was associated with a reduced risk of steatosis (odds ratio [OR], 0.09; 95% CI, 0.01–0.32, P=0.004), NASH (OR, 0.25; 95% CI, 0.13–0.47, P<0.001), and F2–F4 fibrosis (OR, 0.42 95% CI, 0.20–0.80; P=0.017) after matching [165]. The other study enrolled 346 diabetes patients with biopsy-proven NAFLD and reported that statin treatment reduced the risk of NASH (OR, 0.57; 95% CI, 0.32–1.01, P=0.055) and F2–F4 fibrosis (OR, 0.47; 95% CI, 0.26–0.84, P=0.011) [166]. In addition, another retrospective cohort study reported that statin treatment significantly reduced the amount of hepatic steatosis from a mean rate of 20.4% at baseline to 11.1% at follow-up (P=0.001), whereas the control group did not experience such a change [167].
Several prospective cohort studies have reported that statin treatments using pravastatin, atorvastatin, and rosuvastatin have beneficial effects in improving the histologic grade of NAFLD and NASH [168-171]. On the other hand, pitavastatin did not significantly change NAS or fibrosis stage [172]. In a large population-based study, statin treatment reduced the risk of NAFLD development (adjusted OR, 0.66; 95% CI, 0.65–0.67) and fibrosis development (adjusted OR, 0.43; 95% CI, 0.42–0.44). In a study using data from the National Health Information database of South Korea, statin treatment decreased not only the risk of NAFLD occurrence but also the development of fibrosis attributed to NAFLD, regardless of diabetes mellitus [173]. A meta-analysis by Fatima et al. [174] reported that statin treatment reduced the risk of NAFLD development (OR, 0.69; 95% CI, 0.57–0.84; I2=36%; P=0.0002); ALT and GGT levels; and histologic grades with steatosis, inflammation, and fibrosis. There was also a report that statin treatment reduced the HCC risk in patients with NAFLD (HR, 0.47; 95% CI, 0.36–0.60) [175].
Collectively, there is increasing evidence that statin treatment might have protective effects on NAFLD/NASH development and a beneficial effect of histologic improvement for NAFLD/NASH. Therefore, statins can be used in NAFLD and NASH, and they are considered first-line treatments to lower low-density lipoprotein (LDL) cholesterol and prevent atherosclerotic cerebrovascular disease. However, well-organized RCTs are required to establish a therapeutic effect of statin in NAFLD/NASH patients with histologic confirmation, and long-term, large-scale prospective cohort studies are also needed to identify whether statin treatments are associated with liver-related outcomes in patients with NAFLD/NASH.
Viral hepatitis
Three studies with CHB patients reported another beneficial effect of statin use. According to a large-scale retrospective cohort study including patients with CLD, lovastatin use was associated with lower incidence rates of liver-test abnormalities (incident RR [IRR], 0.28; 95% CI, 0.12–0.55), moderate liver injury (IRR, 0.56; 95% CI, 0.47–0.65), severe liver injury (IRR, 0.50; 95% CI, 0.29–0.81), and the occurrence of liver cirrhosis and liver failure (IRR, 0.29; 95% CI, 0.21–0.38) [176]. Another study by Hsiang et al. [177] reported that statin treatment is associated with a lower risk of HCC development (weighted sub-HR, 0.68; 95% CI, 0.48–0.97; P=0.033). Another nationwide cohort study reported that statin use significantly lowered the incidence of cirrhosis (RR, 0.433; 95% CI, 0.344–0.515; P<0.001) and decompensated cirrhosis (RR, 0.468; 95% CI, 0.344–0.637; P<0.001) compared to that of a non-statin group [178].
Statins might be associated with a sustained virologic response (SVR) in patients with HCV. Patients treated with statins showed higher SVRs (OR, 1.44; 95% CI, 1.29–1.61; P<0.0001) and decreased progression of liver fibrosis and incidence of HCC among CHC patients who received pegylated IFN-based HCV treatment for ≥14 days [173]. Other retrospective studies also showed that statin treatment is associated with the decreased risk of fibrosis and cirrhosis progression in patients with HCV (Table 5) [179-181].
Despite the positive results in patients with HBV or HCV, the clinical relevance of statins might be limited mainly due to the weakness of a retrospective study design. Therefore, it is premature to routinely prescribe statins for clinical benefit before well-designed prospective studies are available.
Liver cirrhosis
Two RCTs showed that simvastatin significantly reduced the hepatic venous pressure gradient (HVPG) and improved hepatic perfusion in patients with cirrhosis [182,183]. In another RCT, simvastatin failed to reduce the risk of rebleeding (HR, 0.858; 95% CI, 0.455–1.620; P=0.583) but prolonged survival (HR, 0.387; 95% CI, 0.152–0.986, P=0.030) in cirrhotic patients with variceal bleeding [184]. A retrospective study reported that statin use was associated with lower risks of mortality and decompensation (Table 5) [185].
Statins have potential beneficial effects in cirrhosis patients, but their long-term beneficial effects are limited. In addition, safety is also a concern, especially in patients with cirrhosis. Further prospective long-term follow-up data are required to confirm the beneficial effect of statins in patients with cirrhosis.
Safety
There are several concerns surrounding the adverse effects of statins, which include myopathy, a risk of type 2 diabetes development, deterioration of neurological and neurocognitive conditions, renal toxicity, and hepatotoxicity [186]. Aminotransferase elevation was found in up to 2% of patients in early clinical trials [187]. The mechanism of statin-induced hepatotoxicity is not clearly defined: mitochondrial dysfunction by oxidative stress, increase of ROS synthesis, immune-allergic reactions, and lactic acidosis may be potential mechanisms (Fig. 2C) [188]. However, most cases of aminotransferase elevation are mild and transient. Although the increase in liver enzyme levels depends on the statin dose, the incidence of AST or ALT level >3 times of the upper normal range is 0–1.8%, and clinically significant acute liver injury or fulminant hepatic failure is very rare [189]. In a previous study of patients with cirrhosis, two cases of severe rhabdomyolysis (2.8%) developed in the simvastatin group [184]. As even a small dose of statin than the usual dose can lead to adverse events, including rhabdomyolysis, in patients with decompensated cirrhosis, the administration of statins to patients with decompensated cirrhosis or acute liver failure should be avoided. Further studies for determining the safety dose of statin are required in patients with advanced liver disease.
PROBIOTICS
Mechanism of action
The gut microbiota has been considered a novel environmental factor involved in the pathophysiology of liver diseases [190]. A growing body of evidence points towards the suggestion that intestinal dysbiosis contributes to impaired barrier function of the intestinal mucosa [191]. Enhanced intestinal permeability allows bacterial metabolites such as LPS to reach the liver [192,193]. LPS trigger inflammation and insulin resistance by activating toll-like receptor (TLR)-4 and initiating pro-inflammatory cascades [194]. Overall, intestinal dysbiosis, bacterial translocation, and TLR-4 activation lead to increased hepatic fat accumulation, prompting the development of NAFLD and progression to NASH [195].
Modulation of the gut microbiota would represent an attractive target for therapeutic interventions in NAFLD subjects. In vivo studies have demonstrated the therapeutic effects of probiotics on NAFLD (Fig. 2D) [25]. In high-fat diet-fed murine models, probiotics induce Bifidobacterium abundance and a more beneficial composition of gut microbiota [196]. Ingestion of Lactobacillus also ameliorates the progression of NAFLD in murine models with a Western diet [197].
In terms of the gut-liver-brain axis, conditions of altered communication between the gut microbiota and the brain, such as dysbiosis, leaky gut, metabolic endotoxemia, and brain changes, may induce the development of HE in patients with liver cirrhosis [190,198]. Conversely, probiotics can reduce ammonia absorption by decreasing the urease activity of gut bacteria in the intestinal lumen and the intestinal pH [199].
Clinically beneficial effects
NAFLD
Probiotics are live bacteria that intend to improve the “good” gut microbiota by competitive colonization and acidification of the intestinal lumen [200]. Lactobacillus and Bifidobacterium are the most commonly used species in probiotics. Seven representative RCTs have investigated the therapeutic effect of probiotics in patients with NAFLD (Table 6) [201-207]. Although heterogeneities exist in terms of the dosing and type of probiotics and the treatment period in these RCTs, probiotic intervention could be related to diminishing liver steatosis assessed by imaging modalities compared to placebo [202,204-207]. In addition, improvements in several biochemical markers, including ALT, AST, and GGT, and metabolic profiles such as total and LDL cholesterols were also observed in probiotic groups [201-207]. Unfortunately, these studies included small numbers of patients, and few of them examined the effect of probiotics on histologic markers of NASH.
Synbiotics are a combination of advantageous gut bacteria (probiotics) and non-digestible fibers that help good bacteria to grow (prebiotics). Most RCTs evaluating the effect of synbiotics in NAFLD demonstrated significant reductions in liver enzymes and steatosis as measured by ultrasound [13,30,208-211]. Interestingly, an European RCT including 75 patients with NASH fed a low-fat/low-calorie diet reported that end-of-study liver stiffness as measured by transient elastography was significantly lower in patients treated with 12 weeks of synbiotics compared to the control group (mean, 5.2±0.2 vs. 5.9±0.2 kPa; P<0.05), with significant differences in the serum cholesterol (mean, 5.4±0.2 vs. 6.0±0.2 mmol/L; P<0.05) and BMI (mean, 21.1±0.6 vs. 23.9±0.6 kg/m2; P<0.05) [210]. Synbiotic supplementation was also associated with a greater reduction in fibrosis among Iranian lean NAFLD subjects who underwent lifestyle modification (mean change±standard error, -1.71±0.25 vs. -0.71±0.18 kPa; P<0.001) [208]. A recent U.K. phase II RCT showed that the administration of synbiotics without lifestyle intervention altered the fecal microbiome, with increased proportions of Bifidobacterium and Faecalibacterium and reductions in Oscillibacter and Alistipes, compared with baseline [33]. However, such did not significantly improve magnetic resonance imaging–based liver fat content or indirect markers of liver fibrosis. Finally, a recent meta-analysis involving 28 clinical trials enrolling 1,555 patients with NAFLD revealed that syn-/probiotic therapy had beneficial effects on BMI (mean difference, -1.46; 95% CI, -2.44 to -0.48; I2=97%; P<0.001), ALT (mean difference, -13.40; 95% CI, -17.03 to -9.77; I2=94%; P<0.001), AST (mean difference, -13.54; 95% CI, -17.86 to -9.22; I2=96%; P<0.001), HOMA-IR (mean difference, -0.42; 95% CI, -0.73 to -0.12; I2=79%; P=0.007), and total cholesterol (mean difference, -15.38; 95% CI, -26.50 to -4.25; I2=93%; P=0.007) levels [212].
Collectively, probiotic supplementation can be used as a complementary approach for managing patients with NAFLD, especially in combination with lifestyle interventions. However, the identification of appropriate bacterial strains and proper duration of treatment as well as potential interactions with other targeted agents require further investigation.
Liver cirrhosis
Data exist on the beneficial role of probiotics in treating patients with liver cirrhosis, especially HE. The effect of probiotics in secondary prophylaxis was evaluated in an RCT involving 130 Indian patients who had recovered from HE [213]. The probability of hospitalization for HE was significantly lower in patients treated with 6 months of probiotics compared to others (19.7% vs. 42.2%; HR, 0.45; 95% CI, 0.23–0.87; P=0.02). Significant improvements in CTP score and MELD scores from baseline were observed only in the probiotic group (median [interquartile range]: 8.81 [7.98–9.64] to 7.19 [6.63–7.75], P<0.001 for CTP score; 17.00 [13.60–20.40] to 13.25 [11.88–14.62], P<0.26 for MELD score). Another Indian RCT including 160 patients with minimal HE indicated that probiotics could effectively prevent overt HE (1.2% vs. 19%; HR for control vs. probiotic group, 2.1; 95% CI, 1.31–6.53; P<0.05) [214]. A recent meta-analysis including 14 trials compared probiotics to placebo/no treatment in patients with HE demonstrated that the probiotics group had a significant lower prevalence of incomplete resolution of HE (RR, 0.67; 95% CI, 0.56–0.79) and development of overt HE (RR, 0.29; 95% CI, 0.16–0.51) [215]. The plasma ammonia level was also lower for probiotics-treated patients (mean difference, -8.29 μmol/L; 95% CI, -13.17 to -3.41). However, no difference in mortality was observed (RR, 0.58; 95% CI, 0.23–1.44). Overall, all these studies hold the promise that manipulation of intestinal microbiota may be helpful for the management of HE.
Safety
Probiotics and synbiotics are inexpensive nutritional supplements that are widely available worldwide. Although most clinical trials focused on the beneficial effect of probiotics rather than their safety [216], probiotics may be safe in immunocompetent adults based on a history of safe use of probiotics in foods. However, probiotics have been associated with a higher risk of bacterial or fungal infection in neonates, infants, and critically ill patients [217,218]. In terms of patients with liver disease, all studies reviewed here reported no significant safety issues with the clinical use of supplementation with probiotic microorganisms in this setting.
VITAMIN E
Mechanism of action
Vitamin E (tocopheraol) shows antioxidant activity by scavenging ROS and nitrogen species [219]. Vitamin E also increases the action of antioxidative enzymes like superoxide dismutase, catalase, and glutathione peroxidase (Fig. 1) [220,221]. In addition to its antioxidative effect, vitamin E has anti-fibrotic, anti-inflammatory, and anti-apoptotic effects [222-224]. Vitamin E supplementation inhibits the activation and proliferation of HSCs in acute damage by CCl4 [224]. Vitamin E shows an anti-inflammatory effect through inhibiting cyclo-oxygenase-2 and 5-lipoxygenase–mediated eicosanoids and suppressing NF-κB and Janus kinase (JAK)-signal transducer and activator of transcription protein (STAT) 6 or JAK/STAT3 pathways [222]. Vitamin E also inhibits apoptosis by decreasing the proapoptotic proteins [223].
Clinically beneficial effects
NAFLD
In NAFLD, oxidative stress plays a crucial role in the progression to NASH [225]. Therefore, vitamin E, an antioxidant, has recently been studied a lot in NAFLD. These studies varied in the duration (3 months to 2 years) and dose (100–800 IU/mL) of vitamin E used and are summarized in Table 7. Vitamin E monotherapy or in combination with other agents significantly improved liver enzymes [34,87,226-231]. In an RCT comparing pioglitazone, vitamin E, and placebo, ALT was significantly decreased in the vitamin E treatment group compared to placebo (mean, -37.0 vs. -20.1; P=0.001) [14]. Vitamin E treatment significantly improved the hepatic steatosis assessed by ultrasound compared to placebo (34.9% vs. 18.2%; P=0.038) [226]. Pervez et al. [230] reported that vitamin E supplementation for 12 weeks significantly reduced the fatty liver index (FLI) score compared to placebo (mean change, -12.82 vs. -3.86; P<0.001). Aller et al. [232] showed that treatment with a combination of vitamin E and silymarin for 3 months significantly decreased the FLI (from 86.2 to 76.9; P<0.05). Vitamin E treatment also improved parameters of the fibrotic burden, as reflected by non-invasive fibrosis surrogates, such as the ratio of AST to platelets score (mean, 0.55 to 0.4; P<0.001) [34] and NAFLD fibrosis score (mean, -1.6 to -2.1; P<0.05) [232]. Vitamin E treatment also decreased inflammatory cytokines (IL-6 change: mean, -3.42 vs. -1.56 pg/mL; P<0.001 and TNF-α change: mean, -3.26 vs. -1.15 pg/mL; P=0.001) [230] or chemokines (CCL-2/monocyte chemo-attractant protein 1: from mean 289 to 131; P<0.05) [227] and improved insulin resistance (HOMA-IR change: mean, -0.52 vs. -0.13; P<0.001) [230]. In addition, vitamin E treatment with other agents improved the serum level of adipokine, increasing adiponectin (mean change, +3,808 in UDCA/vitamin E vs. -1,626 in UDCA/placebo vs. -687 ng/mL in placebo/placebo; P<0.03) [55] and decreasing leptin (mean change, -0.48 vs. 2.54; P<0.05) concentrations [231].
There have been studies showing that vitamin E treatment led to histologic improvement in NAFLD. Harrison et al. [233] reported that treatment with a combination of vitamin E (1,000 IU/day) and vitamin C (1,000 IU/day) for 6 months significantly improved the hepatic fibrosis score (P=0.002) in histologically proven NASH, while there was no significant change in inflammation score (P>0.05). Dufour et al. [54] showed that treatment with a combination of vitamin E (800 IU/day) and UDCA (12–15 mg/kg/day) for 6 months significantly improved hepatic steatosis (P<0.05), while there was no significant change in inflammation or fibrosis. In the PIVENS (Pioglitazone, Vitamin E, or Placebo for Nonalcoholic Steatohepatitis) trial of pioglitazone or vitamin E for the treatment of biopsy-confirmed NASH patients without diabetes, vitamin E treatment (800 IU/day) for 96 weeks, compared to placebo, significantly improved the inflammation (43% vs. 19%; P=0.001) [14]. Histologic analysis revealed that vitamin E treatment, compared to placebo, reduced the steatosis (54% vs. 31%; P=0.005), lobular inflammation (54% vs. 35%; P=0.02), and hepatocellular ballooning (50% vs. 29%; P=0.01), but fibrosis was not significantly improved (41% vs. 31%; P=0.24) [14]. Based on the PIVENS trial, guidelines for NAFLD of major societies recommend vitamin E as a treatment in non-diabetic adults with biopsy-proven NASH [4,234-236]. Recently, Bril et al. [237] also reported that vitamin E (800 IU/day) for 18 months achieved a resolution of NASH (33% vs. 12%; P=0.04) compared to placebo in adult patients with diabetes and biopsyproven NASH. In this study, the improvement of fibrosis was not statistically significant (50% vs. 30%; P=0.09), but it showed a trend toward a higher rate in vitamin E treatment [237].
A meta-analysis of histological changes after vitamin E treatment in adult NASH patients revealed significant improvements in steatosis, lobular inflammation, and hepatocellular ballooning [238,239]. However, the results of meta-analyses on fibrosis changes after vitamin E were not consistent. Said and Akhter [239] reported that vitamin E treatment did not significantly improve fibrosis (P=0.09), while Vadarlis et al. [238] reported that vitamin E treatment significantly improved fibrosis (P=0.005). Meanwhile, a network analysis of studies that assessed the effect of different pharmacological interventions on NASH demonstrated that vitamin E achieved a significant fibrosis improvement compared to placebo (OR, 1.72; 95% CI, 1.04–2.85) [240]. Therefore, vitamin E may be an effective treatment in biopsy-proven NASH by improving the steatosis and inflammation. Considering the conflicting results on fibrosis, however, further studies are needed to determine whether vitamin E would improve hepatic fibrosis.
Viral hepatitis
HCV infection is associated with systemic oxidative stress, which is characterized by increased ROS and nitrogen species and decreased antioxidants [241]. Oxidative stress in HCV patients occurs in the early phase of disease [241,242] and is associated with the progression of fibrosis and development of HCC [242,243]. Because of the association between HCV infection and oxidative stress, vitamin E has been studied in HCV patients as an antioxidant (Table 7). In a double-blinded RCT with HCV patients refractory to IFN-α therapy by von Herbay et al. [244], vitamin E treatment (800 IU/day) for 12 weeks significantly lowered serum ALT levels (mean ALT change, -22 vs. +1; P<0.001) compared to placebo. Malaguarnera et al. [245] showed that addition of a complex of antioxidants, including vitamin E (15 mg/day), silybin (47 mg/day), and phospholipids (97 mg/day), to IFN-α2b plus ribavirin led to a significantly greater reduction in viral load (mean, -3.65×10⁶ vs. -2.16×10⁶ IU/mL; P<0.05) and serum levels of hepatic fibrosis markers, such as TGF-β (mean, -21.4 vs. -6.6 ng/mL; P<0.05), pro-collagen III N-terminal peptide (mean, -10.4 vs. -4.9 ng/mL; P<0.05), and tissue inhibitor of metalloproteinase 1 (mean, -169.6 vs. -66.2 ng/mL; P<0.001). Marotta et al. [246] showed that vitamin E treatment in HCV-related cirrhosis patients improved parameters of the redox status, such as glutathione, glutathione disulfide (GSSG), glutathione/GSSG, and malondialdehyde (all P<0.005). However, other studies failed to reveal an improvement in serum ALT level [247-249] or viral load [248]. Furthermore, cessation of vitamin E treatment was followed by a rapid relapse of ALT elevation and viremia [244,250].
Most of the studies on the effects of vitamin E in HCV patients were conducted during a period in which IFN-α treatment was the standard treatment for HCV, and their results are also inconsistent. In recent years, as DAAs, which are very effective treatments, have become the standard therapeutic approach for HCV, further studies are needed on the role of vitamin E treatment in HCV patients in the DAA era.
Studies on the effectiveness of vitamin E treatment in HBV patients are very rare. Andreone et al. [251] reported that ALT normalization (47% vs. 6%; P=0.011) and a complete response (47% vs. 0%; P=0.0019) were achieved at a significantly higher rate following vitamin E treatment (600 IU/day) for 3 months compared to in the control group among patients with a positive HBV DNA status and heightened ALT levels.
Vitamin E treatment decreased the serum aminotransferase level and improved inflammatory cytokine, chemokine, and adipokine concentrations in NAFLD patients with its antioxidant and anti-inflammatory properties. In addition, vitamin E treatment not only led to histological improvement in hepatic steatosis, lobular inflammation, and ballooning but also showed a potential to improve hepatic fibrosis in histologically proven NASH patients. Therefore, vitamin E may be an alternative treatment option for NASH patients who have no effective treatment other than weight loss. On the other side, the usefulness of vitamin E has been reduced due to the use of effective antiviral agents in chronic viral hepatitis, and further studies are necessary on the role of vitamin E treatment.
Safety
There are concerns about the long-term safety of vitamin E treatment. Some studies reported that vitamin E treatment is associated with an increase in overall mortality [252,253], prostate cancer [254], and hemorrhagic stroke [255]. In a meta-analysis of preventive studies of antioxidant supplements, vitamin E (duration, 0.5–6.3 years; dose, 16.5–800 IU/day) was significantly associated with increased mortality (RR, 1.04; 95% CI, 1.01–1.07) [253]. In another meta-analysis of trials, high-dose vitamin E (≥400 IU/day) for >1 year led to an increased risk for all-cause mortality (P=0.022), and there was a significant relationship between vitamin E dosage and all-cause mortality (P=0.027) [252]. In a prospective study comparing the long-term effect of selenium (200 μg/day), vitamin E (400 IU/day), selenium plus vitamin E, and placebo, vitamin E treatment (follow-up period, 7–12 years) increased the risk of prostate cancer compared to placebo (HR, 1.17; 99% CI, 1.004–1.36; P=0.008) [254]. A meta-analysis of RCTs with ≥1 year of followup investigating the effect of vitamin E (50–800 IU/day) on stroke showed that vitamin E increased the risk for hemorrhagic stroke (RR, 1.22; 95% CI, 1.00–1.48; P=0.048) [255]. Therefore, long-term use of vitamin E should be avoided.
ASPIRIN
Mechanism of action
Following tissue injury, platelet activation and degranulation mediate the normal physiological tissue repair process. However, in chronic inflammation, over-activation of the platelet can cause fibrosis in various tissues [256]. In the liver, platelets could directly activate HSCs [257] or could interact with many effector cells, such as macrophages, cytotoxic T-cells, and natural killer T (NKT) cells, eventually causing hepatic fibrosis [258]. Aspirin could prevent hepatic fibrosis progression and HCC directly by blocking platelet function (Fig. 1).
Extrahepatic platelet–derived growth factor β produced by platelets may have directly activated HSCs in a biliary fibrosis model [257]. Platelet number and activation were increased in a NASH model. In the same study, a platelet receptor subunit, glycoprotein 1b alpha (GP1bα), was an important mediator in NASH. The combination of GP1bα, hyaluronic acids, cytokines, and chemokines mediates the immune response, causing progression to NASH and HCC [259]. The crosstalk between cytotoxic T-cells, NKT cells, and hepatocytes can cause liver disease progression. Hepatocyte-driven lymphotoxin β receptor and NF-κB signaling could trigger NASH to HCC progression [258]. Prolyl 4-hydroxylase subunit α2 inhibition by aspirin could also decrease collagen deposition and HCC development [260].
In a viral hepatitis model, platelets mediated cytotoxic T-cell-mediated liver damage. Aspirin treatment reduced the platelet activation, and intrahepatic cytokine release related in the inflammation process [27]. Aspirin treatment also reduces the homing and accumulation of virus specific cytotoxic Tcells as well as virus-non-specific lymphocytes in the liver [261].
Clinically beneficial effects
NAFLD
A nationwide cross-sectional study in the United States showed that regular aspirin use was associated with a lower prevalence of NAFLD itself (HR, 0.62; 95% CI, 0.51–0.74, P=0.04) (Table 8) [262]. A prospective cohort study with biopsyconfirmed NAFLD patients showed that aspirin use reduced the risk of advanced fibrosis (HR, 0.63; 95% CI, 0.43–0.85) [263]. Another cross-sectional study using nationwide health survey data from the United States showed that regular aspirin use was associated with a decreased risk of liver fibrosis in CLD patients confirmed by ultrasonography (β-coefficients measured at 0.24 standard deviations lower; 95% CI, -0.42 to -0.06; P=0.009) [256]. To date, two studies have shown the association between aspirin use and the risk of HCC development. In a pooled analysis of 10 prospective cohort studies in the United States, aspirin led to a 32% decrease in HCC development (HR, 0.68; 95% CI, 0.57–0.81) [264]. Meanwhile, in another pooled analysis of two prospective cohort studies in the United States, aspirin caused a 46% decrease in HCC development (HR, 0.54; 95% CI, 0.36–0.80) [265]. Although both pooled analysis studies did not specify the etiology of liver disease, it is assumed that NAFLD may be the major etiology of liver disease.
In NAFLD patients, aspirin use was associated with various outcomes, such as prevalence, fibrosis, and HCC development. However, there are still very few studies considering the outcomes of aspirin use in NAFLD. Since it is difficult to perform randomized controlled studies with aspirin, there is an unmet need for more cohort studies involving NAFLD patients.
Viral hepatitis
Most studies performed in viral hepatitis analyzed HCC development as primary outcome (Table 8). A recent metaanalysis of seven studies that studied CHB or CHC patients showed a 27% decrease in HCC development [266]. A prospective study using Swedish nationwide registry data including CHB or CHC patients with median 7.9 years of follow-up revealed a 31% decrease in HCC development in the aspirin group (HR, 0.69; 95% CI, 0.62–0.76). The reduction in HCC development was duration-dependent [15]. The authors also evaluated survival data and showed a 27% reduction in liver-related death in the aspirin treatment group (HR, 0.73; 95% CI, 0.67–0.81) [15]. In addition, several population-based studies have been made available, mostly enrolling the Asian population. A Korean study using nationwide reimbursement data showed an 8% decrease in HCC development (OR, 0.92; 95% CI, 0.85–0.99) [267]. Two Taiwan studies using nationwide reimbursement data revealed a 29% decrease (HR, 0.71; 95% CI, 0.58–0.86; P<0.001) and a 22% decrease (HR, 0.78; 95% CI, 0.64–0.95; P=0.011), respectively, in HCC development in CHB and CHC patients [268,269]. Another Taiwan study using nationwide reimbursement data compared aspirin using CHC patients matched 1:1 with aspirin non-using CHC patients. The result included a 44% rate of HCC reduction (HR, 0.56; 95% CI, 0.43–0.72; P<0.001) [270]. A Hong Kong study using a nationwide electronic healthcare data repository analyzed antiviral-treated CHB patients and showed a 40% decrease in HCC development (HR, 0.60; 95% CI, 0.46–0.78, P<0.001) [271].
In addition, several studies have shown the beneficial effects of aspirin use in prolonging OS in HCC patients treated with transarterial chemoembolization and curative resection [272,273]. In addition, it has been revealed that aspirin use can reduce HCC recurrence in several clinical settings [272,274,275].
Collectively, in patients with viral hepatitis, aspirin seems to reduce the risk of HCC development. However, few studies have adopted liver fibrosis or OS as their primary endpoints, and most studies have enrolled population-based cohorts. Accordingly, further prospective studies based on hospital data with varying endpoints are warranted for solid validation.
Safety
The safety concern related to aspirin therapy is mainly gastrointestinal bleeding. Most studies did not report an increased risk of gastrointestinal bleeding in the aspirin group [15,269,276]. However, one study reported increased peptic ulcer bleeding in cirrhosis patients with aspirin use compared to aspirin-untreated patients [268]. Another study reported increased gastrointestinal bleeding in patients only with shortterm aspirin use [271].
CONCLUSION
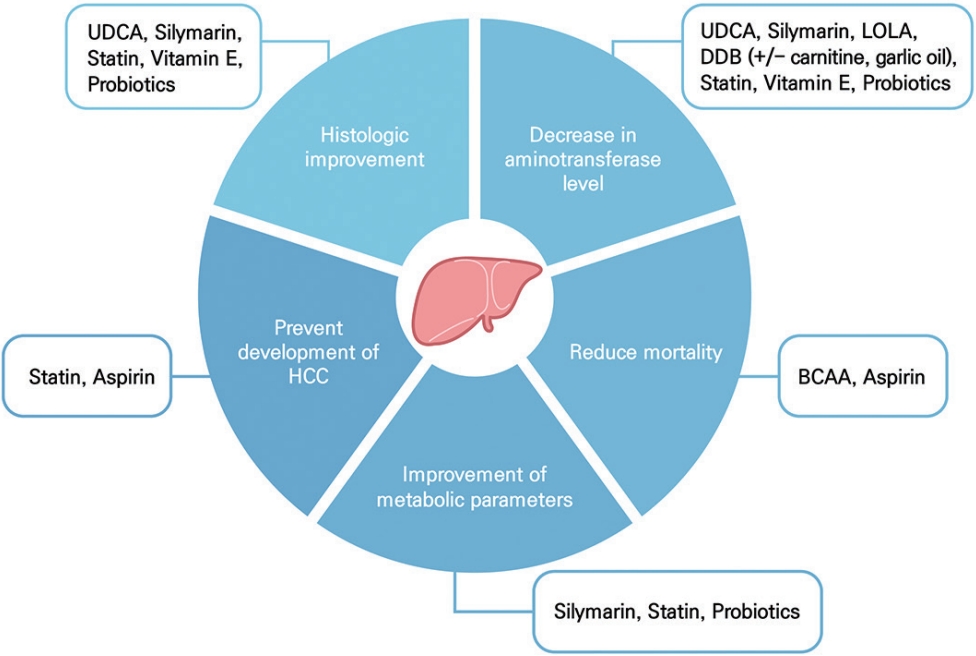
In this review, we summarized the mechanisms of several non-antidiabetics and their evidence regarding a beneficial effect in patients with CLD. Although the evidence is not sufficiently solid, the different nonanti-diabetics showed beneficial effects in improving histology, aminotransferase level, metabolic parameters, and the risk of long-term outcomes in patients with CLD without significant safety concerns (Fig. 3). However, further studies are still warranted to consolidate their potential benefit in adjuvant or combination settings in the era of potent antiviral therapy.
 PDF Links
 PubReader
 ePub Link
 Full text via DOI
 Full text via PMC
 Download Citation
 Print
Print