Multiomics profiling of buffy coat and plasma unveils etiology-specific signatures in hepatocellular carcinoma
Article information

Abstract
Background/Aims
Hepatocellular carcinoma (HCC) is a leading cause of cancer mortality worldwide. Despite identification of several biomarkers for HCC diagnosis, challenges such as low sensitivity and intratumoral heterogeneity have impeded early detection, highlighting the need for etiology-specific blood biomarkers.
Methods
We generated whole-transcriptome sequencing (WTS) and targeted proteome data from buffy coat and plasma samples from HCC patients. By integrating etiological information on viral infection, we investigated the etiology-specific gene expression landscape at the blood level. Validation of differentially expressed genes (DEGs) was performed using publicly available RNA-seq datasets and qRT‒PCR with AUC analyses.
Results
Differential expression analyses with multiomics data revealed distinct gene expression profiles between HBV-associated HCC and nonviral HCC, indicating the presence of etiology-specific blood biomarkers. The identified DEGs were validated across multiple independent datasets, underscoring their utility as biomarkers. Additionally, single-cell RNA-seq analysis of HCC confirmed differences in DEG expression across distinct immune cell types.
Conclusions
Our buffy coat WTS data and plasma proteome data may serve as reliable sources for identifying etiology-specific blood biomarkers of HCC and might contribute to discovery of therapeutic targets for HCC across different etiologies.
Graphical Abstract
INTRODUCTION
Hepatocellular carcinoma (HCC) is the fourth leading cause of cancer mortality worldwide [1]. HCC etiologies are classified into viral infection and nonviral causes [2]. Hepatitis B virus (HBV) is the main viral risk factor for HCC; nonviral causes include alcohol consumption and nonalcoholic fatty liver disease [2]. Most HCC patients are diagnosed at an advanced stage, for which curative treatments are limited [3]. Thus, proper HCC surveillance is important for early detection of HCC, which can lead to improved outcomes.
Diagnostic methods such as biopsy and imaging techniques combined with serum alpha-fetoprotein (AFP) level assessment have been frequently used in clinical practice but have several limitations, including low sensitivity and false positivity [4,5]. Additionally, HCC is characterized by vast intertumoral heterogeneity induced by diverse etiologies and intratumoral heterogeneity owing to the tumor microenvironment [2,6]. These limitations have emphasized the need for blood-based biomarkers to improve early detection of HCC, with a cell-free DNA signature and the combination of protein induced by vitamin K absence II (PIVKA-II) and AFP as potential biomarkers [7,8].
Gradient centrifugation separates blood into erythrocytes, the buffy coat, and plasma. The buffy coat is enriched in platelets and white blood cells, including peripheral blood mononuclear cells (PBMCs). PBMCs and plasma have been widely used for identification of blood-based biomarkers via transcriptomic and proteomic profiling [9,10], including several blood-based HCC biomarkers [11,12]. However, many limitations remain to be overcome, such as HCC heterogeneity caused by different etiologies [13]. Moreover, several studies have focused on transcriptome profiling using buffy coats to uncover altered gene signatures under disease conditions, including breast cancer and COVID-19 [14,15]. Buffy coat analysis enables understanding whole-cell responses in peripheral blood against specific diseases, overcoming the limitation of exclusion of several cell types, such as granulocytes and circulating tumor cells, among PBMCs [16,17]. However, buffy coat profiling of HCC blood-based biomarkers, particularly those related to HCC etiology, has not yet been conducted.
Hence, we aimed to identify etiology-specific blood biomarkers of HCC utilizing whole-transcriptome sequencing (WTS) and targeted proteome data from buffy coat and plasma samples obtained from HCC patients with diverse etiologies. We classified HCC patients into HBV-associated HCC (HBV-HCC) and nonviral-associated HCC (NV-HCC) groups according to etiology information. Compared to those of non-HCC samples, we investigated the etiology-specific gene expression landscape of HCC at the blood level via validation with publicly available RNA-seq datasets and qRT‒PCR data from our buffy coat samples. We expect that our established multiomics dataset will serve as a reliable and reproducible source for identifying etiology-specific blood biomarkers of HCC and help in discovering potential therapeutic targets for HCC across different etiologies.
MATERIALS AND METHODS
Patient enrollment
Blood samples and data were obtained from the Biobank of Ajou University Hospital, Suwon, South Korea, between January 2017 and August 2023. All experiments in this study were conducted in accordance with the ethical guidelines of the 1975 Declaration of Helsinki. The study protocol was approved by the Institutional Review Board of Ajou University Hospital, Suwon, South Korea (AJOUIRB-EXP-2020-007). The requirement for informed consent was waived.
Blood sample preparation
Peripheral blood was collected from each individual directly into EDTA-containing tubes. The blood was centrifuged at 2,000×g for 5 minutes at 4°C, and the plasma or buffy coat was retained and aliquoted. Total RNA was isolated from buffy coats (300 μL) using TRIzol-LS (Invitrogen, Waltham, MA, USA) and purified using an RNeasy Mini kit (Qiagen, Hilden, Germany) according to the manufacturer’s instructions. The RNA concentration and integrity were measured by an Agilent 2100 bioanalyzer (G2939A; Agilent Technologies, Santa Clara, CA, USA).
Whole transcriptome sequencing of buffy coat samples
The total RNA concentration was calculated by Quant-IT RiboGreen (Invitrogen, #R11490). The integrity of the total RNA was assessed with a TapeStation RNA ScreenTape (Agilent, #5067-5576). Only high-quality RNA preparations with RIN greater than 7.0, were used for library construction. A library was independently prepared with an Illumina TruSeq Stranded Total RNA Library Prep Globin Kit (Illumina, San Diego, CA, USA, #20020613). Next, rRNA was removed using a Ribo-Zero rRNA Removal Kit (Human/Mouse/Rat Globin) (Illumina). The cleaved RNA fragments were converted to first-strand cDNA using SuperScript II reverse transcriptase (Invitrogen, #18064014) and random primers, followed by second-strand cDNA synthesis using DNA Polymerase I, RNase H and dUTP. The products were then purified and enriched via PCR to create the final cDNA library. The libraries were quantified using KAPA Library Quantification kits according to qPCR Quantification Protocol Guide (KAPA BIOSYSTEMS, #KK4854) and qualified using TapeStation D1000 ScreenTape (Agilent, #5067-5582). Indexed libraries were then subjected to an Illumina NovaSeq (Illumina) paired-end (2×100 bp) sequencing performed by Macrogen Incorporated.
Differential expression (DE) analyses of WTS data
The raw data (FASTQ) were imported into AltAnalyze software (v2.1.4), which uses the embedded software Kallisto and Ensemble72 annotations. Raw count values were obtained and used for DE analysis via R DESeq2 package (v1.34.0). Genes with a total read count less than 10 were excluded from further analysis. Differentially expressed genes (DEGs) were identified by pairwise comparison through DESeq2. Volcano plots were drawn using R EnhancedVolcano package (v1.12.0). Gene Ontology (GO) analysis was performed using R compareCluster function in clusterProfiler package (v4.2.2). The top 10 termsfrom either up-DEGs or down-DEGs are displayed in a dot plot.
DE analysis of validation datasets (VDs)
Bulk RNA-seq datasets of HCC PBMCs were downloaded from NCBI BioProject under accession codes PRJNA739257, PRJNA909469, and PRJNA717231. The raw data (FASTQ) were imported into AltAnalyze. Raw count values were obtained and used for DE analysis via R DESeq2 package. Genes with a total read count less than 1 were excluded from further analysis. The significance of differences in expression of buffy coat DEGs was validated at p.adj<0.05. Count values were obtained by plotCounts function in DESeq2 and visualized as haploid plots by ggplot and geom_boxjitter functions in R ggplot2 (v3.4.2) and ggpol (v0.0.7) packages.
Rank-rank hypergeometric overlap (RRHO)
Log2-fold change values were obtained from DESeq2 results. All genes annotated in the buffy coat WTS and validation datasets were ranked by log fold change. These ranked lists were further processed to include only genes common to both the buffy coat and each VD. These input files were loaded into a simple web-based version of RRHO (https://systems.crump.ucla.edu/rankrank/rankranksimple.php). The step size was set to 100 to generate a Benjamini-Yekutieli-corrected hypergeometric matrix and RRHO heatmaps.
Targeted proteome screening of plasma samples
Plasma protein levels were measured using the proximity extension immunoassay technology (Olink Proteomics, Uppsala, Sweden) and an Olinkâ Target 96 Immuno-Oncology (v.3113) panel [18]. To conduct DE analysis, Normalized Protein eXpression files, log2 scale values, were imported into R OlinkAnalyze package (v3.4.1). Differentially expressed proteins (DEPs) were identified by pairwise comparison through olink_ttest function in OlinkAnalyze package. Volcano plots were drawn using R EnhancedVolcano package.
Single-cell RNA-seq analysis of the validation dataset
Targeted single-cell RNA-seq datasets of HCC from BD Rhapsody Immune Response Targeted Panel (human) were downloaded from NCBI Gene Expression Omnibus under accession codes GSE179795 and GSE195648. Gene expression matrices containing distribution-based error correction-adjusted molecule counts were imported into R Seurat package (v4.3.0.1). Single-cell QC was performed filtering for a total of 1,500 reads. Batch-balanced KNN correction was conducted using R bbknnR package (v1.0.2). Cells expressing CD19 or CD14 were excluded for elimination of contaminating B cells and monocytes. Clustering was repeated after filtering contaminating cells. Cell types were annotated using canonical markers reported in several recent publications [19-23]. Violin plots were drawn using VlnPlot function in Seurat.
Quantitative reverse transcription PCR (qRT‒PCR)
mRNA expression levels in buffy coat samples were measured using qRT‒PCR. Buffy coat RNA was reverse transcribed to cDNA using SuperScript™ Ⅳ VILO™ Master Mix (Invitrogen). qRT‒PCR was performed using amfiSure qGreen Q-PCR Master Mix (GenDEPOT, Barker, TX, USA) with individual primer sets (Supplementary Table 1) and monitored in real time using CFX Connect Real-Time PCR System (Bio-Rad Laboratories, Hercules, CA, USA). Relative gene expression levels were calculated using the 2−ΔΔCt method, and GAPDH was used as the internal control. All measurements were performed in triplicate.
Area under the ROC curve (AUC) analysis
Receiver operating characteristic (ROC) analysis was performed using GraphPad Prism software (v10.0; GraphPad Software, San Diego, CA, USA), and the area under the ROC curve (AUC) was calculated, providing a quantitative measure of the overall diagnostic effectiveness. This analysis was complemented by 95% confidence intervals (CIs) for AUCs, offering a statistical range within which the true area under the curve is expected to lie and thereby indicating the precision of our assessment.
RESULTS
Study design
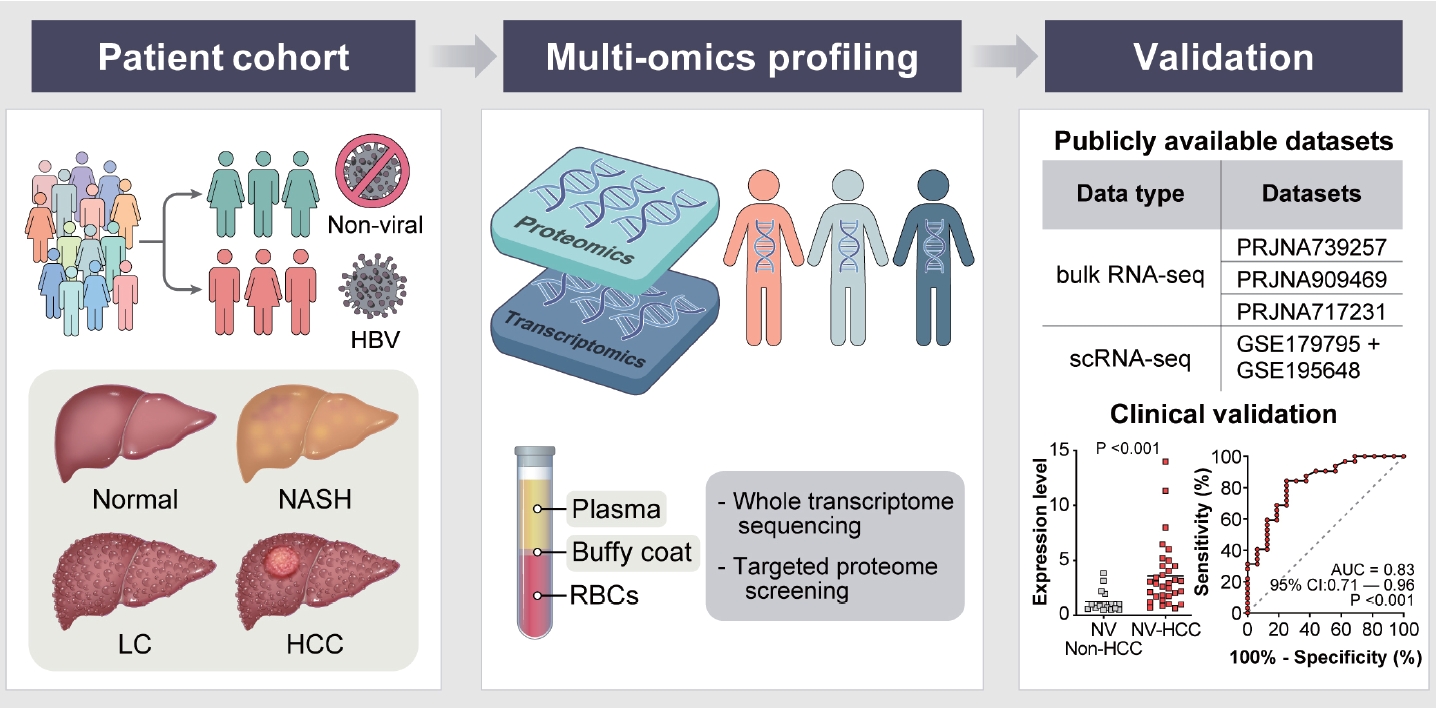
In our study, blood samples, along with etiology information, were obtained from healthy controls, nonalcoholic steatohepatitis patients, liver cirrhosis patients and HCC patients (Fig. 1, Supplementary Table 2). After centrifugation, buffy coat and plasma samples were obtained for WTS and targeted proteome screening, respectively. In the transcriptome analysis, buffy coat samples were divided into HCC and non-HCC groups; in the proteome analysis, plasma samples were classified into HCC and healthy groups. For identification of etiology-specific biomarkers, the samples were subdivided into viral (HBV) or nonviral groups according to their HBV infection status. Using three comparison sets, DE analyses were performed to identify etiology-specific DEGs and DEPs in HCC at the transcriptome and proteome levels. The identified DEGs were validated by analyzing publicly available bulk RNA-seq datasets of HCC PBMCs and performing qRT‒PCR of buffy coat samples with AUC analysis. Further validation was conducted at the single-cell level using publicly available targeted scRNA-seq datasets.
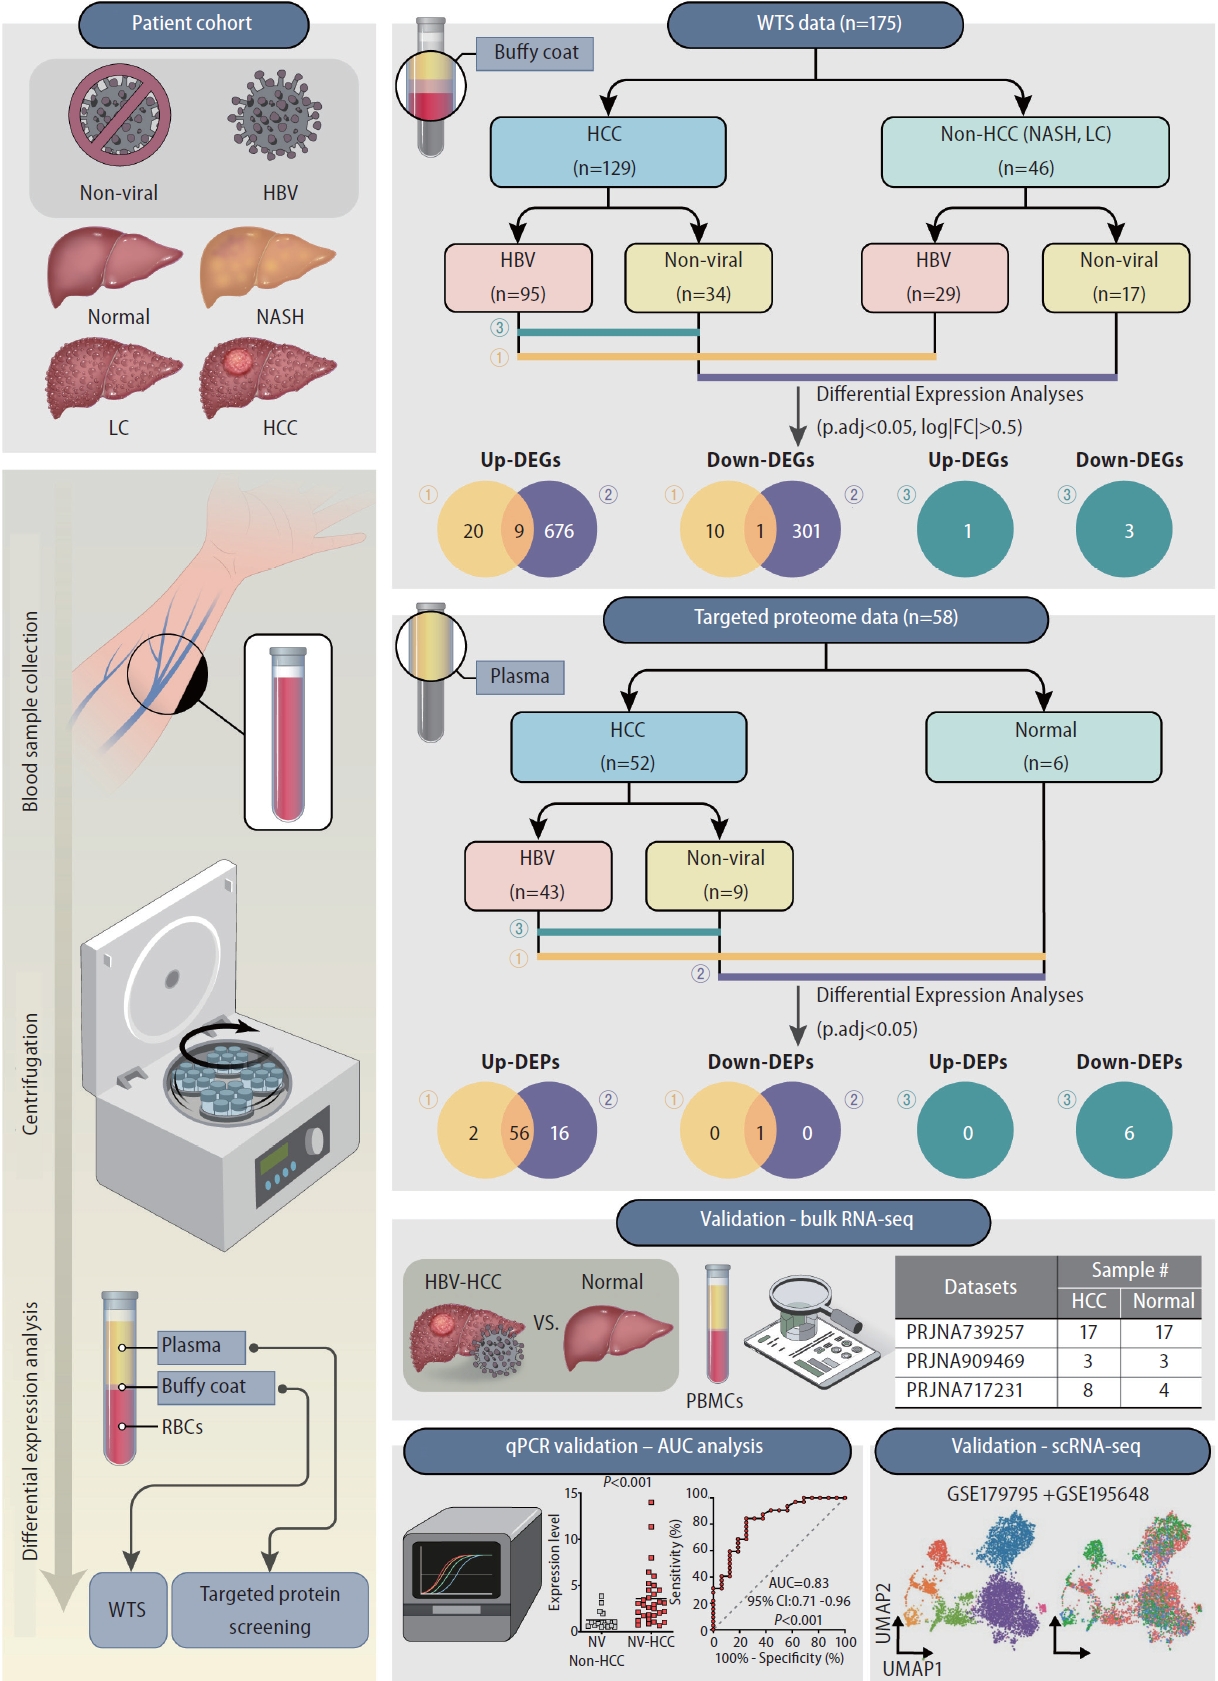
Schematics of the study design. Buffy coat and plasma samples extracted from healthy controls, nonalcoholic steatohepatitis (NASH) patients, liver cirrhosis (LC) patients and HCC patients were used for differential expression analyses. Buffy coats were used for wholetranscriptome sequencing (WTS); plasma was used for targeted proteome screening. All samples were assigned to HBV or nonviral groups according to etiology. Validation of DEGs was performed through publicly available bulk RNA-seq and scRNA-seq datasets and qRT-PCR with AUC analysis. HCC, hepatocellular carcinoma; HBV, hepatitis B virus; DEG, differentially expressed gene.
DE analyses of buffy coat WTS data
To identify etiology-specific HCC biomarkers in the buffy coat transcriptome, we performed DE analyses comparing HCC and non-HCC samples from both HBV and nonviral groups. We further performed DE analysis between HBV-HCC and NV-HCC patients (Fig. 2A). A total of 40 and 987 DEGs were identified in the HBV-HCC and NV-HCC samples, respectively, compared to the corresponding non-HCC samples (p.adj<0.05, log|FC|>0.5). To investigate the etiology-derived functional distinctions of the identified DEGs, we performed GO analysis of the significant DEGs in each comparison (p.adj<0.05) (Fig. 2B). In HBV-HCC, the significantly enriched GO terms are involved in immune responses, including regulation of the innate immune response and activation of immune cells. In contrast, the significantly enriched GO terms in NV-HCC are related to ATP metabolism and respiration. This tendency was corroborated by GO analysis between HBVHCC and NV-HCC, with up-DEGs in HBV-HCC enriched in the immune response pathway and down-DEGs enriched in metabolism (Fig. 2B). The significant DEGs (p.adj<0.05, log|FC|>0.5) in the buffy coat transcriptome analysis are summarized in Figure 2C; these DEGs were either etiology specific or HCC specific, regardless of etiology, with overlapping expression patterns in the two comparisons.
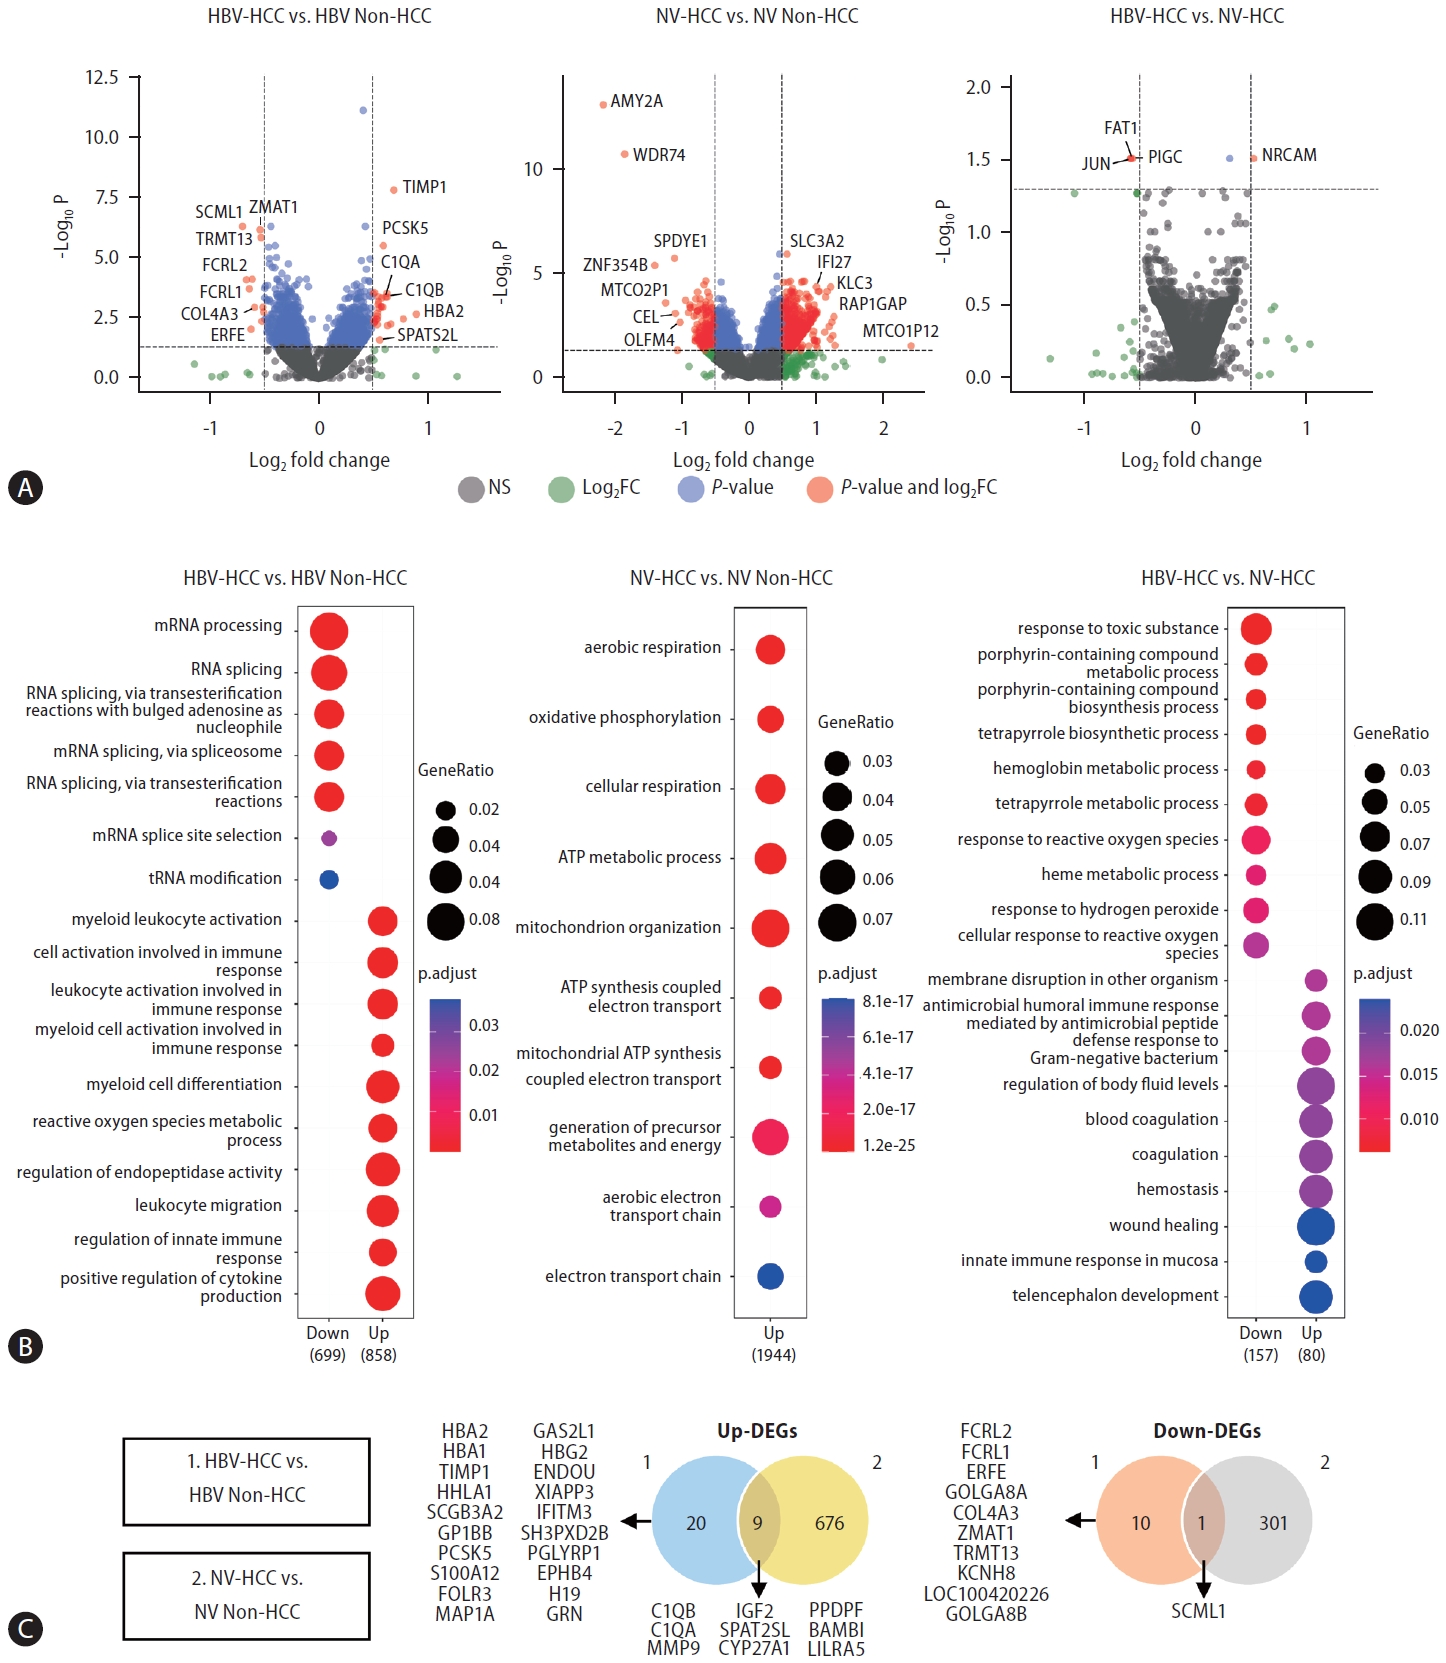
DE analysis between HCC and non-HCC samples of HBV-HCC and NV-HCC using WTS data derived from buffy coats. (A) Volcano plots visualizing significant DEGs. (B) GO results showing enriched biological processes of significant up-DEGs and down-DEGs. (C) Venn diagrams summarizing significant up-DEGs and down-DEGs. HBV, hepatitis B virus; HCC, hepatocellular carcinoma; NV, nonviral; WTS, whole-transcriptome sequencing; DEG, differentially expressed gene; GO, Gene Ontology.
Validation of buffy coat DEGs
To validate the reliability of our buffy coat transcriptome dataset, we utilized three publicly available RNA-seq datasets of HCC PBMCs. To our knowledge, buffy coat transcriptome data related to HCC have not yet been published. Hence, HCC PBMC datasets were used for validation of the DE results for buffy coats. This selection was motivated by the intrinsic proximity of PBMCs to the buffy coat, as PBMCs are conventionally derived from the buffy coat. In light of the limited number of publicly available HCC PBMC transcriptome datasets, with the majority lacking comprehensive etiology information on HCC development, we identified three independent bulk RNA-seq datasets of HCC PBMCs. Notably, all datasets included samples from both HBV-associated HCC patients and healthy individuals (Supplementary Table 3). Through RRHO analysis [24], we assessed the overlap intensity between our buffy coat transcriptome dataset and each VD. For VD1 and VD2, a significant overlap was observed, whereas VD3 was shown to have a poor correlation with the buffy coat dataset (Fig. 3A).
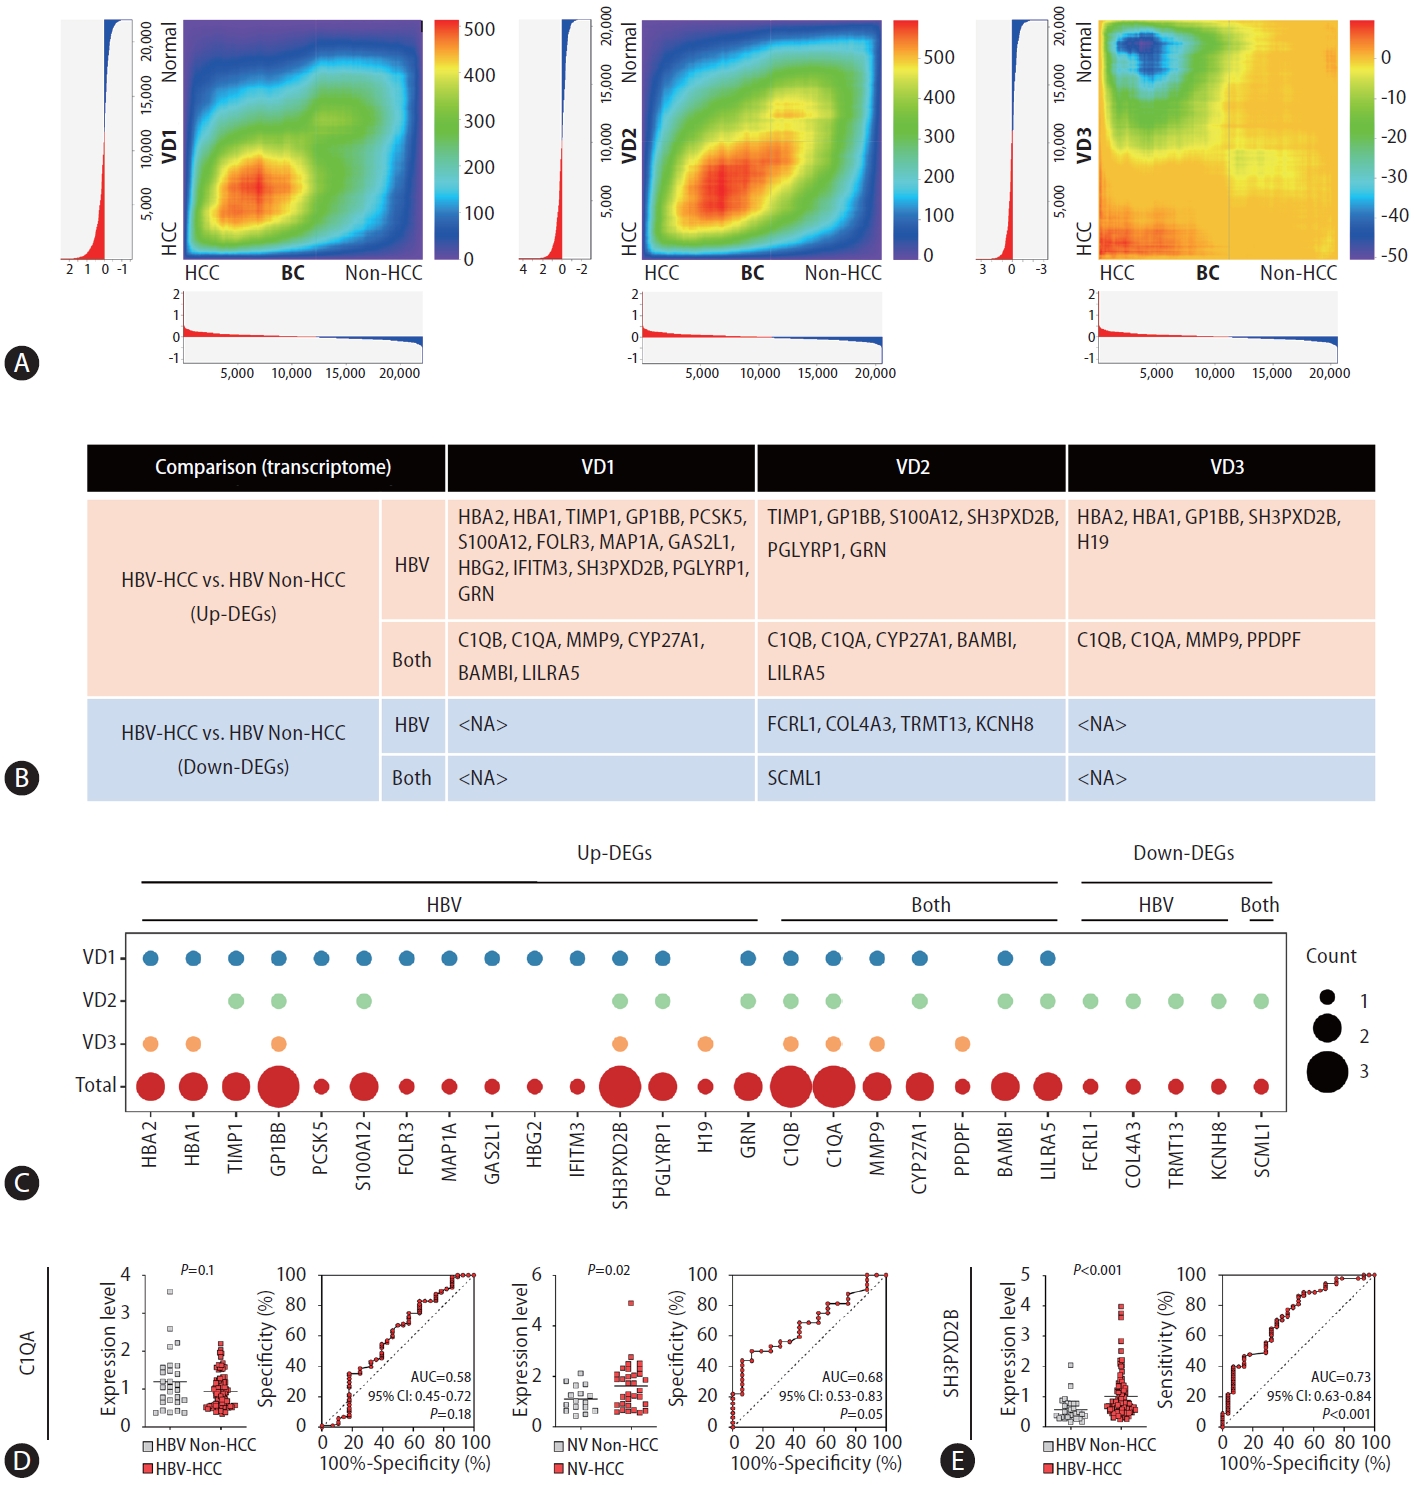
Validation through RRHO and qPCR-AUC analyses. (A) RRHO heatmaps visualizing the overlap intensity between buffy coat WTSand each VD-derived list of genes ranked by DE. The log fold changes are plotted in a bar graph along the x- and y-axes. (B) A table displaying significant DEGs in HBV-HCC vs. HBV-non-HCC patients validated by each VD. (C) Dot plot visualizing the overlapping number of significant DEGs in the HBV-HCC group vs. the HBV-non-HCC group compared with the VD group. (D, E) qRT-PCR and AUC results displaying the diagnostic performance of the identified DEGs. (D) C1QA results in HBV-HCC and NV-HCC. (E) SH3PXD2B results in HBV-HCC. RRHO, rank-rank hypergeometric overlap; WTS, whole-transcriptome sequencing; VD, validation dataset; DE, differential expression; DEG, differentially expressed gene; HBV, hepatitis B virus; HCC, hepatocellular carcinoma; NV, nonviral.
We analyzed the DEGs in each VD and compared each DE result with the buffy-coat DE result. Among the forty significant DEGs in the buffy coat transcriptome analysis of HBV-HCC patients compared to non-HCC patients, 27 genes were significantly differentially expressed in at least one VD (Fig. 3B). In VD1-3, 20, 16, and 9 DEGs overlapped with buffy-coat DEGs (Fig. 3B, Supplementary Fig. 1). The overlapping DEGs in each dataset are summarized in Figure 3C with the total overlap frequency. Excluding HBA2, HBA1, and HBG2, which are considered to originate from erythrocyte contamination, a total of 24 genes overlapped with the buffy coat transcriptome, suggesting that our buffy coat dataset may be reliably used for HCC blood transcriptome analysis and that these genes have the potential to serve as blood biomarkers for HBV-HCC.
To investigate the diagnostic performance of the identified DEGs in discriminating HCC patients from non-HCC patients in clinical settings, we conducted qRT‒PCR and AUC analysis of C1QA and SH3PXD2B, which were significant DEGs in the buffy coat WTS data and all VDs (Fig. 3C–E). No significant difference in qRT‒PCR results for C1QA, which was upregulated in both HBV-HCC and NV-HCC in the buffy coat transcriptome, in HBV groups was detected, though it was significantly upregulated in NV-HCC, with an AUC of 0.68 (95% CI: 0.53–0.83, P=0.05) (Fig. 3D). SH3PXD2B, upregulated only in HBV-HCC in the buffy coat transcriptome, displayed significant upregulation in HBV-HCC based on qRT‒PCR data, with an AUC of 0.73 (95% CI: 0.63–0.84, P<0.001), representing its diagnostic potential as a blood biomarker for HBV-HCC (Fig. 3E). Further examination using early-stage HCC samples compared to at-risk patients (NASH, LC) showed good diagnostic performance for detection of early-stage HBV-HCC using SH3PXD2B, with an AUC of 0.74 (Supplementary Fig. 2A, B).
DE analyses of targeted plasma proteome data
Next, plasma samples derived from HCC patients and healthy controls were subjected to targeted proteome screening for 92 immuno-oncology proteins to investigate etiology-specific HCC markers at the protein level. A total of 59 and 73 DEPs were identified in the HBV-HCC and NV-HCC patients, respectively, compared to the controls (Fig. 4A, B). Compared with those in NV-HCC, a total of 6 proteins were significantly downregulated in HBV-HCC (Fig. 4A). Most DEPs were upregulated in HCC samples compared to the control samples, regardless of HCC etiology, implying that immunooncology proteins are typically upregulated upon HCC development (Fig. 4A). In contrast to the results of the transcriptome analysis, most of the DEPs overlapped between HBV-HCC and NV-HCC patients (Fig. 4B). To examine the correlation between the transcriptome and proteome DE results, we confirmed the expression levels of significant DEPs at the transcriptome level using buffy-coat WTS data. Among the significant DEPs,six up-DEPs exhibited correlated expression patterns at the transcriptome and proteome levels (Fig. 4C). Among the six DEPs, Gal-9 (LGALS9) and HO-1 (HMOX1) were HBV-HCC specific, while only CD70 was NV-HCC specific. Gal-1 (LGALS1) was not etiology specific but rather HCC specific for both HBV-HCC and NV-HCC patients.
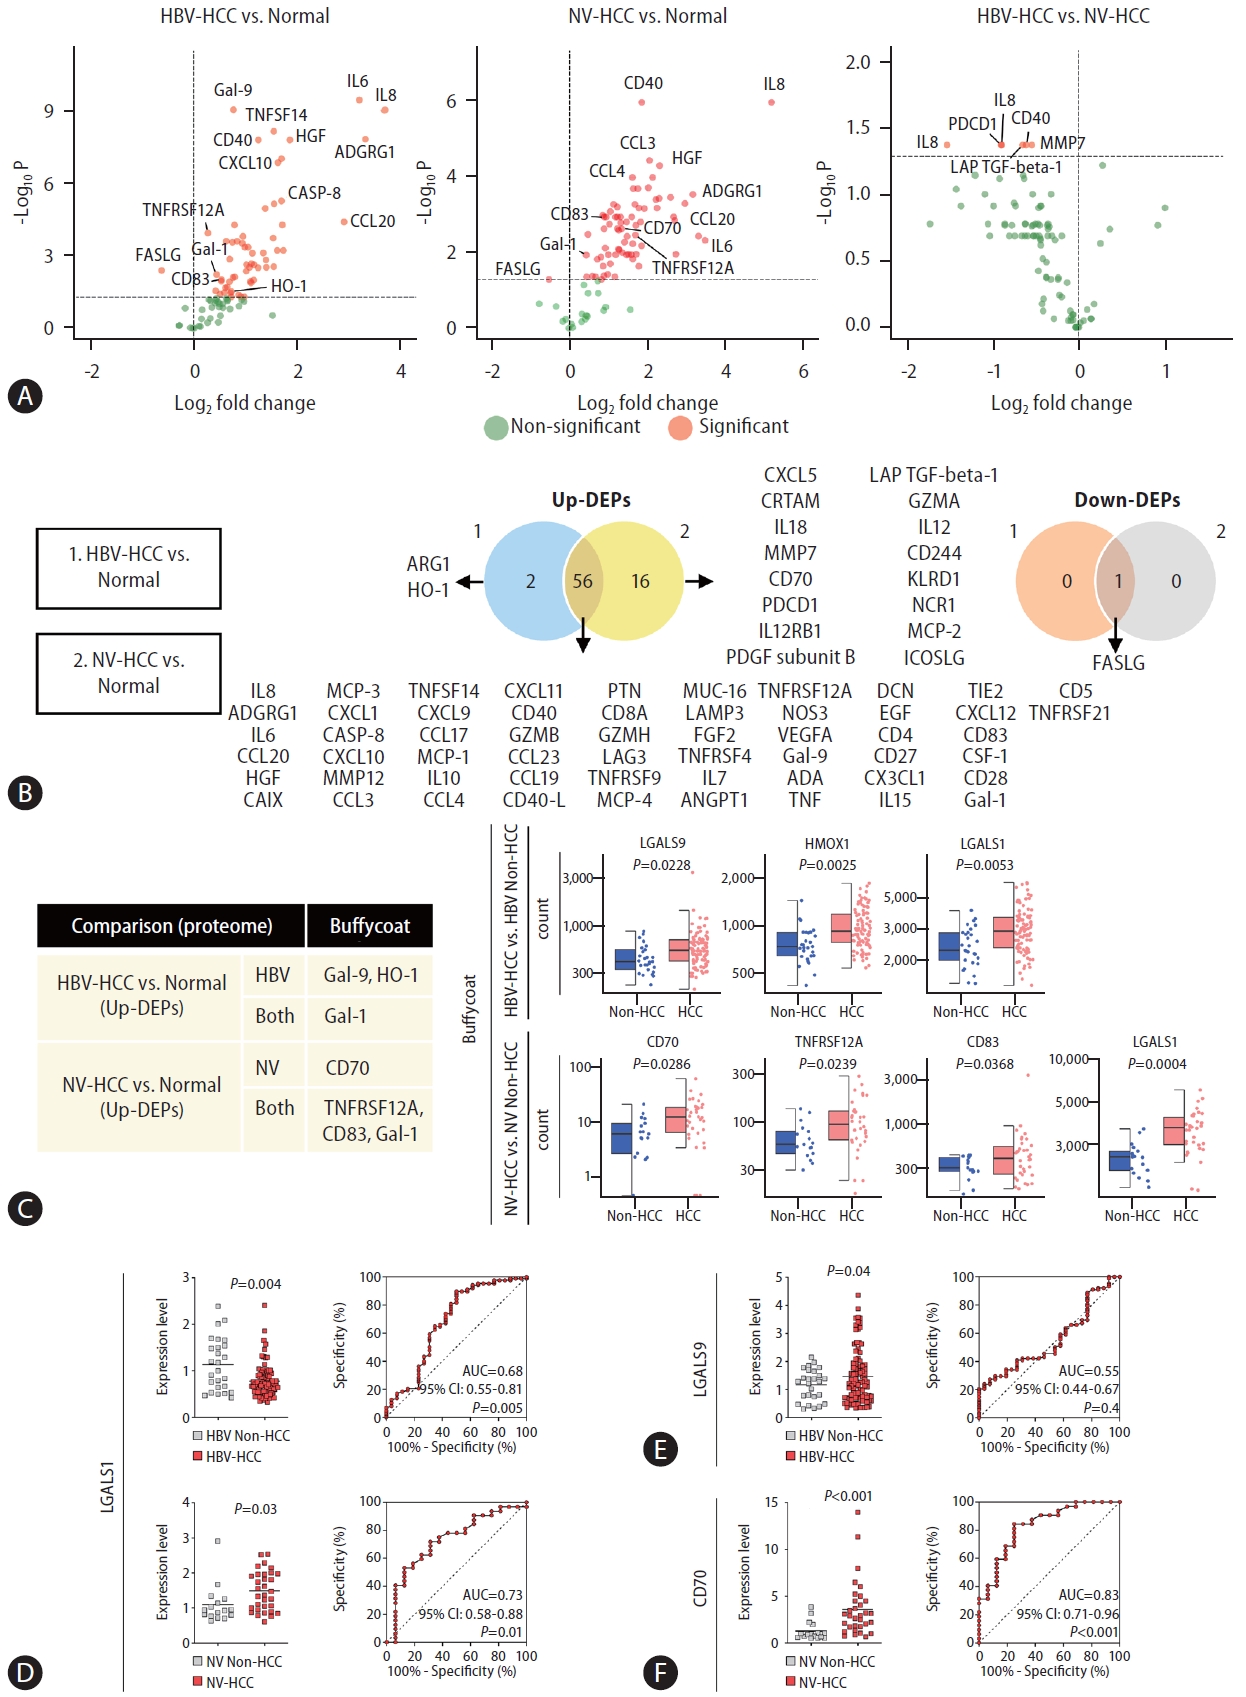
Proteome screening for targeted immuno-oncology genes using plasma samples. (A) Volcano plots visualizing significant DEPs. (B) Venn diagrams summarizing significant up-DEPs and down-DEPs. The list of significant DEPs is provided. (C) A table summarizing significant DEPs with correlating significant DE patterns in buffy-coat WTS data. Haploid plots of the transcriptome expression levels of each DEP are displayed together. (D–F) qRT-PCR and AUC results displaying the diagnostic performance of the identified DEPs at the mRNA level. (D) LGALS1 results in HBV-HCC and NV-HCC. (E) LGALS9 results in HBV-HCC. (F) CD70 results in NV-HCC. DEP, differentially expressed protein; WTS, wholetranscriptome sequencing; HBV, hepatitis B virus; HCC, hepatocellular carcinoma; NV, nonviral.
These genes proven to be upregulated in HCC using multiomics data were examined by qRT‒PCR and AUC analyses to further investigate their potential as biomarkers (Fig. 4D–F). Unexpectedly, HCC-specific Gal-1 was significantly downregulated in the HBV-HCC group, with an AUC of 0.68 (95% CI: 0.55–0.81, P=0.005), but was significantly upregulated in the NV-HCC group, with an AUC of 0.73 (95% CI: 0.58–0.88, P=0.01), implying that Gal-1 might serve as an NV-HCC-specific biomarker (Fig. 4D). HBV-HCC-specific Gal-9 was significantly upregulated in patients with HBV-HCC, though it showed poor diagnostic value, with an AUC of 0.55 (95% CI: 0.44–0.67, P=0.4) (Fig. 4E). Notably, NV-HCC-specific CD70 was significantly upregulated in NV-HCC patients, with an AUC of 0.83 (95% CI: 0.71–0.96, P<0.001),showing its superior potential as an NV-HCC-specific blood biomarker (Fig. 4F). In addition, CD70 displayed great diagnostic potential for detection of early-stage NV-HCC, with an AUC of 0.82 (Supplementary Fig. 2C–E).
Single-cell analysis of the identified DEGs
To assess differences in DEG expression across distinct cell populations in blood, we processed and analyzed publicly available targeted single-cell RNA-seq datasets of innate lymphoid cells (ILCs) derived from patients with HBV-HCC and NV-HCC (see Methods). After batch-balanced KNN correction, seven clusters were identified, among which two were classified as T cells and four as ILCs (Fig. 5A, B). The control and HBV-HCC patient cellular compositions exhibited considerable similarity, whereas NV-HCC patients displayed a distinct cellular profile characterized by an increased proportion of T cells and a reduced presence of ILC3 (Fig. 5C).
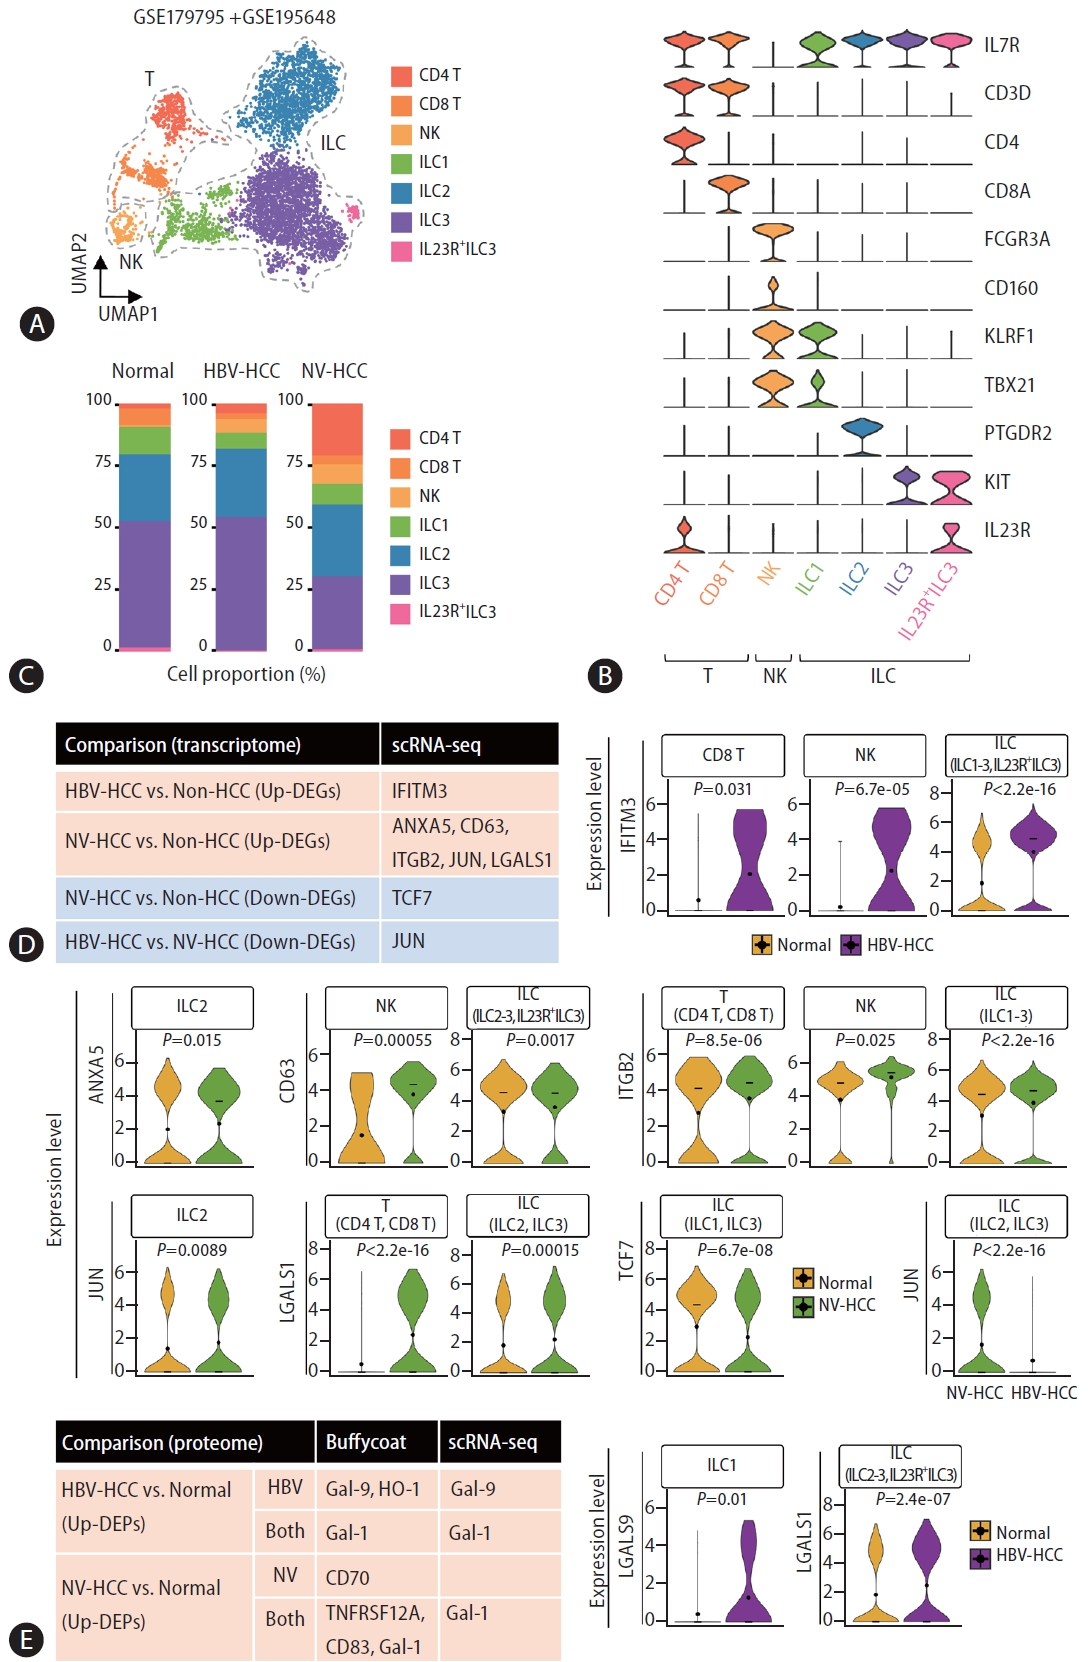
Single-cell analysis of the identified DEGs from multiomics profiling data. (A) Uniform Manifold Approximation and Projection (UMAP) visualizing cell clusters after correction. (B) Violin plots showing relative expression of cell type markers. (C) Stacked bar plot visualizing the composition of cell type proportions. (D) A table summarizing significant DEGs from the buffy coat analysis that had significant DE patterns across individual cell types, as displayed with violin plots showing the relative expression level of each gene in the specified cell types. (E) A table summarizing significant DEGs identified from the buffy coat and plasma multiomics analyses that exhibited significant DE patterns across individual cell types, as displayed with violin plots showing the relative expression level of each gene in the specified cell types. DEG, differentially expressed gene.
We first examined expression levels of DEGs in the buffy coat transcriptome in each cell type and identified a total of 8 genes with expression patterns that correlated with those of the buffy coat transcriptome (Fig. 5D, Supplementary Fig. 3A). IFITM3, one of the up-DEGs in HBV-HCC, was significantly upregulated in CD8 T cells, NK cells, and ILCs compared to healthy controls. For NV-HCC, a total of 5 genes (ANXA5, CD63, ITGB2, JUN, and LGALS1) were significantly upregulated in different cell types but TCF7 was significantly downregulated in ILCs compared to control cells. Compared with that in NV-HCC, JUN was significantly downregulated in ILCs in HBV-HCC. Furthermore, we examined the cell type-specific expression levels of DEGs that exhibited correlating expression patterns at both the transcriptome and proteome levels (Fig. 5E, Supplementary Fig. 3B). HBV-HCC-specific Gal-9 was significantly upregulated in ILC1 of HBV-HCC. Additionally, HCC-specific Gal-1 was significantly upregulated in the ILCs of HBV-HCC patients (Fig. 5E) and in the T cells and ILCs of NVHCC patients(Fig. 5D).
DISCUSSION
HCC accounts for more than 80% of primary liver cancers, and increasing evidence shows that chronic liver diseases such as nonalcoholic fatty liver disease and liver cirrhosis can contribute to HCC development [25,26]. Since late detection of HCC is linked to limited therapeutic options [1], differentiating between liver diseases by easy-to-use reliable biomarkers would greatly help to reduce HCC mortality [27]. Interestingly, recent studies have revealed distinct transcriptomic and immune profiles between viral HCC and nonviral HCC through RNA-seq analyses [28,29], highlighting the importance of an etiology-specific understanding of HCC for effective diagnosis and treatment. Hence, we aimed to unveil etiology-specific blood signatures in HCC through multiomics profiling of buffy coats and plasma.
Our GO analysis revealed different profiles of significant DEGs according to HCC etiology. Given that NV-HCC is likely to develop from metabolic diseases because of excessive oxidative stress [30], it is reasonable that metabolic processes are enriched in NV-HCC. Indeed, oxidative phosphorylation has been defined as a major signal underlying HCC [31]. Additionally, energy metabolic processes such as ATP metabolism are altered in HCC [32] and might be exploited as therapeutic targets. However, most studies do not differentiate HCC by etiology. In our study, enriched metabolic processes were identified as characteristics of NV-HCC, whereas HBV-HCC was characterized by activated immune responses. It has been reported that the microenvironment of HBV-HCC is more immunosuppressive and exhausted than that of NV-HCC [29]. This might be linked to the different response rates to immune checkpoint inhibitors between HBV-HCC patients and NV-HCC patients. In general, patients with HBV-HCC have a better response rate [33]. These results suggest the need for differentiated strategies for HCC treatment and biomarker identification depending on etiology, particularly in cancer immunotherapy.
Among 24 DEGs in HBV-HCC identified through buffy coat WTS analyses combined with VDs, SH3PXD2B upregulation was repeatedly confirmed by all VDs and qRT‒PCR with a high AUC, indicating its great potential as an effective blood biomarker for diagnosis of HBV-HCC. In addition, NV-HCC-specific CD70, as revealed by our multi-omics profiling, has not yet been studied regarding diagnostic values for HCC. CD70 upregulation in NV-HCC was confirmed by qRT‒PCR, with a high AUC,suggesting that CD70 might serve as a novel NV-HCC-specific blood biomarker. Interestingly, CD70 has also been reported as an emerging target in cancer immunotherapy [34].
Notably, SH3PXD2B and CD70 displayed great diagnostic performance for detection of early-stage HCC compared to at-risk patients with NASH or cirrhosis, suggesting that profiling expression of these genes in the buffy coat can serve as an effective strategy for HCC surveillance. This approach may help to effectively distinguish HCC from chronic liver diseases that often share common signatures, such as cirrhosis, thereby enhancing early detection of HCC and consequently reducing HCC mortality [27]. Integrating these results, we suggest that SH3PXD2B and CD70 are potent blood-based biomarkersfor HCC diagnosis and potential therapeutic targets across different etiologies.
Finally, we validated cell type-specific differences in DEG expression using publicly available targeted single-cell RNA-seq datasets. Although these datasets derived from ILCs isolated from the PBMCs of HCC patients, we identified a total of 7 cell clusters, including T cells, NK cells, and ILCs. The limited number of target genes and cell types included in the datasets precluded validation of SH3PXD2B and CD70, which are proposed as effective biomarkers with diagnostic potential. Unlike SH3PXD2B, CD70 was included in the targeted gene panel, but its expression in the identified cell types was not detected (Supplementary Fig. 4A). Further investigation through the ABC portal [35] using healthy PBMCs suggested that CD70 was expressed in B cells and dendritic cells, though SH3PXD2B was not obviously detected (Supplementary Fig. 4B). Despite these limitations, single-cell validation enabled us to investigate expression of multiple DEGs at the cell type level. Notably, IFITM3 was shown to be upregulated in all cell types except for CD4 T cells, emphasizing its reliability as a biomarker. Although the limited availability of single-cell RNA-seq datasets restricts validation of several genes at the single-cell level, their validation using bulk RNA-seq datasets and multiomics profiling emphasizes the effective utility of buffy coat mRNA signatures for HCC diagnosis.
Overall, we discerned etiology-specific blood biomarkers for HCC by employing multiomics profiling, incorporating buffy coat WTS and targeted plasma proteome data. This identification was corroborated through validation using publicly available bulk RNA-seq and single-cell RNA-seq datasets and conducting qRT‒PCR with AUC analysis. Our investigation confirmed distinctive gene expression landscapes for HCC across different etiologies at the blood level, suggesting that several genes, particularly SH3PXD2B and CD70, are novel etiology-specific blood biomarkers. Our comprehensive multiomics profiling and validation across diverse datasets may serve as a resource for identifying etiology-specific blood biomarkers for HCC, with the potential to be effectively applied in clinical settings, and for facilitating exploration of etiology-specific therapeutic targets.
Notes
Authors’ contribution
Conceptualization: JH, JWE, HJC, SBL. Data Curation: JH. Formal Analysis: JH, JWE. Funding Acquisition: HJC, SBL. Investigation: JH, JWE, SP, HJC, SBL. Project Administration: HJC, SBL. Resources: JWE, GOB, JYC, SSK, HJC, SBL. Supervision: HJC, SBL. Validation: JWE, GOB. Visualization: JH. Writing – original draft: JH, JWE, GOB, SP, HJC, SBL. Writing – review & editing: JH, JWE, GOB, SP, HJC, SBL. All authors have read and approved the final manuscript.
Conflicts of Interest
The authors have no conflicts to disclose.
Acknowledgements
The biospecimens and corresponding clinical information were provided by the Biobank of Ajou University Hospital, a member of the Korea Biobank Network. S.B.L. is supported by the National Research Foundation (NRF) of Korea (2020M3A9D8037604, 2020R1A6A1A03043539, 2022R1A2C1 008793, and 2022R1C1C1004756) and the Korea Health Technology R&D Project of the Korea Health Industry Development Institute (KHIDI), funded by the Ministry of Health & Welfare, Republic of Korea (HR22C1734). H.C.J is supported by the National Research Foundation (NRF) of Korea (NRF-2021R1C1C1009619) and the Korea Health Technology R&D Project of the Korea Health Industry Development Institute (KHIDI), funded by the Ministry of Health & Welfare, Republic of Korea (HR22C1734). J.W.E. is supported by the National Research Foundation (NRF) of Korea (2022R1A2C2092422) and the 2023 Regional Industry-linked University Open-Lab Development Support Program through the Commercializations Promotion Agency for R&D Outcomes (COMPA) funded by the Ministry of Science and ICT. and the Korea Health Technology R&D Project of the Korea Health Industry Development Institute (KHIDI), funded by the Ministry of Health & Welfare, Republic of Korea (HR21C1003).
Abbreviations
AUC
area under the curve
CI
confidence interval
DE
differential expression
DEG
differentially expressed gene
DEP
differentially expressed protein
GO
Gene Ontology
HBV
hepatitis B virus
HBV-HCC
hepatitis B virus-associated hepatocellular carcinoma
HCC
hepatocellular carcinoma
ILC
innate lymphoid cell
NV-HCC
nonviral-associated hepatocellular carcinoma
PBMC
peripheral blood mononuclear cell
RRHO
rank-rank hypergeometric overlap
VD
validation dataset
WTS
wholetranscriptome sequencing
SUPPLEMENTAL MATERIAL
Supplementary material is available at Clinical and Molecular Hepatology website (http://www.e-cmh.org).
Haploid plots for DEG expression from each validation dataset. (A–C) Haploid plots displaying the gene expression level of each significant DEG. (A) DEGs from VD1. (B) DEGs from VD2. (C) DEGs from VD3. DEG, differentially expressed gene; VD, validation dataset.
qPCR-AUC analysis of the identified DEGs for detection of early-stage HCC. (A, B) qRT-PCR and AUC results for the buffy coat DEGs. (A) C1QA results for HBV-HCC and NV-HCC patients. (B) SH3PXD2B results for HBV-HCC. (C–E) qRT-PCR and AUC results of DEGs from multiomics profiling. (C) LGALS1 results for HBV-HCC and NV-HCC patients. (D) LGALS9 results for HBV-HCC. (E) CD70 results for NVHCC. DEG, differentially expressed gene; HCC, hepatocellular carcinoma; HBV, hepatitis B virus; NV, nonviral.
Violin plots for DEG expression across different cell types. (A, B) Violin plots displaying the relative expression level of each significant DEG in each cell type. (A) DEGs from buffy coat WTS data. (B) DEGs from the buffy coat and plasma multiomics data. DEG, differentially expressed gene; WTS, whole-transcriptome sequencing.
Single-cell analysis of CD70 and SH3PXD2B using extended datasets. (A) A Violin plot displaying relative expression of CD70 in the GSE179795 + GSE195648 dataset. (B) Box plots displaying relative expression of CD70 and SH3PXD2B in multiple datasets included in the ABC portal.
Primer sequences for qRT‒PCR
Baseline characteristics of the included patients
Clinical information of the patients in the validation datasets
References
Article information Continued
Notes
Study Highlights
• HBV-HCC and NV-HCC display distinct gene expression profiles compared to non-HCC at the buffy coat and plasma level.
• Validation by publicly available RNA-seq datasets and qRT-PCR confirms the reliability of the suggested etiology-specific HCC biomarkers.
• Single-cell RNA-seq analysis further confirms etiology-specific differences in DEG expression across distinct immune cell types found in blood.